E
valuating thEu
sE ofg
rEEnB
uildingi
ncEntivEs inM
EMphis, t
EnnEssEE:
Prepared by:
Vivian C. Jaynes, Master’s Degree Candidate, May 2012
Department of City and Regional Planning, The University of North Carolina at Chapel Hill [email protected]; 901-355-5342
Acknowledgements
Thank you to the developers and professionals who shared their expertise, knowledge, and opinions. Without them, this project would not have been possible.
Ron Belz, Belz Enterprises, Inc. Jeremy Benkin, CBRE
Rusty Bloodworth, Boyle Investment Company Bill Carson, McCormack Baron Salazar
Bridget Chisholm, BWC Consulting John Dudas, Belz Enterprises, Inc.
Andy Kitsinger, Downtown Memphis Commission Terry Lynch, Southland Capital
James Rasberry, Rasberry CRE Josh Somes, SustainStudio
Mark Straub, Pennrose Development & Property Management Morris Thomas, Belz Enterprises, Inc.
Andrew Trippel, ULI Memphis
Brandon Wellford, Memphis BioWorks Jason Wexler, Henry Turley Company Archie Willis, Community Capital
Thank you also to the following professionals who provided information on their cities’ experience with green building incentives.
David Hirschle, Project Manager, Indianapolis Office of Sustainability
Eric Denson, Senior Community Development Analyst, Cincinnati Department of Community Development
Craig Owensby, Public Information Officer, Metro Nashville/Davidson County Planning Department
Maria Koetter, Director, Louisville Department of Sustainability
Special thanks go to Paul Young and Christine Donhardt with the Memphis-Shelby County Office of Sustainability for letting me tackle this project in the first place. Throughout the process, they were enthusiastic, responsive, and supportive. I would also like to thank my academic advisor, Philip Berke, for providing valuable insight along the way.
Table of Contents
Executive Summary ...1
I. Background Information and Literature Review ...5
Sustainability Movement in Memphis ...5
Memphis Demographic and Economic Characteristics ...6
Existing Research on Green Building ...9
II. Interviews ...14
Methods ...15
Green Building Experience ...16
Market and Demand for Green Building ...16
Barriers ...17
Incentives ...19
Summary ...21
III. Case Studies ...23
Nashville ...23
Austin ...25
Cincinnati ...27
Louisville ...29
Indianapolis ...30
Raleigh ...32
Seattle ...32
IV. Recommendations ...35
References ...38
Appendix A: Developer Interview Questionnaire and Case Study Questionnaire ...40
Appendix B: Nashville Bonus Height Program Standards ...42
Appendix C: Cincinnati CRA Green Building Tax Exemption Materials ...43
Appendix D: Indianapolis Green Building Incentive Summary and Worksheet ...55
List of Tables
Table 2. Race and ethnicity, 2010 ...6
Table 1. Population growth, 1990-2010 ...6
Table 3. Percent of residents below the poverty line, 1990-2010 ...7
Table 6. Median household income, 2010 ...7
Table 4. Age group proportions, 2000 and 2010 ...7
Table 5. Housing tenure, 2010 ...7
Table 7. Educational attainment, 2010 ...8
Table 8. Cost of living index for Memphis and comparable metro areas, 2011 ...9
Table 9. Local green building program types ...12
Table 10. Local green building incentives by type ...13
Table 11. Profile of developers ...15
Table 12. Cincinnati CRA abatement example ...28
List of Figures
Figure 1. Sustainable Shelby Plan, Cover Page ...5
Figure 2. Annual unemployment rate comparison, 2000-2010 ...8
Figure 3. The Gulch neighborhood, Nashville - LEED ND ...23
Figure 4. Pedernales Lofts, Austin - 5 star rated green multifamily project ...25
Figure 5. LCRA Redbud Center, Austin 4 star rated green commercial project ...26
Figure 6. LEED Silver historic buildings, Cincinnati ...28
Figure 7. Historic Buick Building, LEED Gold CI, Indianapolis ...30
Figure 8. Historic Cobb Building, LEED Silver, Seattle ...33
Executive Summary
With sustainability taking hold as the organizing principle for many urban areas in the U.S., issues such as energy efficiency and green building techniques are more important than ever. Cities across the country have instituted green building programs that rely on a number of different policy mechanisms and regulations to promote a more sustainable built environment. These programs often include mandates for publicly-owned buildings to meet certain energy and design standards as well as incentives to encourage the private development community to build more sustainably. Despite the widespread use of incentives to further energy and building efficiency goals, there has been little research or evaluation on how to design and implement an incentive-based green building program.
This study aims to provide information and recommendations to leaders in Memphis-Shelby County, Tennessee on how to design and implement an incentive-based green building program. The study methodology has three parts: 1) a review of existing literature and research on green building and sustainable development in the U.S.; 2) interviews with developers and other professionals who work in related fields (planning and architecture) in the Memphis area, and; 3) case studies of incentive-based green building programs in select U.S. cities. Although all three research methods were valuable, the interviews provided the most in-depth information on these major themes: the market for green building in the Memphis area, the barriers to completing green building projects, and the best kinds of incentives to help encourage developers to build more sustainably. Based on the results of this methodology, the following recommendations were developed for the Memphis-Shelby County Office of Sustainability as they begin the process of designing an incentive-based green building program.
1) Lead the Way with a Green Building Mandate for Publicly Owned Facilities: Though not a direct incentive, a formal commitment made by the city and county to require that new facilities and major renovations meet a certain minimum energy efficiency and green design standard will help set an example for the private development community.
2) Coordinate Green Building Incentives with Existing Incentive Programs and Initiatives: The city and county should find ways to integrate green building incentives into existing incentive programs and ensure that new incentives fit in with the goals of these existing programs.
3) Focus on Structural and Marketing Incentives First; Strive to Add Financial Incentives: Structural and marketing incentives require less financial and
administrative capacity and should help provide momentum to implement more complex and costly financial incentives later. The most attractive incentives that fit into the structural and marketing categories include: density bonuses, reduced minimum parking requirements, and publicity for green building projects through awards programs or publications.
participate in a green building incentive program. Possibilities include: standards that do not require third party certification or incentives that focus on energy efficiency retrofits for existing buildings.
5) Focus on Simplicity, Accessibility, and Usability: These broad goals will not only make the incentives more useful to developers but will also make them easier to implement and administer. Strategies for achieving these goals include: integrating green building incentives into the existing regulatory and permitting framework to streamline the process for developers; continuing to involve devel-opers in the design and implementation phases to get feedback and ensure buy-in; considering working with developers to test the impact and usefulness of the incentives by working them through actual development deals.
6) Complement with Ongoing Efforts Related to Green Building & Sustainable Development: Green building incentives will be most effective when paired with planning efforts focused on creating more sustainable development patterns and encouraging economically robust and resilient neighborhoods. Regional coordination and collaboration are crucial to this process.
Introduction
In cities across the United States, political officials, community leaders, and residents are increasingly embracing sustainability as the organizing principle for all aspects of urban development. Although poor economic conditions have pushed cities to focus on sustainable economic development and job creation as of late, the sustainability movement has influenced many other issues, ranging from transportation systems that offer more options for non-motorized travel and mass transit to growth management techniques that encourage infill and compact development close to existing infrastructure and public facilities. To formalize this commitment, many U.S. cities have developed new planning documents that address specific goals, objectives, programs, and policies related to sustainability. With places as different as El Paso, Texas, Northampton, Massachusetts, and New York City adopting these kinds of plans, sustainability is clearly on the rise in U.S. cities.
As part of this movement, advocates over the last two decades have increasingly emphasized the need to take a closer look at how buildings can contribute to sustainability goals. The U.S. Environmental Protection Agency (EPA) estimates that buildings account for approximately 40% of U.S. energy use, 40% of U.S. greenhouse gas emissions, and 10% of U.S. freshwater use (U.S. EPA, 2008). Taking into account related issues such as building placement and siting – i.e. buildings that are located in greenfields where driving is the only transportation option – these figures could be even higher. These dramatic numbers clearly show the potential that building efficiency improvements could have in advancing sustainability goals such as reduced energy use and reduced green house gases.
Although the U.S. Green Building Council has been the main force behind the national green building agenda, individual cities have started to design their own unique green building programs as a way to advance sustainable development goals. While Austin, Seattle, and Portland were some of the first cities to develop green building programs, other cities have gotten in on the game, ranging from larger cities such as Chicago and Atlanta to smaller cities such as Asheville, NC and Grand Rapids, Michigan. These local programs come in a variety of shapes and sizes depending on the particular political, social, and environmental context and administrative capacity. Despite these differences, most of these programs utilize a mixture of regulations and incentives to encourage more sustainable building practices. Although these kinds of local programs have expanded rapidly over the last decade or so, there seems to be little evaluation or research on their impact and effectiveness. In particular, it is unclear how incentives for these programs are developed and implemented. What is the process for designing these incentives and what steps are involved to ensure successful implementation? Depending on the local context, which incentives are most effective? Do incentives really work to encourage the private development community to build more sustainable projects?
I. Background Information and Literature Review
Sustainability Movement in MemphisIn 2008, the city of Memphis and Shelby County, Tennessee began the formal process of devising sustainability goals and policies for the area which culminated in the creation of the Sustainable
Shelby Implementation Plan. Looking at a wide range of issues, the plan focuses on the three legs
of sustainability – equity, environment, and economy – and includes an extensive set of concrete implementation actions. In addition, the plan incorporates a substantial public education and awareness component as well as a section devoted completely to internal actions that local government agencies can take in their operations to “lead by example” in achieving sustainability goals.
To begin the process of implementing the 151 total strategies included in the plan, the city and county created the Office of Sustainability in April 2011. Although the office is tasked with implementing all 151 strategies, a short-term work plan identifies several key strategies from each section of the larger plan that will help lay the foundation for sustainability initiatives throughout the region. As part of the “A Leader for Green Buildings” subcategory under the “Great Neighborhoods for a Great Community” section, this paper specifically addresses short term strategy 2.7.6 which states: “Survey local developers about what incentives would be most effective in creating more sustainable projects and study major metro areas to learn how they exceed their local standards for sustainable design.” This particular strategy goes hand in hand with several other short term tasks, including the formation of a green building task force to recommend green updates to the existing building code (2.2.25) and the development of a public education campaign focused on raising awareness of the true costs of green building and infrastructure (2.7.4).
In addition to these overarching planning efforts and framework, a number of other major initiatives related to sustainability have recently been implemented and – perhaps most importantly – have attracted quite a bit of public attention. These efforts include the completion of the 7-mile Shelby Farms Greenline in 2010, the hiring of the city’s first bicycle-pedestrian coordinator, continued progress toward the city mayor’s goal of creating fifty-five miles of bicycle lanes in the city by summer 2012, and the city’s participation in the national EV (electric vehicle) project.
There are also a handful of green building incentives and initiatives already in place in Memphis and Shelby County. The Downtown Memphis Commission (formerly the Center City Commission) added a green building incentive to its Payment in Lieu of Taxes (PILOT) program three years ago. This PILOT program aims to encourage development and redevelopment projects in the downtown
Figure 1. Sustainable Shelby Plan, Cover Page
and central core of the city by offering tax abatements to qualifying projects that meet community goals. PILOT projects that attain LEED certification are eligible for a two-year extension of the tax abatement.
Memphis Light Gas and Water (MLGW), the city’s public utility, also offers various weatherization and energy-efficiency improvement programs for property owners. In addition, MLGW provides grant money through the city’s USGBC chapter for LEED-New Construction certified projects that exceed basic requirements for energy and water efficiency. Finally, MLGW has developed the EcoBUILD program for new residential buildings that ensures construction exceeding the minimum efficiency levels of the local building code.
Memphis Demographic and Economic Characteristics
Any public policy – whether focused on green building, economic development, or public health - must be responsive and tailored to the particular context in which it is being proposed. To get a better sense of the
Memphis metropolitan context, this section will examine some of the basic demographic and economic characteristics of the area.
Demographics
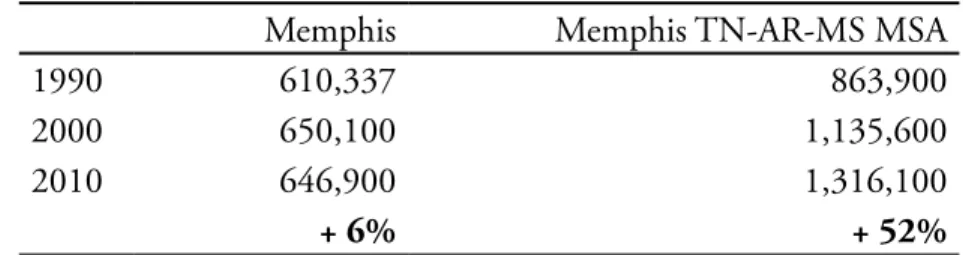
Based on the 2010 U.S. Census, Memphis is the
20th largest city in the country while the Memphis TN-MS-AR Metropolitan Statistical Area (MSA) ranks 41st nationwide. Population growth over the last 30 years, however, has been relatively modest, with the city showing a slight decrease in population from 2000 to 2010 (see Table 1). Most
growth has been in DeSoto County, MS and in areas of Shelby County outside of the city. These numbers highlight some of the challenges that the city in particular faces in retaining and attracting
residents and companies and encouraging redevelopment.
Looking at race and ethnicity, the city and the metropolitan area show stark differences in terms of white and black population figures. While the city is majority black by a 2 to 1 measure, the metro area as a whole is almost evenly matched (see Table 2). Although these numbers demonstrate some of the traditional
Memphis Memphis TN-AR-MS MSA
1990 610,337 863,900
2000 650,100 1,135,600
2010 646,900 1,316,100
+ 6% + 52%
Table 1. Population growth, 1990-2010
Memphis % Total Memphis
TN-AR-MS MSA % Total
White 190,100 30% 630,700 48%
Black or African American 410,000 63% 601,000 46%
Asian 10,100 2% 24,500 2%
Hispanic or Latino (of any
race) 42,000 6% 65,400 5%
Table 2. Race and ethnicity, 2010 Source: U.S. Census Bureau
racial divisions in the area, they also show how unique the area is in that the MSA will likely soon be one of the few majority African-American metro areas in the country.
Poverty has been a long-standing issue in the
Memphis area. While Table 3 shows the fluctuations in the percentage of residents below the poverty line over the last thirty years, both the city and the MSA have had consistently high poverty rates. The 2010 numbers make the Memphis MSA the poorest metropolitan area with over one million people in the country ahead of New Orleans (17.4%), Miami-Fort Lauderdale (17.1%), and Birmingham, AL (17%) (Charlier, 2011).
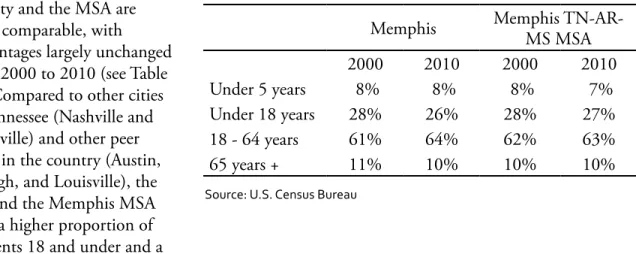
In terms of age of residents, the city and the MSA are fairly comparable, with percentages largely unchanged from 2000 to 2010 (see Table 4). Compared to other cities in Tennessee (Nashville and Knoxville) and other peer cities in the country (Austin, Raleigh, and Louisville), the city and the Memphis MSA have a higher proportion of residents 18 and under and a
lower proportion of residents 65 and over. However, the 2010 Census figures show a slight decrease in the percentage of residents under 18, and a slight increase in residents between 18 and 64. These trends could have important implications for development patterns and housing choices as more baby boomers move into the 65 and over category in the coming years.
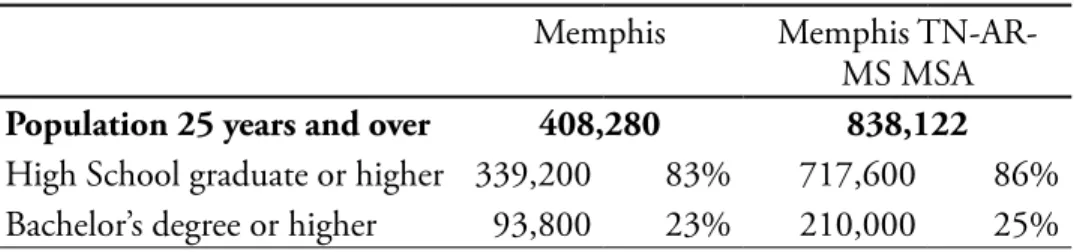
While the city and the MSA have comparable levels of educational attainment, the two differ drastically when looking at median income and housing tenure (see Tables 5-7). Again, these numbers paint a picture of a relatively poor
city surrounded by wealthier, higher-growth areas.
Memphis Memphis
TN-AR-MS MSA
1990 23.0% 18.4%
2000 20.6% 15.3%
2010 26.5% 19.1%
Table 3. Percent of residents below the poverty line, 1990-2010
Source: U.S. Census Bureau
Source: U.S. Census Bureau
Source: U.S. Census Bureau Source: U.S. Census Bureau
Memphis Memphis TN-AR-MS MSA
2000 2010 2000 2010
Under 5 years 8% 8% 8% 7%
Under 18 years 28% 26% 28% 27%
18 - 64 years 61% 64% 62% 63%
65 years + 11% 10% 10% 10%
Table 4. Age group proportions, 2000 and 2010
Memphis Memphis TN-AR-MS MSA Owner-occupied
housing units 52% 64%
Renter-occupied
housing units 48% 36%
Table 5. Housing tenure, 2010
Memphis Memphis TN-AR-MS MSA
$37,000 $45,400
Economic Characteristics
Historically serving as a hub for agricultural commerce and trade, Memphis continues to function as an important center for goods movement, distribution, and logistics. Freight and logistics companies have a large presence in the city, and FedEx, which is headquartered in Memphis, is the MSA’s largest employer. Other important industries include biomedical research and medical device manufacturing, education and health services, and professional and business services.
In terms of unemployment, the Memphis area has largely mirrored national trends over the last decade, with relatively low rates in the late 1990s and early 2000s and increases in 2004 and in 2007 as a result of the economic recession (see Figure 2).
Memphis Memphis
TN-AR-MS TN-AR-MSA
Population 25 years and over 408,280 838,122
High School graduate or higher 339,200 83% 717,600 86%
Bachelor’s degree or higher 93,800 23% 210,000 25%
Table 7. Educational attainment, 2010
Source: U.S. Census Bureau
3.0 5.0 7.0 9.0 11.0 13.0
2000 2001 2002 2003 2004 2005 2006 2007 2008 2009 2010 Local Area Unemployment Statistics
Annual Unemployment Rates 2000-2010
Source: Bureau of Labor Statistics: Local Area Unemployment Statistics (LAUS)
Memphis, TN-MS-AR Metropolitan Statistical Area Shelby County, TN City of Memphis, TN Figure 2. Annual unemployment rate comparison, 2000-2010
Although the city, MSA, and county have followed similar trajectories in terms of unemployment over the last decade, it is apparent that the city has not performed as well comparatively in terms of actual rates. This difference reflects some of the economic divisions between the city and the region, as much of the growth and development in population and employment has moved outward. In terms of cost of living, the Memphis MSA performs well as compared to other peer or comparable cities in the country (see Table 8). Housing, utilities, and transportation are three areas where
Memphis especially excels as related to cost. Although this low cost of living is certainly a positive thing for many area residents, the fact that these numbers are so low – especially in terms of housing – seems to be a reflection of the area’s lower rates of growth and development.
Looking at the demographic and economic characteristics of the Memphis area, several key issues stand out. Challenges include: poverty; disparities between the city and the rest of the MSA in terms of population growth, poverty, employment, and income; lower rates of college-educated residents as compared to other metro areas; and shifts in age group proportions as the number of residents over 65 appears to be growing. Despite these and other challenges (public school system restructuring, negative perceptions of crime and safety within the city, municipal deficits), the Memphis region has a number of attributes in its favor, from its location to its low cost of living to its diversity. Coupled with the area’s growing sustainability movement and the push to create more livable and economically robust and resilient neighborhoods, there is certainly momentum toward addressing these long-standing issues and building on the region’s positive natural, cultural, and economic features.
Existing Research on Green Building
Most of the literature on green building falls into three broad categories: technical design and engineering guides, research evaluating the costs and benefits of green building, and research on how to develop and integrate public policy related to green building, including municipal green building programs. The following literature review will focus on the latter two categories.
Metro Area Composite Grocery Housing Utilities Transportation Healthcare Misc. Goods
Richmond, VA 100.1 104.4 95.1 108.5 101.9 108.8 98.3
Little Rock, AR 95.7 94.4 89.1 105.3 95.0 91.0 99.8 Pittsburgh, PA 94.8 104.8 76.7 100.6 111.2 93.9 99.6
Raleigh, NC 93.8 101.3 79.7 104.5 96.6 100.5 97.8
Louisville, KY 91.7 87.9 83.4 102.3 98.9 87.5 95.5 St. Louis, MO 91.1 95.1 75.3 104.4 98.3 98.9 95.6 Nashville, TN 90.2 97.4 70.4 87.1 93.4 91.8 104.5 Memphis, TN 85.9 91.3 72.4 88.2 93.2 99.3 90.6
Weighting
Factor 100% 13% 30% 10% 10% 4% 33%
Table 8. Cost of living index for Memphis and comparable metro areas, 2011
Average for U.S. metro areas = 100
Cost-Benefit Evaluation
In terms of evaluation, Gregory Kats (2010) provides a thorough examination of the various costs and benefits connected to sustainable development. Moving from the building level up to the community and national levels, Kats presents both quantitative and qualitative analyses of these topics. Although his work addresses a range of issues – from construction costs and energy use savings to health and productivity benefits and financial and social impacts – Kats concludes that the benefits from green building and green community design (reduced energy use and CO2 emissions, improved air quality and employee productivity, public health benefits, etc.) greatly outweigh the average 2% cost increase that comes along with green building construction.
A number of publications examine the costs and benefits of green buildings specifically from the perspective of developers. Although there is not a huge body of work on this topic, most research indicates that construction cost increases for green buildings (usually defined as LEED or Energy Star) are generally lower than perceived and are on average approximately 1-2% higher than conventional buildings (Morris, 2007; Kats, 2010; Morris and Matthiessen, 2007; Steven Winter Associates, 2004). Other studies have found that operating costs are generally lower, and rental rates and sales prices per square foot are generally higher (Miller, Spivey, and Florance, 2008; Kats, 2010; Bartlett and Howard, 2000).
Green Building Policy and Planning
Over the last 10-15 years, an increasing number of academics and planning professionals have produced research on green building policy, planning, and implementation. While there is some work on green building planning and policy on the state and federal levels (May and Koski, 2007; Retzlaff, 2010; Jacobs, Kelly, Sobolewski, 2007), the more successful implementation of local green building policies and programs has resulted in a larger amount of research at this level.
In terms of local green building policy, topics range from the evaluation of green building codes to examinations of the process of how green building programs and policies are adopted. Shapiro (2011) looks specifically at the limitations of green building construction codes and recommends 1) that planners and officials take an active role in ensuring standards meet local needs and requirements, and 2) that planners and officials should not rely solely on green building codes to fulfill sustainability goals, but should also look at the impact of improving the sustainability of other development management plans (stormwater, waste management, zoning code, etc.). Van Schaack and BenDor’s (2011) study of green building programs in North Carolina provides a number of key observations for transition areas, including: the impact of visible municipal green building projects in building capacity and support; the importance of market-based strategies in getting green projects off the ground; and the need for education and outreach to help start the institutionalization of green building practices.
to infrastructure and land development plans.
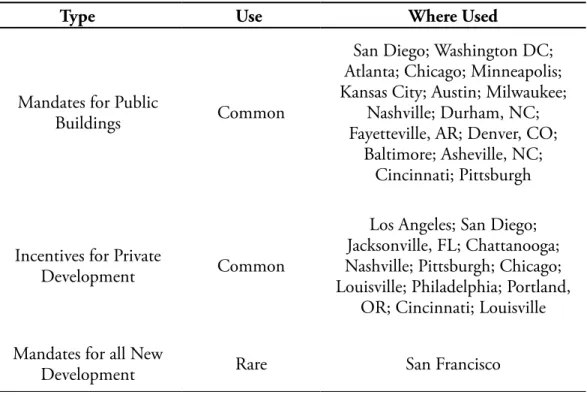
Sentman, Del Percio, and Koerner (2008) outline three broad types of local green building legislation: green building mandates for public construction (i.e. municipal buildings), green building incentives for private construction, and green building mandates for private construction. Although the authors seem to view green building incentives for private development as a
transitional phase between mandates for public construction and mandates for private construction, they do acknowledge that flexibility is key in encouraging green building practices and no single type of legislation is perfect. The authors also outline some of the basic types of incentives used in local green building policies, including expedited permitting, density bonuses, tax credits, and reduced permit fees. This article is particularly useful for its discussion of the use of third-party green
building verification systems in granting incentives at the local level. The LEED rating system seems to be by far the most common third-party verification system used for determining qualifications for local incentives, although the authors do offer up some alternative standards used on the local level in places like Issaquah, WA and Calabasas, CA. The use of third-party verification systems can perhaps bring up legal issues, particularly when tied to meeting regulatory standards under building codes.
Green Building Programs and Assessment
A number of resources provide case studies of local green building programs (USGBC, 2011; National Association of Industrial and Office Properties Research Foundation, 2007; Portney, 2003; Wenz, 2008; Rainwater, 2007; Rainwater, 2009; Rainwater and Lang, 2012). In particular, Brooks Rainwater’s studies for the American Institute of Architects’ Local Leaders in Sustainability series (2007; 2009; 2012) present a comprehensive overview of local green building programs around the country and their evolution over time. Important facts from these reports include: over 138 U.S. cities have green building programs, approximately 41% are located in the western states (the vast majority in California), and most green building programs have their own unique design, features, and tools to better match the local context. In each report, Rainwater identifies case study communities whose green building programs can offer lessons to other cities. Although the most recent report (March 2012) attempts to identify some basic best practices on how to design and implement municipal green building programs, there does not seem to be much research that specifically evaluates the effectiveness of these programs. The relatively short history of these initiatives may help explain this lack of material.
Lucia Athens’s (2010) publication, Building an Emerald City: A Guide to Creating Green Building Policies and Programs, serves as a how-to manual for municipalities considering the creation of green building programs. Important topics include: how to build support for green building initiatives, how to foster change and innovation in markets and key organizations, best practices for developing policies for public green buildings, green building program services, green building codes and incentives, and measuring program impacts.
programs, however, focus on offering incentives to encourage private developers to build greener projects or to encourage property owners to improve energy efficiency. Many programs also contain a mix of both public building mandates and incentives for private developers and property owners.
Green Building Incentives
Looking more specifically at research on green building incentives, the commercial development industry has been involved in outlining the use of local incentives across the country and providing recommendations for action to developers and real estate professionals. The National Association of Industrial and Office Properties Research Foundation commissioned a study in 2007 (NAIOP, 2007) that serves as a basic primer on local green building incentives. Specifically, the study completed a survey of developers, architects, and municipal government officials to learn more about the extent and impact of local green building incentives. This research proved useful in my preparation of questions for the developer interviews.
In addition, the USGBC offers quite a bit of information on local policy, incentives, and the promotion of green building practices. The State and Local Policy page of the USGBC website (USGBC, 2011) contains a number of resources for policy makers. The Green Building Incentive Strategies sheet lays out broad categories of incentives, including structural incentives (expedited review/permitting processes, density and height bonuses), financial incentives (tax credits, fee reduction/waiver, grants, revolving loan funds), and other incentives (technical and marketing assistance). Table 10 presents an overview of the major green building incentives used in U.S. cities. This chart was adapted from the AIA publication Local Leaders in Sustainability: Green Building
Incentive Trends (March 2012). Although the incentive categories listed in this table differ slightly
Type Use Where Used
Mandates for Public
Buildings Common
San Diego; Washington DC; Atlanta; Chicago; Minneapolis; Kansas City; Austin; Milwaukee;
Nashville; Durham, NC; Fayetteville, AR; Denver, CO;
Baltimore; Asheville, NC; Cincinnati; Pittsburgh
Incentives for Private
Development Common
Los Angeles; San Diego; Jacksonville, FL; Chattanooga; Nashville; Pittsburgh; Chicago; Louisville; Philadelphia; Portland,
OR; Cincinnati; Louisville
Mandates for all New
Development Rare San Francisco
from the USGBC’s categories, the land use change and government process improvement categories roughly correspond to the USGBC’s structural incentives category.
Table 10. Local green building incentives by type
Type Incentive Where Used
Land Use Changes
Floor Area Ratio (FAR) &
Density Bonuses Miami; Arlington County, VA; Seattle; Nashville Transfer of Development
Rights (TDR) Carroll County, MD
Planned Unit
Developments (PUD) Bothell, WA; Austin, TX; Potential in many municipalities Reduction in Parking
Requirements Hamilton, OH; Bothell, WA
Government Process Improvement
Expedited Review &
Permitting Jacksonville, FL; Chicago; Scottsdale, AZ; Seattle
Priority Inspections Santa Barbara County, CA; San
Bernardino County, CA
Technical Assistance Arlington County, VA
Education & Marketing Publicity and Awards Chicago
Financial
Energy Efficiency Rebates Seattle; Los Angeles; Chapel Hill, NC; Atlanta
Fee Reductions or Waivers Chicago; Indianapolis; San Antonio
Grants Santa Monica, CA; King County, WA;
Detroit; El Paso, TX
Revolving Loan Funds Athens-Clarke County, GA
Tax Abatements Cincinnati
Property or Sales Tax
Rebates Montgomery County, MD
Property Assessed Clean
Energy (PACE) Sonoma County, CA
II. Interviews
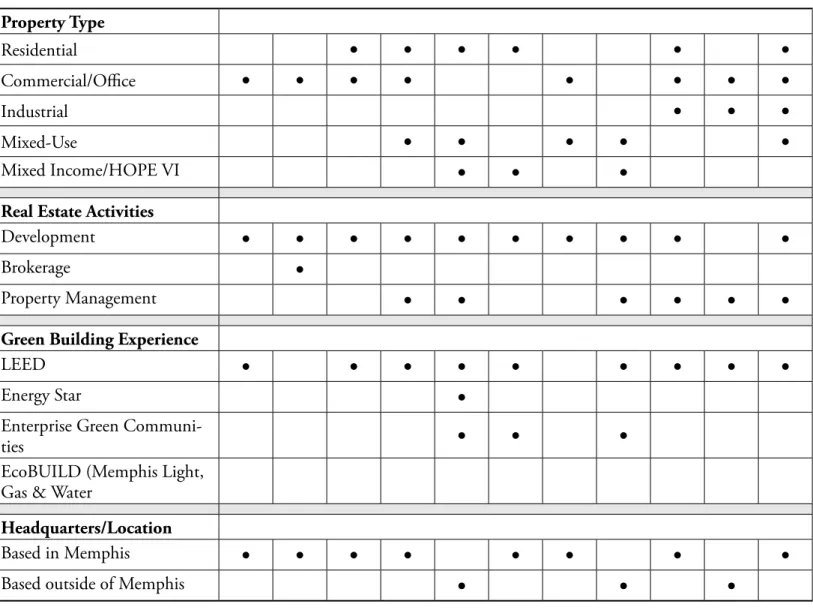
Turning now to the Memphis-Shelby County context, this section describes the results from interviews carried out with private developers and other professionals in the area who work in related fields. Fourteen total interviews were completed over the course of the study. Eleven of these interviews were with private developers who specialize in a variety of building types (residential, commercial, industrial, mixed use) and business models (brokerage, land development, consulting, subsidized housing). Three of the interviews were with professionals who work for organizations that are strongly tied to the development industry (one architect specializing in green building, one planner who works for a central city development agency, and one planner who works for a real estate development education and advocacy non-profit).
The majority of the developers work for firms based in Memphis with the rest representing national and international development and property management companies that have completed significant projects in the Memphis area. Two of the non-Memphis-based developers specialize in large, mixed-income residential, and mixed-use projects and also engage in property management. The final non-Memphis-based firm specializes in commercial development and property management worldwide.
Methods
The Office of Sustainability staff developed an initial list of interviewees for the study whom they felt would provide a cross-section of development industry knowledge, experience, and opinions. As the study progressed, other professionals involved in the architecture, real estate, and planning fields were added to the interviewee list to provide additional perspectives. While different methods were considered for this part of the study, individual telephone interviews seemed to provide the greatest flexibility and opportunity to obtain more detailed and qualitative information.
For the most part, the interviewees were asked a standard set of questions (see Appendix A), although question sets were sometimes modified to take advantage of the interviewees’ unique knowledge and experience. The interviews focused on gathering information on the following topics: 1) the developers’/professionals’ experience with green building, 2) their sense of the Memphis market and the demand for green building, 3) the particular barriers that Memphis faces in implementing Property Type
Residential
•
•
•
•
•
•
Commercial/Office
•
•
•
•
•
•
•
•
Industrial
•
•
•
Mixed-Use
•
•
•
•
•
Mixed Income/HOPE VI
•
•
•
Real Estate Activities
Development
•
•
•
•
•
•
•
•
•
•
Brokerage
•
Property Management
•
•
•
•
•
•
Green Building Experience
LEED
•
•
•
•
•
•
•
•
•
Energy Star
•
Enterprise Green
Communi-ties
•
•
•
EcoBUILD (Memphis Light, Gas & Water
Headquarters/Location
Based in Memphis
•
•
•
•
•
•
•
•
Based outside of Memphis
•
•
•
an incentive-based green building program, and 4) ideas on incentives that would work well in stimulating more green building in the area. The following discussion will look at these four general topics and provide a summary of the opinions and ideas culled from these interviews.
Green Building Experience
Many of the developers have some experience with green building and sustainable development practices, although not all of this experience comes from completing projects that are certified under a formal building assessment system such as LEED. The majority of developers commented on their commitment to do what they could to integrate energy-efficient materials and design into their projects – from HVAC systems to roof insulation to appliances - simply as a matter of smart business practice. For the most part, the developers who work with larger, higher-capacity firms have more experience with completing LEED, Energy Star, or Enterprise Green Communities certified projects.
Looking specifically at opinions on LEED, many seem to feel that LEED certification is simply a “stamp of approval” on building practices they already follow. In addition, the registration, documentation, and certification fees involved with LEED are cost-prohibitive for many of their projects. Many of the developers also view LEED as more of a marketing tool than something that would actually help them build greener. Questioned about whether a potential green building program in Memphis should use LEED or some other assessment system as a benchmark, most agree that LEED is probably the best choice since it is an established, third-party verification system that has recognition on a national scale. In particular, most of the developers do not think that a green building assessment should be created specifically for the Memphis-Shelby County area; many think this option would be administratively infeasible in terms of development, implementation, and monitoring as well as confusing for developers who may be more familiar with established systems such as LEED or Energy Star.
There were, however, some differences of opinion on this issue. Many of the smaller developers are less inclined to support LEED certification as a baseline for an incentive program due to the lack of demand from their client base and the burden of documentation costs. In addition, most of the Memphis-based residential developers are also less inclined to back LEED as the building assessment standard. The architect interviewed for this study voiced support for a more personalized and tailored program so long as it is well-designed and meets certain goals and standards. In his own words, “It would be just as useful for a city to come up with its own program or criteria as long as it is vetted by knowledgeable people in the community and they can demonstrate measurable changes from its implementation. It could even present some interesting and effective marketing opportunities.”
These differences could signal the need for separate incentive standards based on use and size of the building. There may also be opportunities to devise some simple standards based on LEED or other building assessment systems that could help get the same results without the same certification costs. An effective verification process would, however, need to be developed to ensure a minimum baseline of compliance.
Market and Demand for Green Building
encouraging but qualified responses. Although most of the interviewees perceive the market for green building to be on the rise in Memphis, they also see uneven demand in terms of different building sectors and types of clients. Demand is stronger in the office and commercial sectors, particularly for national corporations and non-profits. In addition, tenants in certain fields – like biomedical research and development – are often looking to move in to buildings that incorporate a certain level of sustainable building practices. Demand in the residential sector is perceived as much more tenuous. Although one of the developers who has completed several residential projects in downtown Memphis observed that there is a general trend toward looking for smaller, more efficient living spaces, there has not been a wholesale shift in demand. Several other developers mentioned the low demand for green building products in the rental apartment market.
Although many of the interviewees see an increase in demand for energy-efficient buildings, they did note that the Memphis area seems to be lagging behind many other cities in the U.S. To explore the reasons behind this weaker market, the next section will take a look at the interviewees’ ideas on why green building development has not taken off in Memphis-Shelby County.
Barriers
The most frequently cited barrier to green building is related to the bottom line: how to match upfront costs with operating expenses and expected returns. Since this is the most basic concern for real estate development in general, it’s no surprise that it would also come up in discussions on green building development.
The interviewees mentioned two important characteristics of the Memphis market that magnify these cost/return considerations. First, the Memphis area has relatively low rental rates as compared to many other cities in the country. While these low rates are likely the result of a number of different factors (area income, building stock, oversupply of building options, energy prices), they can make it especially tricky to get the numbers to work for a development that incorporates a higher level of green building features. With the extra upfront costs that green features may incur – especially in terms of LEED or other third-party documentation costs – it is often necessary to raise rental rates to make sure that the project can cover operating costs and provide a return to developers and investors. If demand turns out to be lower than expected and there are plenty of lower-priced products in the market, it will be difficult to lease or sell the space.
Second, the area also has relatively low energy prices and utility rates due to its location in a
Tennessee Valley Authority (TVA) district. These low rates create difficulties on two fronts: tenants/ residents are likely less sensitive to the savings that green products may offer in terms of energy efficiency, and developers have less incentive to incorporate energy-efficiency features since the payback will be over a longer period of time. Although the barrier posed by low utility rates was a frequent refrain, one of the interviewees offered an alternative way of looking at this situation. While energy prices may seem low, they are higher than they were 10 years ago, and prices are only going to go up in the future. In his view, energy prices are eventually going to get to a point where they are a major cost issue for developers, businesses and residents alike – even in Memphis-Shelby County. Although it may be difficult, taking the long-term view on utility prices will be beneficial.
a major concern. For the most part, these concerns centered around persistent conflicts between historic preservation requirements and energy efficiency needs. Although this kind of conflict will probably have to be addressed at a higher national level (National Register for Historic Places requirements and LEED requirements), it is important to keep this kind of barrier in mind when designing a municipal green building program. In addition to historic preservation requirements, one developer mentioned that seismic requirements for buildings in the Memphis area also make green retrofitting more challenging. Although only one developer brought up this issue, it is probably a good idea to explore how the area’s seismic requirements relate to green building features to see what kinds of conflicts or inconsistencies exist. Since reuse of existing resources and buildings is a vital part of sustainability, municipal programs should be cognizant of potential conflicts and include provisions to facilitate redevelopment and rehabilitation whenever possible.
Another important barrier cited during the interviews deals with shortcomings in the planning and regulatory regime in the Memphis area. While most of the developers do not feel that the building code itself is an impediment to green building and sustainable development practices (incorporating greywater reuse systems in buildings was one exception), there is a general sense that code enforcement could be improved to help ensure that the majority of existing building stock meets a certain base level of energy efficiency. In addition, one developer brought up the fact that there seems to be a disconnect between various initiatives and incentives that the city and county use to attempt to shape development. There are programs and incentives for economic development, sustainability measures, and energy efficiency, but they don’t necessarily work together and governmental efforts to implement and connect these programs seem to be lacking.
The final category of barriers relates to overarching issues that the area as a whole faces in terms of market characteristics and land use management. Several interviewees mentioned that the lack of demand for green buildings and sustainable development is largely due to the lack of demand for new development period in the city of Memphis. As one developer put it, the Memphis development market is not nearly as dynamic as many other U.S. cities. One of the interviewees attributed this lack of dynamism to stagnant population growth and other issues that developers do not see themselves as having much control over, primarily crime and education.
Another developer cited the macro issues that the Memphis area faces in creating more sustainable land use patterns. In his view, there is nothing to disincentivize sprawl and unsustainable land use practices. Similar to many other metro areas around the country, the permitting and zoning processes in Memphis do not assign impact costs to developers who stretch out municipal
Incentives
Turning next to suggestions on incentives to encourage green building and sustainable development, the interviewees’ responses fell into two broad categories: 1) general suggestions for how to best structure an incentive program, and 2) recommendations on specific incentives. This section provides a detailed look at the most prominent ideas and opinions on incentives and serves as the basis for the final recommendations in this report.
General Suggestions for a Green Building Incentive Program
Many of the interviewees’ general suggestions for green building incentives relate to program structure. For the most part, these suggestions refer to basic guidelines that any public policy or government program based on incentives should follow:
• Make the program as simple and stable as possible. Uncertainty and unpredictability should be avoided. This is especially important for real estate developers due to the long-term nature of their business deals.
• Make sure that the incentives are useful and actually fill a clear financing gap. • Make sure that the targeted group knows how to use the incentives. Many
incentives go unused due to a lack of communication and clear information on how to access and use them.
• Design the incentives so that they are based on clear benchmarks, and the incentives equal the cost incurred.
Several interviewees also provided suggestions on how to implement a program in the Memphis context:
• Provide different incentives for residential and commercial/office development as well as for development projects of different sizes.
• Think about using MLGW as a clearinghouse for an incentive program.
• Pilot any possible incentives by working through actual projects with a developer. This testing will help ensure that the incentives can be operationalized so that they have a real impact for real estate projects.
• Any incentive program must be backed by a strong marketing campaign to ensure success.
Recommendations for Specific Incentives
Due to the relatively large pool of interviewees and their diverse backgrounds and expertise, the recommendations for specific green building incentives included a wide range of ideas.
City and County as First Adopters
LEED Documentation and Certification Fees
Many of the interviewees discussed the attractiveness of incentives that help reduce the costs associ-ated with LEED documentation and certification. Although most of the developers expressed some level of frustration with the structure and requirements of LEED, there was also recognition of the value of LEED certification. A good bit of this frustration seems to stem not from the construction costs but from the extra cost that the LEED certification and documentation necessitates. The most frequently cited vehicle for delivering this incentive was a direct monetary grant directed toward reducing LEED fees.
Utility and Energy Incentives
Another frequently discussed green building incentive relates to energy costs and utility payments. Although MLGW offers a few incentive and assistance programs aimed at encouraging building efficiency, the interviewees see an opening to expand these programs and make them more far-reaching and accessible. Possible changes include: expanding MLGW’s EcoBUILD program to include standards for other building types and for existing buildings (currently only covers new residential), increasing rates for energy generation payments for renewable energy such as solar, and expanding the current MLGW/USGBC Memphis chapter incentive for commercial buildings that achieve LEED certification.
Tax Incentives
Another topic that received quite a bit of attention was tax incentives. Many of the developers view taxes as a natural starting point for government incentives since they are one of the “levers” that government can use to influence behavior. The most frequently mentioned tax incentive was a reduction in property taxes. It was unclear whether the developers interviewed were aware of the PILOT incentive program available in the CBID and central city area that offers an extension on reduced property taxes for projects that attain LEED certification. This lack of familiarity may be due to the relative newness of the incentive, its introduction at the beginning of the recession and the downturn in development and new construction, or the fact that some of these developers’ projects would not qualify for the PILOT in the first place.
The interviewees’ also offered several interesting new ideas related to tax incentives for green building. One developer who works in affordable housing mentioned that the PILOT that is currently available for certain affordable housing projects could be extended for projects that incorporate a certain level of green features. Though not an incentive, one developer mentioned using the PILOT program used to attract large, multi-national corporations to the area as a way to advance sustainability and green building goals; the city-county could require these corporations to build their new facilities or offices to a certain LEED certification level in exchange for some of the valuable property tax abatements they receive.
Structural and Regulatory Incentives
When asked about the value of incentives focused on expedited project review and permitting, the response was more mixed. On the whole, the interviewees – and particularly the developers – did not see the permitting and entitlement process as a major barrier in the development process, with most mentioning that the process in the Memphis-Shelby County area is less time-consuming than in other areas of the country. However, several of the developers thought an expedited review incentive for incorporating green building features could be somewhat valuable as the construction and real estate development industries hopefully pick up steam in the next few years.
A couple of the developers mentioned that the relaxation of some stormwater fees and regulations may be a valuable incentive to provide greener building projects. Specifically, one developer suggested that the current stormwater impact fees based on impervious surface coverage could be reduced for projects that incorporate sustainable stormwater management features. Another developer suggested that some of the more onerous stormwater requirements that have been instituted in the area as part of the Clean Water Act may actually work against more sustainable building and development practices. For example, requirements for detention or retention basins in certain areas limit the developable land in parcels that could help result in more walkable, dense development patterns. Interestingly, the two developers that mentioned these stormwater-related incentives work for larger firms. Stormwater fees and regulations may be a larger cost for them due to their focus on larger master planned projects and office and industrial parks.
Finally, several interviewees mentioned the need to mix green building and sustainable development incentives with regulatory disincentives for the kinds of development not desired. The only specific disincentive brought up during the interviews focused on charging impact fees that more accurately reflect the costs of greenfield development.
Summary
Despite the diversity of experience represented by these developers, there seemed to be a fairly high degree of consensus on many of the big issues related to green building in Memphis. They see challenges in terms of weak demand for green building in the area; they see the major barriers to green building as cost considerations (especially for third party verification), lack of demand, and low utility rates; and they generally support any incentive that helps make a project more feasible.
Although there seems to be consensus on these overarching issues, there were a number of key differences in some of the responses. Several of the smaller developers were somewhat skeptical about how green building incentives would benefit their projects and work with their business model. In addition, the smaller developers also seemed to focus more on the process of developing and implementing the incentives and making sure that they were the right kind of incentives, i.e. that they would be reliable and available on the front end of a project. Developers from higher-capacity firms that have already been working to incorporate LEED and other third-party certified projects into their portfolio seemed to be less concerned with the mechanics and details but
Developers who do market-rate residential work were also unsure of the best use of green building incentives for these projects. Again, LEED and other third-party verification systems were seen as problematic and cost-prohibitive for this kind of development in the Memphis context.
III. Case Studies
To provide information on best practices for green building incentives, this section will take an in-depth look at how other cities in the U.S. have designed and implemented incentive-based green building programs. The case study cities were chosen with input from staff at the Memphis-Shelby County Office of Sustainability. The majority of the cities (Nashville, Austin, Cincinnati, Louisville, Indianapolis, and Raleigh) were selected due to their status as comparable peer cities to Memphis that have implemented some kind of green building or infrastructure incentive program. Seattle was selected to provide an example of a more established and leading-edge municipal green building program. Information for the case studies was compiled from public documents and questionnaires from planning and sustainability staff in the respective cities (see Appendix A). The questionnaire focused on gathering information on the following topics: details on the main incentive program(s) for green building, the factors that went into designing these program(s) including the role of the private development community, the performance of the incentive program(s), and any advice or lessons learned they could share with other cities looking to implement green building incentives.
Nashville
Nashville has recently become a leader in sustainability and green building not only in the south, but also in the nation as a whole. Over the last 4 years, the city has developed a number of sustainability initiatives, programs, and ordinances. The following section will provide an overview of the major initiatives related to encouraging green building practices.
Public Building Mandate and Demonstration
In 2007, the Metro Council passed an ordinance requiring that all public and publicly-funded new buildings and renovations over 5,000 s.f. or over $2 million meet a minimum of LEED Silver certification. In addition, Nashville has made progress on its goal to retrofit ten existing public buildings to LEED Silver standards with three renovations completed.
Green Building Permit Ordinance
In 2008, the Nashville Metro Council passed the Green Building Permit and Green Certificate of Occupancy Ordinance. This law allows the provision of green permits and certificates of occupancy (COA) to projects that meet certain green building criteria. The green permit and green certificate of occupancy are granted to residential projects that are certified under one of two green building programs - LEED or EarthCraft
Figure 3. The Gulch neighborhood, Nashville - LEED ND
House – and to commercial projects that are LEED certified and in compliance with the USGBC’s water conservation qualifier (building reduces water consumption by 20%). While this program is voluntary and largely focused on providing recognition and publicity for green buildings, it does allow for expedited review and for buildings that qualify under the program requirements.
Downtown Density Bonuses
Nashville’s new Downtown Code provides several incentives for projects that incorporate green features. The Bonus Height Program (BHP) allows LEED Silver, Gold, and Platinum buildings and LEED-ND certified new building projects to exceed maximum height provisions. The allowable amount of extra height/stories depends on the location of the project (by district) and the level of certification in some districts. For example, in the Core district LEED Silver buildings are allowed 4 extra stories, LEED Gold buildings are allowed 8 extra stories, and LEED Platinum buildings are allowed 12 extra stories. LEED-ND certified projects are typically allowed 1-2 extra stories in most of the downtown districts; this applies to all buildings within the development if there are multiple buildings. In addition, the downtown BHP allows projects that incorporate pervious surfaces that aid in reducing and improving the quality of stormwater runoff to add extra height. Pervious surfaces eligible for this height bonus include: green roofs, pervious pavement, bio-swales, landscaping, and green screens. For this category, the amount of bonus height is twice that of the square feet of pervious surface up to the maximum bonus height allowed for the district. The BHP also has a provision that prevents green roofs from being double-counted under the green building and pervious surface categories unless LEED certification would have been met without the green roof credits. The program also allows a degree of flexibility by stating that LEED certification can be substituted with any other nationally recognized third party green building/sustainable development verification program.
Design, Implementation, and Advice
Information provided by staff from Nashville’s Planning Department shows that a number of different factors went into designing the city’s major green building incentive, the downtown density bonus program. In terms of certification systems (LEED, Green Globes, etc.), they felt that flexibility was important. Instead of limiting developers to using LEED, other third-party, nationally-recognized systems are also eligible to qualify for the incentive. Planners also considered creating a custom green building check-list for the program, but ultimately decided that using an established third-party system would be more straightforward.
In terms of geographic focus, planners decided that this kind of density bonus program should be targeted to certain areas. Although the city is committed to encouraging and supporting green building in all neighborhoods, planners had to balance the incentive of increased density and building height with the desire to foster distinctive communities. By limiting the incentive to areas where increased density is more appropriate, the city is better able to strike this balance as well as avoid conflict with existing residents.
be interested in programs like this unless a refund or rebate is offered.
Due to the timing of the completion of the Downtown Code and the implementation of the density bonus program during the recession, there are no examples yet of projects that have taken advantage of the incentive. However, the planning department has a system in place to collect data on all development coming in under the new Downtown Code and would therefore be able to track the performance of the incentive program once it is used.
Other pieces of advice in terms of design and implementation for incentive programs include:
• Consider the existing development entitlements and community character to help calibrate the incentives.
• Investigate the LEED incentive programs in other cities to get ideas and learn from their experience.
• Consult local USGBC members to help with implementing a program based on LEED standards.
Austin
Austin has the distinction as the first city in the country to adopt a formal green building program. As a result, Austin’s voluntary program is fairly wide reaching and offers considerable resources for developers, builders, and homeowners.
General Structure
Austin’s green building program is run by the city’s utility company, Austin Energy, and uses a set of customized green building rating systems that range from 1-5 stars. Each major type of use – commercial, single-family, and multi-family – has its own specialized rating system and program resources available from
Austin Energy. Similar to the structure of LEED, the Austin Energy Green Building (AEGB) rating systems award points based on building performance in different categories, including: site design and location, integrated project design, energy use, water use, indoor environmental air quality, materials & resources, education, and innovation. The most recent version of the rating system (developed in 2010) also takes a more performance-based approach by setting
Figure 4. Pedernales Lofts, Austin - 5 star rated green multifamily project
standards but not prescribing the exact methods to meet those standards.
Also similar to LEED, there are registration and service fees for any project that participates in the rating program; these fees vary by use and by size of the project. As of 2011, the AEGB program had rated approximately 10,000 buildings resulting in savings of 53.6 million kilowatt hours of electricity, 65.8 million gallons of water, and 120,698 tons of construction waste diverted from landfills (Austin Energy 2012). Essentially, the AEGB program offers a customized rating system for the Austin area and offers a wealth of technical resources to encourage the adoption of green building practices.
Incentives
The Austin green building program offers a number of incentives to encourage energy efficiency. For the most part, these incentives are in the form of free consulting services and rebates for
implementing energy efficient building components based on building type. For residential buildings, rebates up to $1575 are offered for products including air conditioners, attic insulation, solar screens, caulking, and weatherstripping; there are also rebates available for solar panels, solar water heaters, and other high efficiency HVAC equipment. In addition, Austin Energy also offers low-interest loans to help cover the cost of many of the building features listed above.
For commercial buildings, rebates up to $100,000 are offered for products and features such as air conditioners, chillers, lighting systems, solar panels, reflective roofs, and window treatments. Special rebates and incentives are also available for small businesses, free programmable thermostats, thermal energy storage, and weatherization practices for multi-family buildings.
Public Building Mandate
Austin was also one of the first cities to adopt a mandate requiring that all municipal buildings over 5,000 s.f. meet LEED Silver standards.
Figure 5. LCRA Redbud Center, Austin 4 star rated green commercial project
Design, Implementation, and Advice
Staff members at the Austin Energy Green Building program were unable to fill out the questionnaire for this study.
Cincinnati
Cincinnati is another city that has made great strides in addressing sustainability over the last few years. The city’s Office of Environmental Quality handles a number of different programs that focus on issues such as brownfield redevelopment, air quality, climate protection, recycling, and environmental justice. In 2007, the city undertook a comprehensive effort to address climate change in the region as part of the mayor’s Green Cincinnati Initiative. The Green Cincinnati Plan – completed and adopted in 2008 – lays out a detailed road map on steps the city and the region can take to reduce greenhouse gas emissions. As part of Cincinnati’s wider efforts to address sustainability and climate change, the city offers several incentives to encourage green building.
LEED-CRA Tax Abatement
The most prominent green building incentive offered in the Cincinnati area is property tax abatement. Projects that meet certain criteria are granted a real property tax exemption on the improved value. This particular incentive is channeled through a statewide community and economic development initiative – the Ohio Community Reinvestment Area (CRA) Program – that essentially allows municipal and county governments to grant property tax abatements in targeted areas. With the entire city of Cincinnati designated as a CRA, this incentive has the potential to be used by a number of different projects.
This incentive is available both to new construction projects and renovations. Other eligibility requirements include:
• Property must be located within city boundaries.
• Project must be LEED certified at any level (Certified, Gold, Silver, Platinum). • Project must be commercial, industrial, office space or multi-unit housing (4+ units). • City Council approval of the tax abatement must occur before construction begins.
The level of tax abatement varies depending on the use and whether the project is new construction or renovation. Multi-unit residential projects (new construction or renovation) are eligible for a 10-year abatement up to a maximum exemption of $96,250 of assessed value. New construction projects are eligible for a 15-year tax abatement up to 75% of the new value of the project. Renovations are eligible for a 12-year tax abatement up to 75% of the new value. For both types, the required minimum investment is $40,000. The calculation of the tax abatement is based on the increased valuation of the property after the investment. The Cincinnati Community Development department provides the following table to show how the property tax abatement would be
Other important stipulations for the Cincinnati LEED-CRA tax abatement program include:
• Property owners must complete a PILOT agreement with the Hamilton County Board of Education to pay 25% of the full amount of exempt property taxes. • The city has the authority to revoke the property tax exemption at any time after the
first year for issues like building code violations and tax payment delinquency. • Commercial applicants are also required to commit to certain goals of employment
creation and retention for their project. Although there doesn’t seem to be a requirement that commercial property owners actually meet these goals, it is a way to gauge the potential employment impact of a project.
• Fees include a $750 application fee and an annual fee of 1% of the value of the abatement with a lower limit of $250 and an upper limit of $2,500.
Residential Tax Abatement for Green Building
As a complement to the commercial and multi-unit residential tax abatement for LEED certified projects, Cincinnati also offers tax abatements for green single family and small residential buildings (less than 4 units), including condominiums. Although the residential property tax abatements are available for projects that don’t attain LEED certification (i.e. for building improvements of all types), there are more extensive tax exemptions available for new construction and renovations of residential buildings that are LEED certified. New residential buildings that are LEED certified are eligible for a 100% property tax abatement on the improved value up to 15 years and up to $562,792. Renovated residential buildings that are LEED certified are subject to slightly different terms: a 10-year abatement on improvements up to a maximum of $562,792 is available, although owners still have to pay tax on the land and
Figure 6. LEED Silver historic buildings, Cincinnati
Source: www.building-cincinnati.com
Market value of new investment $1,000,000
Assessed value of new investment (35%) $350,000
Commercial property tax rate 0.077444543
Property tax on new investment $27,105
Annual abatement (75%) $20,330
Total abatement (12-year term) $243,960
Table 12. Cincinnati CRA abatement example