COST-BENEFIT ANALYSIS OF OPTIONS FOR IMPROVING DRINKING WATER QUALITY IN AN EXTRATERRITORIAL JURISDICTION CENSUS BLOCK OF RALEIGH,
NORTH CAROLINA
Heather Boyette Dew
A technical report submitted to the faculty at the University of North Carolina at Chapel Hill in partial fulfillment of the requirements for the degree of Master of Science in Environmental
Engineering in the Department of Environmental Sciences and Engineering in the Gillings School of Global Public Health
Chapel Hill 2015
iii
ABSTRACT
Heather Boyette Dew: Cost-Benefit Analysis of Options for Improving Drinking Water Quality in an Extraterritorial Jurisdiction Census Block of Raleigh, North Carolina
(Under the direction of Jackie MacDonald Gibson)
Communities bordering but outside of city limits often lack municipal water services and rely on private wells. These communities may consider three options if their water is of
iv
ACKNOWLEDGEMENTS
First and foremost, I would to express my gratitude to my advisor and committee member, Jacqueline MacDonald Gibson. I am so appreciative of her guidance, patience, and time committed to reviewing and editing this report. Her positivity, honesty, and personal
experiences are an inspiration to me. I would also like to thank Pete Kolsky and Greg Characklis for serving as members on my committee and as my professors during my time at UNC. Both experts in their field, I greatly enjoyed learning from them in the classroom and am truly appreciative of their guidance on this report.
I also owe a debt of gratitude to the City of Raleigh Public Utilities Department, particularly Eileen Navarrete, PE, for her patience in answering my many questions in person and by email. I am also extremely appreciative to Hazen and Sawyer, specifically Todd Davis, Senior Principal Engineer, for his kind assistance in testing the capacity of the existing water infrastructure. Thank you to Carl Stearns and Layman Ricker for providing me with files of the existing City of Raleigh water mains. I would especially like to thank Brenda Benavides for being a sounding board and for offering her time to assist me with editing this report along the way. Thank you to Yang Du, Hannah Leker, Yuyun Liang, Julian Oliver, Frank Stillo and all of Jackie’s students for their support and always smiling faces.
v
vi
TABLE OF CONTENTS
LIST OF TABLES ... ix
LIST OF FIGURES ... x
LIST OF ABBREVIATIONS ... xii
CHAPTER 1: INTRODUCTION ... 1
CHAPTER 2: PROBLEM IDENTIFICATION ... 3
Introduction ... 3
Extraterritorial Jurisdictions ... 3
Health Risks of Self-Supplied Systems ... 4
Well Water Treatment Recommendations ... 5
Extraterritorial Jurisdiction Community of Focus ... 6
Objective ... 8
CHAPTER 3: TECHNICAL OPTIONS ANALYSIS ... 9
Introduction ... 9
Methods for Analysis of Technical Options ... 10
Extension of Existing Water Service Line ... 10
Testing and Treatment of Water at the Well ... 15
No Action ... 20
vii
Comparison of NPV of Each Technical Option ... 23
Comparison of Convenience, Implementation Requirements, and Health Considerations for Technical Options ... 25
Limitations of Technical Option Comparison... 28
CHAPTER 4: RECOMMENDED SOLUTION ... 30
Introduction ... 30
Extension of the Existing Water Line ... 31
CHAPTER 5: IMPLEMENTATION PLAN ... 32
Introduction ... 32
Stakeholder Preferences ... 32
Annexation Requirements and Approval ... 33
Water Main Design and Construction ... 33
Scheduling ... 34
Public Disturbance ... 35
Technical Problems ... 35
Long-term Maintenance ... 35
CHAPTER 6: CONCLUSION ... 37
APPENDICES ... 38
APPENDIX A: EVA MAE DRIVE COMMUNITY LOCATION ... 38
APPENDIX B: WATER MAIN EXTENSION: INPUT CALCULATIONS FOR EXISTING CITY OF RALEIGH MASTER WATER MODEL ... 40
APPENDIX C: WATER MAIN EXTENSION: ARCGIS DATA AND METHOD ... 43
viii
APPENDIX E: WATER MAIN EXTENSION: ESTIMATION OF COSTS
TO THE UTILITY ... 50 APPENIX F: WATER MAIN EXTENSION: CONSTRUCTION BID
REFERENCES FROM WAKE COUNTY ... 54 APPENDIX G: WATER MAIN EXTENSION: ESTIMATION OF COSTS
AND BENEFITS TO THE EVA MAE DRIVE COMMUNITY ... 58 APPENDIX H: WATER MAIN EXTENSION: SENSITIVITY ANALYSIS
OF NPV WITH VARYING DISCOUNT RATES AND COMPONENT NPV
AT 4% DISCOUNT RATE ... 62 APPENDIX I: WELL WATER TESTING AND TREATMENT: COST
CALCULATIONS FOR TESTING AND TREATMENT AT THE WELL ... 64 APPENDIX J: WELL WATER TESTING AND TREATMENT:
SENSITIVITY ANALYSIS OF NPV WITH VARYING DISCOUNT RATES
AND COMPONENT NPV AT 4% DISCOUNT RATE ... 71 APPENDIX K: NO ACTION: COST CALCULATION OF POTENTIALLY
AVOIDED AGI-RELATED CASES ... 73 APPENDIX L: NO ACTION: SENSITIVITY ANALYSIS OF NPV OF NO
ix
LIST OF TABLES
Table 1. Eva Mae Dr. community census block property parcels: value, build year, and land area. ... 7
Table 2. Data sources and descriptions for use in evaluating the capacity of the existing municipal water system. ... 12
Table 3. Pipe and hydrant inventory of water extension design. ... 13
Table 4. Estimated NPV of water main extension to each household, to the Eva Mae Dr. community as a whole, and to the water utility for a duration of 30 years. ... 15
Table 5. Cost of private well services in Wake County. ... 16
Table 6. Estimated NPV of well water testing and treatment to each household in the community on average and to the Eva Mae Dr. community as a whole for a duration of 30 years. 20 Table 7. Estimated NPV to each household in the Eva Mae Dr. community and the community as whole with no action for a duration of 30 years. ... 23
Table 8. NPV at a 4% discount rate for each technical option from three perspectives: each household, the Public Utilities Department, and social. ... 24
Table 9. Calculated MDD (gallons per day) at each connection node. ... 41
Table 10. Hypothetical bid for Eva Mae Dr. community water main extension. ... 51
Table 11. Permitting costs of water main extension. ... 53
Table 12. Costs to community members as a result of municipal water supply extension. ... 58
Table 13. Raleigh Public Utilities Rates. ... 60
Table 14. Components of NPV Calculation of Water Main Extension at 4% Discount Rate. ... 63
Table 15. Cost and frequency of well water quality testing used in calculation. ... 64
Table 16. Years of bacteriological test failure for each well calculated using the RANDBETWEEN Excel function. ... 66
Table 17. Years of chemical test failure for each well calculated using the RANDBETWEEN Excel function. ... 67
Table 18. Components of NPV Calculation of Well Water Testing and Treatment at 4% Discount Rate. ... 72
x
LIST OF FIGURES
Figure 1. ETJ community of interest located east of I-440 and south of US-264 in
eastern Wake County. ... 8
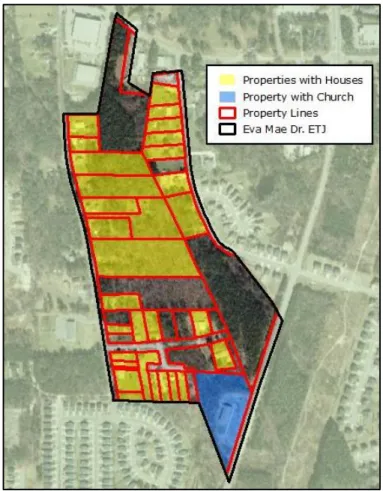
Figure 2. Property parcels containing homes or religious structures within the Eva Mae Dr. community. ... 9
Figure 3. Connection locations to existing water line. ... 11
Figure 4. Possible events associated with well water testing and results. ... 19
Figure 5. NPV to the utility and to the consumer for each technical option. ... 23
Figure 6. NPV social at a 4% discount rate for each technical option. ... 24
Figure 7. Location of Eva Mae Dr. community in Wake County, North Carolina. ... 38
Figure 8. View north from southern border of community on Bethel Rd.. ... 38
Figure 9. View south from southern border of community on Bethel Rd.. ... 39
Figure 10. Household demand assigned to each new connection junction. ... 41
Figure 11. Supplied pressures at modeled connection nodes. ... 42
Figure 12. Eva Mae Dr. community shapefile, existing water infrastructure, and streets and highways within a 0.75-mile radius of the study community. ... 44
Figure 13. Eva Mae Dr. community property parcels and four surrounding Wake County topographic gird sections within the 0.75 mile radius of the community boundary. ... 45
Figure 14. WaterGEMS image with connection sites, hydrants, valves, and tapping sleeves. ... 47
Figure 15. Elevation of designed pipes along Bethel Rd. from south to north. ... 48
Figure 16. Elevation of designed pipes along Martha St. from east to west. ... 48
Figure 17. Elevation of designed pipes along Poplar Dr. from west to east. ... 48
Figure 18. Elevation of pipes along the connecting street between Martha St. and Poplar Dr. from south to north. ... 49
Figure 19. Elevation of designed pipes along Eva Mae Dr. from north to south. ... 49
Figure 20. Soil composition of construction area. ... 52
xi
Figure 22. Portion of Withers & Ravenel Water Main Project Bid, 2011. ... 55 Figure 23. Portion of Highfill Infrastructure Engineering, P.C., Water Line
Replacement Project Bid, 2012. ... 56 Figure 24. Portion of Withers & Ravenel Water Main Replacement Project, 2011. ... 57 Figure 25. Aquasana © 1,000,000 Gallon Rhino Whole House Filter System with
xii
LIST OF ABBREVIATIONS
ADD Average Daily Demand
BCBSNC BlueCross BlueShield of North Carolina
CDBG Community Development Block Grant
CDC Centers for Disease Control and Prevention
CWS Community Water Service
CY Cubic Yard
EA Each
EPA Environmental Protection Agency
ETJ Extraterritorial Jurisdiction
GPCD Gallons per capita day
LF Linear Feet
LS Lump Sum
MCL Maximum Contaminant Level
MDD Maximum Daily Demand
MGD Million Gallons per Day
NC North Carolina
NC DENR North Carolina Department of Environment and Natural Resources
xiii NCGA North Carolina General Assembly
NPV Net Present Value
O&M Operations and Maintenance
SY Square Yard
UNC-CH University of North Carolina at Chapel Hill
USDA United State Department of Agriculture
USGS United States Geological Survey
WBDO Waterborne Disease Outbreak
1
CHAPTER 1: INTRODUCTION
Communities that are located just outside of city limits are often not provided with municipal water services and rely on other self-supplied drinking water sources such as wells. These communities, located within a city’s extraterritorial jurisdiction, may consider three options in the case that their well water is of substandard quality: municipal water main
extension to the area, water treatment at the well, or no action. This Technical Report seeks to: (1) identify the problem; (2) determine a set of possible solutions and select a recommended solution from the solutions offered; (3) construct an implementation plan for the recommended solution. The Technical Report was submitted in the form of three briefs over one year as partial fulfillment of the requirements for the degree of Master of Science in Environmental
Engineering in the Department of Environmental Sciences and Engineering in the Gillings School of Global Public Health. The first brief, “Problem Identification Brief”, defined the extraterritorial jurisdiction of Raleigh, North Carolina without municipal water access, explored health risks associated with self-supplied well water systems in these areas, and identified one community in the extraterritorial jurisdiction of Raleigh on which to focus analysis and comparison of possible solutions. The second brief, “Solution Identification Brief”, identifies three possible solutions to the problem identified in Brief #1: (1) extending the existing municipal water system to all thirty homes in the extraterritorial jurisdiction community; (2) periodically testing well water for contaminants and providing treatment as needed; (3)
2
feasibility, and some consideration of benefits. After comparison of the three alternatives, the solution involving an extension of municipal water services was recommended as the optimal solution from the community perspective. Lastly, the third brief, “Implementation Brief”, provides a potential plan for the implementation of the recommended solution in the extraterritorial jurisdiction community evaluated in this report. These three briefs were combined to create this comprehensive Technical Report including identification and
investigation of the possibility of substandard water quality in the extraterritorial jurisdiction of Raleigh, the analysis required to address this problem in one extraterritorial jurisdiction census block of Raleigh, NC, and to offer a solution and present the subsequent implementation of the solution.
3
CHAPTER 2: PROBLEM IDENTIFICATION
Introduction
Approximately 78% of North Carolina residents are provided water services by a community water system, 8% less than the national average (DeFelice, in revision; Maupin, et al., 2014). A community water supplier is defined as supplying water to at least 25 people or having a minimum of 15 connections year-round (Kenny, et al., 2009; Maupin, et al., 2014). The water provided to city residents by a community supplier is regulated by the Environmental Protection Agency (EPA) water quality standards, but self-supplied water systems are not (Craun, et al., 2010). Over 3 million North Carolinians rely on unregulated self-supplied groundwater as their water source (Well Water and Health: Facts & Figures, 2014). In Wake County alone, about 11,300 residents of the county’s extraterritorial jurisdiction are not provided with community water service (MacDonald Gibson, DeFelice, Sebastian, & Leker, 2014). When lacking access to community water service, many residents rely on private well water which is only required be tested for water quality at the time of construction (Vanderslice, 2011).
Extraterritorial Jurisdictions
Residents who live within municipal boundaries obtain their water from a community supply and are provided with services such as trash pickup, voting rights for town officials that control land use, and in most cases, sewer (Bridging the Gap, 2008). However, not all county residents have access to a municipality’s water supply. Some residents may reside in an
4
not have an elected representative in the town government (Parnell, Joyner, Christmas, & Marsh, 2004). The municipality has no obligation to offer the ETJ the same services provided for residents within city limits. Some ETJ communities excluded from services are surrounded by areas that have services provided by the municipality1 (Bridging the Gap, 2008). The majority of ETJ communities that are not supplied with municipal water services depend on self-supplied water systems such as wells or surface water (Domestic water use, 2014). In a North Carolina case study, financing was determined to be the predominant factor influencing decisions to extend municipal water services to unincorporated communities with improved health determined to be of minor concern (Naman & Gibson, 2014).
Health Risks of Self-Supplied Systems
Use of self-supplied water systems has been associated with increased health risks (Craun, et al., 2010). Waterborne disease outbreaks (WBDO) associated with self-supplied water systems have increased annually since 1971, whereas the amount of WBDOs reported annually is decreasing for community drinking water systems. According to a United States Geological Survey (USGS) study of WBDOs from 1971 to 2006, acute gastrointestinal illness is the most common illness associated with contaminated self-supplied water systems (Craun, et al., 2010). The study also concluded that the majority of deficiencies that result in WBDOs from self-supplied systems are due to the use of contaminated untreated groundwater (83.3%) or insufficient treatment of contaminated groundwater (10.7%) (Craun, et al., 2010).
Another USGS study of private domestic wells from 1991 to 2004 concluded that 23% of the wells sampled had at least one chemical contaminant at levels higher than their maximum contaminant level (MCL) or a health-based guideline. Additionally, 34% of the wells sampled
1 When an extraterritorial jurisdiction (ETJ) is completely surrounded by areas that are provided with municipal
5
were positive for total coliforms and 8% were positive for E. coli (Vanderslice, 2011). The results of a 2015 study at the University of North Carolina at Chapel Hill (UNC-CH) demonstrated that water samples from 37 of 57 households (65%) from majority African
American homes in Wake County’s extraterritorial jurisdiction that rely on individually-supplied well water tested positive for either total coliforms, Escherichia coli (E. coli), or Enterococci (Stillo, 2015). Water taste, odor, pressure, and convenience are other factors to consider in regards to the quality of individually-supplied well water.
Well Water Treatment Recommendations
6
North Carolinians that rely on well water as their primary water source (Well Water and Health: Facts & Figures, 2014).
Extraterritorial Jurisdiction Community of Focus
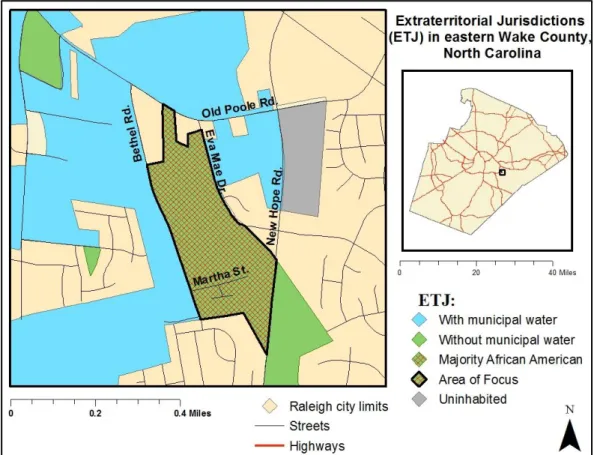
This report will focus on one census block without water services located within the ETJ of eastern Wake County, North Carolina. One home in this census block was a participant in Stillo’s study of Wake County ETJ communities. This home tested positive for total coliform in all three samples taken from the tap within the home (2015). The community of interest will be referred to as the “Eva Mae Dr. community” for the purposes of this report2. The Eva Mae Dr. community census block includes 30 homes and one church, Agape Word Fellowship, with a total residential population of 66 people (GIS: Download Data, 2014; Wake Census, 2010)3.
Fifty-six percent of the community’s residential population is classified as African American (Wake Census, 2010). A total of 47 property parcels are encompassed by the census block boundary, with a majority (64%) of the parcels containing residential homes built between 1905 and 2008 (GIS: Download Data, 2014) (Table 1).
2 The Eva Mae Dr. community corresponds to the 2010 US Census Block 2007, Block Group 2, Tract 528.06 (Wake
Census, 2010).
3 The Agape Word Fellowship Church is within the census block of interest, but is connected to Raleigh municipal
7
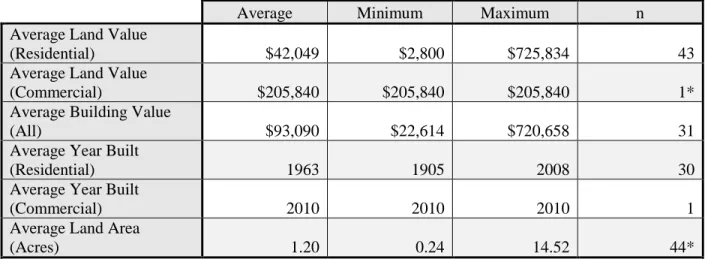
Table 1. Eva Mae Dr. community census block property parcels: value, build year, and land area (Wake Census, 2010).
Average Minimum Maximum n
Average Land Value
(Residential) $42,049 $2,800 $725,834 43
Average Land Value
(Commercial) $205,840 $205,840 $205,840 1*
Average Building Value
(All) $93,090 $22,614 $720,658 31
Average Year Built
(Residential) 1963 1905 2008 30
Average Year Built
(Commercial) 2010 2010 2010 1
Average Land Area
(Acres) 1.20 0.24 14.52 44*
*Three property parcels were excluded from this calculation as the census block boundary only contains a small portion of the parcel.
8
Figure 1. ETJ community of interest located east of I-440 and south of US-264 in eastern Wake County.
Objective
9
CHAPTER 3: TECHNICAL OPTIONS ANALYSIS
Introduction
Each of the three alternatives was evaluated in regards to costs, ease of implementation, and potential health benefits. Alternatives to be evaluated for the 30 homes in the community (Figure 2) are: (1) water line extension; (2) well water testing and as-needed treatment; (3) no action. The net present value (NPV) of each alternative was considered for a 30-year duration, assuming a discount rate of 4% for costs and benefits. The sensitivity of results to the chosen discount rate was considered.
10 Methods for Analysis of Technical Options Extension of Existing Water Service Line
The steps taken to analyze costs of extending the existing water municipal service included: (1) proposed design of the water main extension; (2) evaluated the capacity of the existing system to support an extension; (3) quantified the capital cost of the extension to the City of Raleigh Public Utilities Department, and (4) considered the long-term costs of the
extension to the community members. All cost estimations were calculated from the perspective that the extraterritorial jurisdiction community would undergo the extension after annexation into Raleigh municipal boundaries.
Evaluation of the Existing Water Network Capacity
Before designing the extension to determine capital costs, it was essential to ensure that the existing municipal water system could support the water demands of an extension to the homes currently located in the Eva Mae Dr. community. To confirm that the existing water network has the needed capacity, the maximum daily demand (MDD) of the residential
community was modeled within the current City of Raleigh Master Water Model at four different connection locations (Figure 3). The MDD of the community was calculated based on the
11
The MDD at each node was entered into the City of Raleigh Master Water Model by
Todd Davis, Senior Principal Engineer at Hazen and Sawyer. When running the model with MDD as well as fire flow demand (3,500 gallons per minute) at the four connection nodes, an extension to the Eva Mae Dr. community would be supported by the existing City of Raleigh water network (Davis, E-mail, 2015).
Figure 3. Connection locations to existing water line. WaterGEMS Model
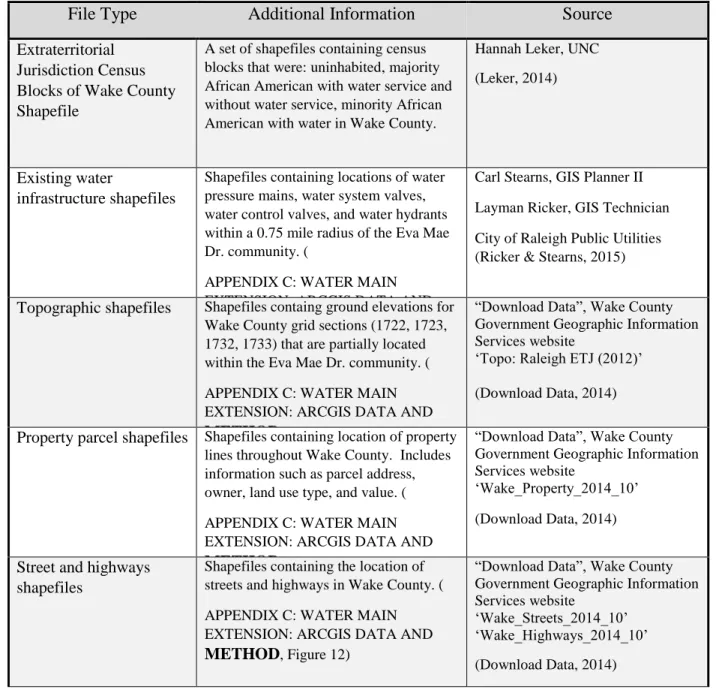
The proposed water extension design was created using Bentley® WaterGEMS® V8i (SELECTseries 1). Data for this evaluation were gathered from multiple sources (Table 2).
Connection 1
Connection 3 Connection 2
12
Table 2. Data sources and descriptions for use in evaluating the capacity of the existing municipal water system.
File Type Additional Information Source
Extraterritorial Jurisdiction Census Blocks of Wake County Shapefile
A set of shapefiles containing census blocks that were: uninhabited, majority African American with water service and without water service, minority African American with water in Wake County.
Hannah Leker, UNC
(Leker, 2014)
Existing water
infrastructure shapefiles
Shapefiles containing locations of water pressure mains, water system valves, water control valves, and water hydrants within a 0.75 mile radius of the Eva Mae Dr. community. (
APPENDIX C: WATER MAIN EXTENSION: ARCGIS DATA AND
METHOD, Figure 12)
Carl Stearns, GIS Planner II
Layman Ricker, GIS Technician
City of Raleigh Public Utilities (Ricker & Stearns, 2015)
Topographic shapefiles Shapefiles containg ground elevations for Wake County grid sections (1722, 1723, 1732, 1733) that are partially located within the Eva Mae Dr. community. (
APPENDIX C: WATER MAIN EXTENSION: ARCGIS DATA AND
METHOD, Figure 13)
“Download Data”, Wake County Government Geographic Information Services website
‘Topo: Raleigh ETJ (2012)’
(Download Data, 2014)
Property parcel shapefiles Shapefiles containing location of property lines throughout Wake County. Includes information such as parcel address, owner, land use type, and value. (
APPENDIX C: WATER MAIN EXTENSION: ARCGIS DATA AND
METHOD, Figure 13)
“Download Data”, Wake County Government Geographic Information Services website
‘Wake_Property_2014_10’
(Download Data, 2014)
Street and highways shapefiles
Shapefiles containing the location of streets and highways in Wake County. (
APPENDIX C: WATER MAIN EXTENSION: ARCGIS DATA AND
METHOD, Figure 12)
“Download Data”, Wake County Government Geographic Information Services website
‘Wake_Streets_2014_10’ ‘Wake_Highways_2014_10’
(Download Data, 2014)
13 Extension Design and Materials Needed
The proposed water main extension design consists of four connections to the existing City of Raleigh water network (Figure 3). The extension will include 6-inch, 8-inch, and 12-inch diameter class 350 ductile iron pipe (DIP) (Table 3).
Table 3. Pipe and hydrant inventory of water extension design.
Component Quantity
Existing water main connections 4 Units 6-inch DI water main, class 350 24 LF 8-inch DI water main, class 350 2500 LF 12-inch DI water main, class 350 1500 LF
Fire Hydrants 12 Units
Note: LF=Linear Feet
It should be noted that in Table 3, lengths of pipe are presented in units of linear feet (LF). The 6-inch DIP will serve as connecting pipe between the 8-inch and 12-inch water mains and the 12 fire hydrants installed. Hydrant locations were chosen to be no further than 400 feet from each home in the community, and intersections are designed to be fully valved. The extension was designed in compliance with City of Raleigh Public Utilities Department
specifications (Public Utilites Handbook, 2014). The methods used in designing the extension network in WaterGEMS are detailed in Appendix D.
Cost Estimation
14
approximately $200,000, with most permitting costs pertaining to the Pavement Cut Fee. Other permit costs considered included street right-of-way permitting, stream buffer impact permitting, and an engineering field inspection permit. In the case of annexation, the City of Raleigh Public Utilities Department would be responsible for the capital construction costs of the extension. Operation and maintenance (O&M) costs were assumed to be negligible in comparison to the utility’s current annual O&M expenditures for the existing 2,500 miles of water lines (2013 Citizens' Annual Financial Report, 2013). The calculations of estimated cost to the water utility are detailed in Appendix E.
Costs to the community members to connect to the newly constructed water main were estimated using current City of Raleigh fees. Community homeowners would be liable for approximately $4,000 per household ($120,000 for all households in the community) in upfront costs for well abandonment and connecting to the municipal water service network. To
determine the approximate monthly bill per household, the average water demand in 2013, 96 gallons per capita day (gpcd), was assumed for the Eva Mae Dr. community population (Waldroup, Wheeler, Buchan, & Tant, 2013). Calculations also accounted for property taxes charged to each household as a result of annexation into the Raleigh city limits as well as increased property value. When including initial upfront costs, annual cost of monthly water bills, and additional property taxes charged each year, the net present value to the community homeowner over the next 30 years is estimated to be approximately -$18,000 per household (-$540,000 for all households in the community) at a 4% discount rate. The method and data used in this calculation are detailed in Appendix G.
15
of all resident water bill revenue contributes to capital construction projects, the net present value revenue of water bills contributing to the Eva Mae Dr. community project is estimated to be approximately $70,000. The net present value costs to the City of Raleigh, accounting for capital construction and permitting expenditures (-$950,000) as well as revenue from upfront
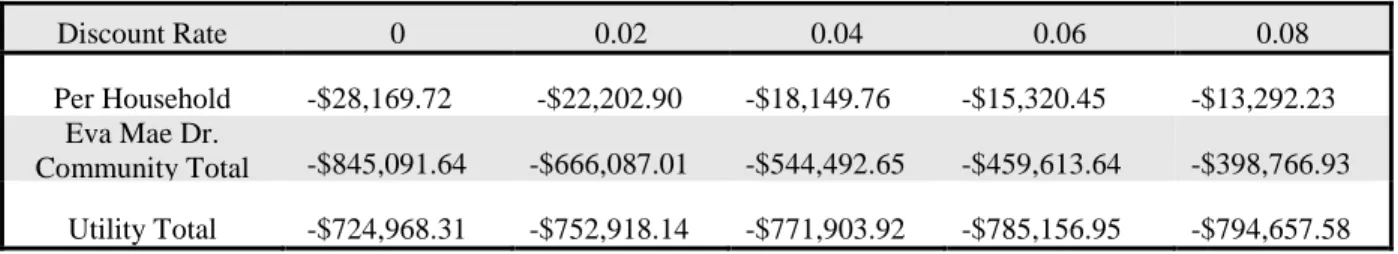
community resident fees (~$120,000) and monthly water bills (~$70,000), were calculated to be approximately -$770,000 at a discount rate of 4% (Table 4). Note in Table 4, the NPV to the utility is increasing as the discount rate increases as a result of annual water bill revenue from the community.
Table 4. Estimated NPV of water main extension to each household, to the Eva Mae Dr. community as a whole, and to the water utility for a duration of 30 years.
Discount Rate 0 0.02 0.04 0.06 0.08
Per Household -$28,169.72 -$22,202.90 -$18,149.76 -$15,320.45 -$13,292.23 Eva Mae Dr.
Community Total -$845,091.64 -$666,087.01 -$544,492.65 -$459,613.64 -$398,766.93
Utility Total -$724,968.31 -$752,918.14 -$771,903.92 -$785,156.95 -$794,657.58
Testing and Treatment of Water at the Well
Evaluation of costs to the community to monitor and treat their wells as per NC DHHS recommendations involved estimating the cost per household of testing, chemical treatment as needed per recommendation by Wake County, the cost of whole-house filters as needed, and the cost of an annual well water checkup over a 30 year time span.
Cost of Water Quality Testing
The EPA does not regulate self-supplied well water. The maintenance of well structure and water quality is the responsibility of the owner. Well owners are charged a fee for
16
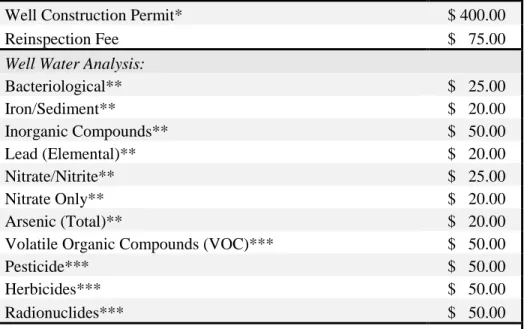
Table 5. Cost of private well services in Wake County (Well Fees, 2012).
Well Construction Permit* $ 400.00
Reinspection Fee $ 75.00
Well Water Analysis:
Bacteriological** $ 25.00
Iron/Sediment** $ 20.00
Inorganic Compounds** $ 50.00
Lead (Elemental)** $ 20.00
Nitrate/Nitrite** $ 25.00
Nitrate Only** $ 20.00
Arsenic (Total)** $ 20.00
Volatile Organic Compounds (VOC)*** $ 50.00
Pesticide*** $ 50.00
Herbicides*** $ 50.00
Radionuclides*** $ 50.00
*Includes sample collection and laboratory analysis by Wake County
**Additional $50.00 fee for collection by Wake County Environmental Services in leiu of collection and submittal to Wake County Human Services Laboratory by the test requestee
***Must be collected by Wake County Environmental Services. Require an additional $50.00 fee per trip.
Private well water samples are submitted through the local health department to the NC State Laboratory of Public Health for testing. Within three weeks, results are returned to the local health department. For bacteriological tests, results will indicate the presence or absence (positive or negative) of any quantity of total coliform, including fecal coliform or E. coli (Walston, 2015). The Wake County Government recommends disinfection of all wells testing positive for coliform bacteria, as the presence of such bacteria is an indicator of potential fecal contamination. For chemical contaminant tests, test results are provided in the form of
17 Well Water Treatment Options
Wake County Government recommends that wells be disinfected through a chlorination process in the instance that the well water has tested positive for coliform bacteria. The water should subsequently be retested after the chlorine has been flushed from the system. If the water continues to test positive for coliform after three chlorination procedures, inspection via camera to identify potential construction deficiencies is suggested as an option (Well and Water Testing FAQ). An alternative option in this case is to install treatment devices such as whole-house filtration systems to disinfect the water.
Cost of Well Water Treatment
Costs were evaluated for water quality testing, treatment when needed, and annual well water checkups over a 30-year time span. The Eva Mae Dr. community census block includes 30 homes and one church. It is assumed that each home depends primarily on self-supplied well water for a total of 30 wells in the ETJ4. The church located within the census block is
connected to municipal water services.
Cost estimates for water quality testing per NC DHHS recommendation were calculated for each well for 30 years. Calculations of these costs are detailed in Appendix I. The frequency of bacteriological and chemical test failures was assumed to be 32.2% for coliform bacteria and 4.7% for other primary and secondary contaminants per year, respectively, based on two
previous studies in Wake County (Stillo, 2015; TrAC, 2011). Other assumptions adopted in the calculation of the costs of well water testing and treatment over a thirty year time span were:
4 According to the Wake County iMAPS, the Eva Mae Dr. community contains 4 wells and 10 septic tanks (iMAPS,
18
Well water consumers in the community will have the well water tested per NC DHHS recommendation each year.
Maintenance is only considered in the capacity of annual well checkups. The depth of all wells is approximately 200 LF5.
The probability of annual bacteriological test failure is approximately 10 of 30 years (32.2% failure rate, (Stillo, 2015)).
The probability of annual chemical test failure is approximately 1 of 30 years (4.7% failure rate, (TrAC, 2011)).
One bottle of chlorine (121 fluid ounces) will be purchased each year in the case of a bacteriological test failure. Disinfection is performed by the home owner. If a well is tested for chlorine, it will not fail another bacteriological test in the
same year.
Three consecutive years of bacteriological test failures will result in the decision to purchase a whole house water filter (Appendix I).
One chemical test failure will result in the decision to purchase a whole house water filter.
If a whole house water filter is installed, water quality testing will continue with no failures.
The capital and maintenance cost of a whole house water filter are estimated based on the Aquasana © 1,000,000 Gallon “Rhino” Whole House Filter System. The cost of Aquasana © products will not change over the thirty year time span. If a whole house filter is installed, maintenance of the system will be upheld per
Aquasana © recommendations.
The whole house filter system to be purchased will have a life of approximately 10 years (Aquasana, 2015).
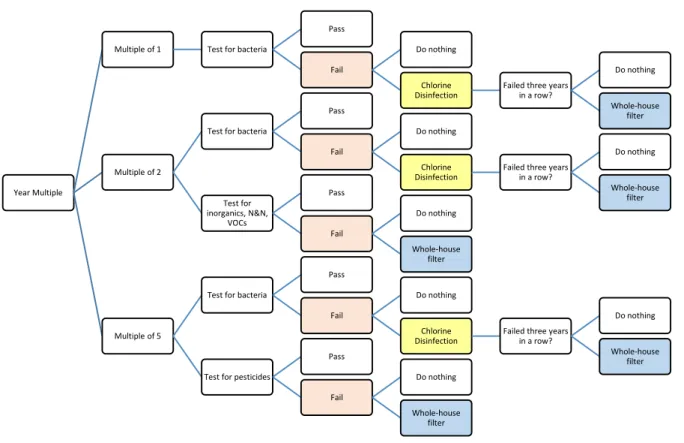
The annual well water testing process modeled in the cost estimation of well water testing and treatment calculations are detailed in Figure 4. The well water testing schedule was modeled per recommendation from the NC DHHS to test well water for total and fecal bacteria annually, inorganic compounds, nitrates and nitrites, and VOCs biannually, and pesticides every five years (Well Water and Health: Facts & Figures, 2014). It should be noted that cost calculations simplify the chlorine disinfection process by not including retesting (recommended up to two
19
times after the initial failed test) (Well and Water Testing FAQ). Additionally, the “do nothing” option is not considered in the well water testing and treatment cost calculations.
Figure 4. Possible events associated with well water testing and results.
The resulting cost of well water testing and treatment over 30 years was estimated to be between approximately $15,000 and $27,000 per household depending on timing of bacterial and chemical failures. In the model, although year of purchase varied, each house purchased a filter during the 30-year simulation period. Fewer households purchased a filter as a result of three consecutive bacteriological test failures (20%) than chemical failures (83%) with most of the private wells simulated failing between years 11 and 15 (37%, when comparing 5 year intervals). (One household installed a whole house filter in the third year of consecutive bacteriological test
Year Multiple
Multiple of 1 Test for bacteria
Pass
Fail
Do nothing
Chlorine Disinfection
Failed three years in a row?
Do nothing
Whole-house filter
Multiple of 2
Test for bacteria
Pass
Fail
Do nothing
Chlorine Disinfection
Failed three years in a row?
Do nothing Whole-house filter Test for inorganics, N&N, VOCs Pass Fail Do nothing Whole-house filter
Multiple of 5
Test for bacteria
Pass
Fail
Do nothing
Chlorine Disinfection
Failed three years in a row?
Do nothing
Whole-house filter Test for pesticides
Pass
Fail
Do nothing
20
failures in which a chemical test also occurred.) The net present value includes costs of water testing, as-needed treatment, and maintenance checkups. Using a discount rate of 4%, the net present value of testing and treatment of all wells in the community over a 30 year time span is estimated to be approximately -$360,000 and the net present value to each household on average is -$12,000 (Table 6).
Table 6. Estimated NPV of well water testing and treatment to each household in the community on average and to the Eva Mae Dr. community as a whole for a duration of 30 years.
No Action
In the case of no action, calculations considered the cost of acute gastrointestinal illness (AGI) each year within the Eva Mae Dr. community if the community lacks access to
community water service (CWS) over the thirty year time span of evaluation. The cost of AGI-related outpatient care, healthcare provider visits, emergency department (ED) visits, and productivity losses attributable to consumption of private well water per year was calculated based on information from three previous studies (Corso, et al., 2003; Jones, et al., 2007; DeFelice, in revision).
Firstly, the causal inference of avoided AGI-related emergency department (ED) visits per year if the population were to switch from self-supplied well water to CWS was calculated by adapting a previously developed multivariate linear regression model in Analytica Free 101 Edition (Release 4.5.3.31) by Lumina Decision Systems. The previous model used Analytica with Equation 1 and Equation 2 to estimate avoided AGI-related ED visits per month of a study population of 6,600 people in Wake County if the population were to switch from private well
Discount Rate 0.0 0.02 0.04 0.06 0.08
Per Household -$18,255.02 -$15,694.66 -$12,146.53 -$9,707.06 -$7,986.86 Eva Mae Dr.
Community Total
21
water to CWS (Stillo, 2015). The model is based on a previous longitudinal panel study of associations between emergency department visits for AGI and private well and community water system bacteriological water quality in North Carolina (DeFelice, in revision).
Equation 1. Calculation of attributable fraction, AF, of ED visits from AGI cases due to consumption of self-supplied well water (Stillo, 2015).
𝐴𝐹 = 1 − ( 𝑒 0
𝑒𝛽∗𝐶𝑑𝑤𝑠)
In Equation 1, 𝑒0 represents the total study population connected to CWS. The
percentage of the population dependent on private well water that are exposed to total coliforms, β, was developed from a fitted regression model for AGI cases in which the mean value of β is
.797 (95% CI: 0.719-0.874) (DeFelice, in revision). The percent of the study population exposed to total coliform bacteria (29.2%), Cdws, was derived from Stillo’s study of 57 self-supplied wells
in the ETJ of Wake County (Stillo, 2015).
Equation 2. Calculation of avoided AGI ED visits per month due to consumption of self-supplied well water (Stillo, 2015).
𝐴𝑣𝑜𝑖𝑑𝑒𝑑 𝑉𝑖𝑠𝑖𝑡𝑠 = 𝐴𝐹 × (𝑅 × 𝑃)
In Equation 2, R is the annual rate of AGI-related ED visits in Wake County estimated from record between January 2007 and October 2013 (LN 0.00251, 95% CI: 0.00176-0.00343). The population of residents who live in majority African American census blocks within the ETJ of Wake County in 2012 is represented by P (Stillo, 2015). Equation 2 was adapted to calculate annual avoided visits to for only the Eva Mae Dr. community population of 66 people.
22
When calculating the avoided AGI-related ED visits using the minimum and maximum of the β variable 95% confidence interval, the number of avoided ED visits were estimated to range between 0.38 and 0.45 visits.
The number of AGI-related ED visits was used to estimate the number of outpatient incidents and healthcare provider visits using national population proportions from a Foodbourne Diseases Active Surveillance Network (FoodNet) study conducted by the United States Centers for Disease Control (CDC) from 1993 to 2006. In this study, approximately 19.5% (95% CI 17.4-21.6%) of persons with AGI visited a healthcare provider, 6.4% (95% CI 5.0-7.8%) visited the ED, and 1.9% (95% CI 1.2-2.6%) visited a hospital (Jones, et al., 2007). Hospital visits were excluded from this estimation. The combined number of outpatient incidents, healthcare
23
Table 7. Estimated NPV to each household in the Eva Mae Dr. community and the community as whole with no action for a duration of 30 years.
Comparison of Technical Options
The three technical options were compared in terms of cost, convenience and feasibility, and health implications from the perspective of the Eva Mae Dr. community and the Public Utilities Department of Raleigh, NC.
Comparison of NPV of Each Technical Option
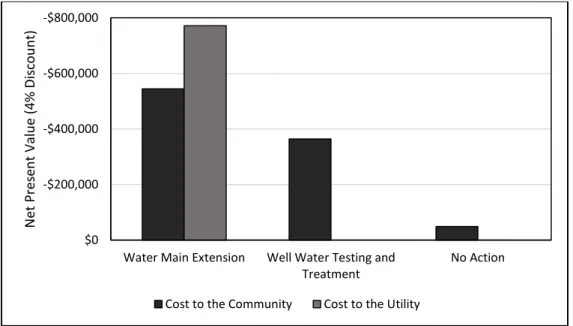
The extension of existing water services is the only alternative in which the utility is responsible for any payment. However, community members accrue financial responsibilities in each of the alternative solutions. From the perspective of the community, the no action option involves the least financial burden (Error! Reference source not found.).
Figure 5. NPV to the utility and to the consumer for each technical option.
-$800,000
-$600,000
-$400,000
-$200,000
$0
Water Main Extension Well Water Testing and Treatment No Action N et Pres en t Valu e (4% Dis cou n t)
Cost to the Community Cost to the Utility
Discount Rate 0.0 0.02 0.04 0.06 0.08
Per Household -$2,734.96 -$2,082.62 -$1,639.49 -$1,330.17 -$1,108.43 Eva Mae Dr.
24
When considering the net present value of costs and benefits, the water main extension is the most expensive option for the both the Eva Mae Dr. community residents and the water utility.
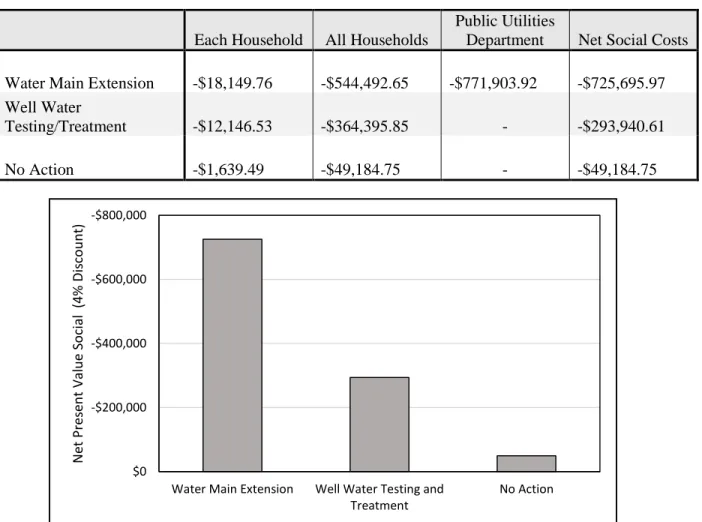
The water main extension remains the most expensive option when comparing the NPV for each technical option from the perspective of each household in the Eva Mae Dr. community, the City of Raleigh Public Utilities Department, and the social costs, excluding transactions between the Eva Mae Dr. community, the Public Utilities Department, and the City of Raleigh (Table 8, Figure 6).
Table 8. NPV at a 4% discount rate for each technical option from three perspectives: each household, the Public Utilities Department, and social.
Each Household All Households
Public Utilities
Department Net Social Costs Water Main Extension -$18,149.76 -$544,492.65 -$771,903.92 -$725,695.97 Well Water
Testing/Treatment -$12,146.53 -$364,395.85 - -$293,940.61
No Action -$1,639.49 -$49,184.75 - -$49,184.75
Figure 6. NPV social at a 4% discount rate for each technical option.
-$800,000
-$600,000
-$400,000
-$200,000
$0
25
If a recommended solution were to be chosen on the basis of finances alone, the no action option would be suggested from the perspective of the Eva Mae Dr. community and from net social costs. From the perspective of the City of Raleigh Public Utilities Department, the options of well water treatment and testing or no action would be recommended. However, other
significant factors such as convenience, feasibility, and health implications (beyond costs) contribute to the decision-making process in this instance and must be considered.
Comparison of Convenience, Implementation Requirements, and Health Considerations for Technical Options
Feasibility, convenience, and implementation requirements were also considered for the three technical options.
Extension of Existing Water Line
To implement the water main extension technical option, annexation into the City of Raleigh must occur either by an organized, voluntary petition of the Eva Mae Dr. community residents submitted to the City of Raleigh or involuntary annexation of the community approved by the community residents. The annexation process, voluntary or involuntary, could be one of the possible hindrances to this solution option. Residents will be responsible for organizing a petition requesting annexation signed by all household owners in the case of voluntary
annexation. Whether annexation is voluntary or involuntary, community residents must request water and sewer services in accord with guidelines presented by the North Carolina General Assembly (NCGA, 2011). The community may be subject to inconveniences caused by the water main construction such as noise and road detours. Once the water mains have been installed, community members will be responsible for paying fees and connecting their household to the new service line. However, fulfilling these obligations and managing
26
addition to health benefits to each newly connected household, preliminary research conducted by the Cedar Grove Institute for Sustainable Communities showed that home values increase when full municipal services are provided (Joyner & Christman, 2005).
From a health perspective, the water extension technical option has the greatest likelihood of supplying quality water to the Eva Mae Dr. community on a consistent basis. Because water distributed by the water utility of Raleigh is regulated by the EPA, Eva Mae Dr. community residents are most likely to be supplied with high quality drinking water on a daily basis. Additionally, improved fire protection is a noteworthy benefit of the water main extension as hydrants are not presently available at all locations in the community.
For the City of Raleigh Department of Utilities, implementation of annexation, the construction of the extension, and identification of potential funding sources (if needed) could present complications. However, annexation and water main extensions are not unfamiliar processes for the City of Raleigh Public Utilities Department. The City of Raleigh added 128 acres through annexation in 2012 (Raleigh Data Book, 2013). After annexation, the water utility and the City of Raleigh will benefit from revenue generated by the community residents such as connection fees, utility bill payments, and property taxes. In a 2013 study of the fiscal impact of annexation on North Carolina municipalities, it was concluded that there is a positive
relationship between annexation and increases in municipal revenue per capita (Mallon, 2013).
Well Water Testing and Treatment
27
may be an obstacle in the execution of this technical option. In a study of private wells in New Hampshire, testing did not seem to be a top priority for households with private wells, despite risks of immediate and chronic health effects. Additionally, of those in the study who did find contaminants in their private well water, many still did not take action to alleviate contamination. Of participants that did have treatment systems, all claimed that they were costly and difficult to maintain (Borsuk, Rardin, Paul, & Hampton, 2014). Not only is this a potentially overwhelming, multifaceted process, it requires resident awareness of well water testing and treatment
guidelines as well as willingness to pay for these services. Awareness, cost, and inconvenience have been previously identified as the major barriers to well water and treatment (Borsuk, Rardin, Paul, & Hampton, 2014). This technical option may not be feasible if Eva Mae Dr. community residents are not willing or find it overly inconvenient to comply with well water testing and treatment recommendations.
By implementing recommended periodic well water testing and as-needed treatment, the Eva Mae Dr. community residents are likely to consistently be supplied with quality drinking water. The Aquasana© whole house filter system referenced in the well water scenario model achieves a 4-log (99.99%) disinfection for bacteria and most viruses (Whole House Filter, 2015). However, quality water assurance is not as robust in comparison to municipal water service as a result of less frequent monitoring and a lack of EPA regulation.
No Action
The implementation of the last technical option considered would require no action from the community or the municipality. However, this option does not fulfill the objective of
28
community participated in Stillo’s previously mentioned water quality study. This home tested positive for total coliforms on three occasions, indicating a potential risk of water contamination for all homes in the area (2015). This indication is further supported by Stillo’s overall results which concluded that 37 of 57 households (65%) selected to be sampled in Wake County’s extraterritorial jurisdiction that rely on individually-supplied well water tested positive for either total coliforms, Escherichia coli (E. coli), or Enterococci (Stillo, 2015). The increased
occurrence of health risks due to the consumption of nondisinfected groundwater sources was also demonstrated recently by a study in Wisconsin which concluded that populations served by nondisinfected groundwater may be exposed to waterborne viruses and consequent health risks (Borchardt, Spencer, Kieke, Lambertini, & Loge, 2012).
Limitations of Technical Option Comparison
It is important to note that there are limitations in comparing the three technical options based on this analysis. Evaluation of each technical option was limited by fluctuation in costs of materials, fees, and services. The application of this report for future reference may be restricted by variation in prices over time.
Extension of Existing Water Line
When evaluating the water main extension technical option, the exclusion of costs associated with other utility services such as sewer, solid waste, and street maintenance is a limitation. Additionally, when quantifying the utility bill costs to each household and
29
Additionally, upfront costs such as connection fees to the community and construction costs to the utility were assumed to be paid in one lump sum. This may have altered the comparison of technical options; however, due to the possible variations in payment methods, the evaluation assumed an upfront payment. It was also assumed that during the annexation process, household residents would request water services within the time period specified by the General Assembly of North Carolina’s annexation laws and therefore would avoid associated assessment fees. This assumption may serve as a limitation as the probability that all residents would request services in a timely manner is unknown.
Well Water Testing and Treatment
The periodic well water testing and treatment option was limited by the simplified model of well water testing, failures, and treatment. Simulating bacteriological or chemical test failures solely on the basis of previously determined probabilities of failure is limiting as it does not include other factors such as the quality of the well structure and location of the well.
Maintenance costs were excluded from the model except for annual maintenance checkups. In reality, it is very likely that the wells in the Eva Mae Dr. community would require maintenance, especially when considering the only known well age in the community is 54 years (Stillo, 2015) and the average household is 52 years old.
No Action
When quantifying the health costs associated with private well water and acute
gastrointestinal illness, the evaluation was limited by cost estimates from a study in a location outside of North Carolina. Additionally, it was assumed that the distribution of outpatient, healthcare provider, and emergency room care would be proportional to the distribution
30
CHAPTER 4: RECOMMENDED SOLUTION
IntroductionFrom comparison of the three technical options, based on costs, implementation
feasibility, and possible benefits, the extension of the existing water line through annexation was determined to be the recommended solution to ensure quality drinking water to the Eva Mae Dr. community. However, no single option takes precedence over the others when considering all attributes of importance in the decision.
The technical option of no action was excluded from consideration as it does not ensure quality drinking water to the Eva Mae Dr. community residents or eliminate the health risks associated with potentially contaminated drinking water. When comparing the remaining two technical options, water main extension through annexation and well water testing and treatment, the former is the most expensive for all parties involved. However, the difference between the NPV of the water main extension and the well water testing and treatment options for each household on a monthly basis is less than $29. Correspondingly, the likelihood of residents following recommended actions for implementation is more likely in the case of annexation and water main extension. It is unlikely that all residents would maintain a well water testing schedule and consistently mitigate health risks through treatment as-needed. Extending the existing water infrastructure to the community through annexation is the recommended solution on the basis of potentially manageable costs, practicality of implementation, and nearly
31
testing as well as some form of resident opinion polling prior to implementation of any of these technical options.
Extension of the Existing Water Line
The water main extension solution includes: (1) annexation, whether land-owner or municipality initiated, (2) water main extension design and construction, (3) as needed
32
CHAPTER 5: IMPLEMENTATION PLAN
IntroductionThe recommended technical option is to extend the existing municipal water main to the Eva Mae Dr. community. The implementation plan for the recommended solution to address the issue of potential substandard private well water quality in the extraterritorial community of Raleigh, NC includes details about the decision to pursue this technical option, the annexation process requirements and approval, water main design and construction requirements,
scheduling, potential technical problems, and long-term maintenance. The preferences of key stakeholders such as the water utility and the community residents should be considered first. Because extension of the existing water main is dependent upon annexation into the City of Raleigh, the annexation process and requirements are considered second. Thirdly, the capacity of the existing water main, design and costs, construction scheduling, and public disturbance are discussed. Lastly, potential technical problems during installation and thereafter as well as long-term maintenance is considered.
Stakeholder Preferences
33
the preferred solution to provide quality water to the residents of the Eva Mae Dr. community, the following details of implementation should be considered.
Annexation Requirements and Approval
If a community located within an extraterritorial jurisdiction desires to have water services, the community must be annexed into the city limits (or the community must compensate the town for the extended services, whether that be from the residents’ personal financial resources or through grants). For the purposes of this report, water services as a result of annexation is the only scenario considered. Because the median household income of the community’s census tract (528.06) is $53,828, it is assumed that a majority of the households within the community have an income greater than the poverty threshold and will petition for annexation in accordance with Section 10 of the North Carolina General Assembly (NCGA) Annexation Law or could potentially be involuntarily annexed in accordance with Part 7 (Census Explorer, 2013; NCGA, 2011).
Once the annexation application is reviewed, if the community is annexed into the city, water and sewer service must be provided within 3.5 years of annexation at no cost to the property owners (Bluestein, 2011; NCGA, 2011). However, there must be a submitted request from a majority of the owners within 65 days of receiving notice of the right to water service to avoid assessment fees (Bluestein, 2011; NCGA, 2011). Annexation procedure, whether
voluntary or involuntary, including public informational meetings, contracts with rural fire departments and solid waste collection firms, and recording and reporting should follow all guidelines and requirements of the NCGA Section 2011-396 Annexation Law.
Water Main Design and Construction
34
detailed in the submitted bids are expected to be similar to those calculated in this report. One consulting firm will be chosen to design, construct, and oversee the water main extension based on the submitted bids.
The water main extension should be designed in accordance with the most recent City of Raleigh Public Utilities Handbook by a designer employed by the consulting firm. The design detailed in this report is only preliminary. A final designer or consulting firm may review the preliminary design presented in this report, create required design drawings and specifications to be submitted to the City of Raleigh for approval, oversee the implementation of the project, and confirm that the project was completed in accordance with design specifications.
Scheduling
The scheduling of this project will ultimately be at the discretion of the City of Raleigh, although water services must be provided within three and one-half years after annexation becomes effective. If the City of Raleigh decides to apply for outside funding such as a
35 Public Disturbance
Vehicle traffic will most likely be disrupted during the construction process. Vehicle detour signs should be placed in proper areas during construction along Bethel Road and Eva Mae Dr. Precautions should be taken not to block any community residents from leaving the neighborhood and at least one lane should be available to the residents at all times for entering and exiting the neighborhood. The construction should be implemented in sections so as to disturb the least amount of land area each day. As there are no sidewalks in the neighborhood, pedestrian traffic disruption will be limited. Construction noise may also be considered a disruption to residents in the Eva Mae Dr. community and surrounding communities.
Technical Problems
Unexpected technical problems may also have the potential to increase the time required to complete the project and could possibly increase construction costs. Unpredicted or
incorrectly assumed factors such as weather conditions, soil type, or construction accidents are examples of possible technical issues. Adverse weather could delay the construction process by inhibiting transportation to the worksite or preventing the safe use of equipment on site. The interruption of construction is not likely to increase costs significantly. Although construction cost estimates include the possibility of bedrock in some portions of the soil, the presence of more or less bedrock than predicted may increase or decrease the cost of the project. Accidents during construction should also be considered as an accident involving tools and equipment, damage to existing infrastructure, or injury of a worker can increase the cost of the project as well as delay the project completion.
Long-term Maintenance
36
the municipal water to the household will be the responsibility of the household residents. Additionally, the supply of quality drinking water to the municipal water network is the
37
CHAPTER 6: CONCLUSION
Residents residing in the extraterritorial jurisdictions of municipalities are often not supplied with municipal water service and rely on self-supplied water systems. Self-supplied water, often from wells, is not regulated by the Environmental Protection Agency and may potentially increase health risks to household residents. The costs of ensuring standard water quality and potential resulting health benefits to residents relying on self-supplied well water in a census block located within the extraterritorial jurisdiction of Wake County were evaluated. Three options were evaluated as solutions to this problem: extending the existing water
38
APPENDICES
APPENDIX A: EVA MAE DRIVE COMMUNITY LOCATION
Figure 7. Location of Eva Mae Dr. community in Wake County, North Carolina.
39
Figure 9. View south from southern border of community on Bethel Rd. (Eva Mae Dr. Raleigh, NC, 2015).
40
APPENDIX B: WATER MAIN EXTENSION: INPUT CALCULATIONS FOR EXISTING CITY OF RALEIGH MASTER WATER MODEL
The average daily demand (ADD) of the entire community was calculated on the basis of the 2013 per capita water demand, 96 gallons per capita day (gpcd), provided in the 2013 City of Raleigh Water Resources Assessment Plan (Waldroup, Wheeler, Buchan, & Tant, 2013)
(Equation 3). This value was translated to maximum daily demand (MDD) using a peaking factor of 1.4, the peaking factor generally used by the City of Raleigh (Davis, Telephone, 2015) (Equation 4). The MDD at each node was calculated using Equation 5 where 𝐻𝑇 represents the total number of households in the community (30) and 𝐻𝑋 represents the number of households assigned to node X based on proximity to the node (Figure 10). The calculated MDD at each node (Table 9) was entered into the existing City of Raleigh Master Water Model by Todd Davis.
Equation 3. Total community average daily demand of water. 96 [ 𝑔𝑎𝑙𝑙𝑜𝑛𝑠
𝑝𝑒𝑟𝑠𝑜𝑛 × 𝑑𝑎𝑦] × 66[𝑝𝑒𝑟𝑠𝑜𝑛𝑠] = 6336 [
𝑔𝑎𝑙𝑙𝑜𝑛𝑠 𝑑𝑎𝑦 ]
Equation 4. Conversion from ADD to MDD. 6336 [𝑔𝑎𝑙𝑙𝑜𝑛𝑠
𝑑𝑎𝑦 ] × 1.4 = 8870 [
𝑔𝑎𝑙𝑙𝑜𝑛𝑠 𝑑𝑎𝑦 ]
Equation 5. MDD at node X.
𝑇𝑜𝑡𝑎𝑙 𝑀𝐷𝐷 [𝑚𝑖𝑙𝑙𝑖𝑜𝑛 𝑔𝑎𝑙𝑙𝑜𝑛𝑠
𝑑𝑎𝑦 ] ÷ 𝐻𝑇× 𝐻𝑋 = 𝑀𝐷𝐷𝑋[
𝑚𝑖𝑙𝑙𝑖𝑜𝑛 𝑔𝑎𝑙𝑙𝑜𝑛𝑠
41
Table 9. Calculated MDD (gallons per day) at each connection node. Node Households ADD (gpd) MDD (gpd)
1 5 1056 1478
2 8 1690 2365
3 2 422 591
4 15 3168 4435
Total 30 6336 8870
Figure 10. Household demand assigned to each new connection junction.
42
43
APPENDIX C: WATER MAIN EXTENSION: ARCGIS DATA AND METHOD
A shapefile containing the Eva Mae Dr. community was created from a shapefile containing all ETJ census blocks in Wake County. The Eva Mae Dr. community was selected from the Wake County ETJ attribute table. From this selection, the Eva Mae Dr. community shapefile was created using the ‘Create Layer From Selected Features’ command (Figure 12).
A shapefile of the 0.75 mile radius surrounding the Eva Mae Dr. community shapefile was created using the ArcGIS ‘Buffer’ tool (Figure 12). The radius shapefile was also used in data requests to Carl Stearns and Layman Ricker to be extracted from county-wide existing water and sewer shapefiles.
44
Figure 12. Eva Mae Dr. community shapefile, existing water infrastructure, and streets and highways within a 0.75-mile radius of the study community.
Because the community’s census block covered portions of four Wake County grid sections (1722, 1723, 1732, 1733), the topography shapefile for each grid section was intersected with the radius shapefile using the ‘Intersect’ tool (Figure 13). The four resulting trimmed topographic layers were merged using the ‘Merge’ tool to create one topography shapefile within the 0.75 radius of the ETJ. Once each shapefile was cut down to only include the area of
45
46
APPENDIX D: WATER MAIN EXTENSION: WATERGEMS NETWORK EXTENSION DESIGN
47
48
Figure 15. Elevation of designed pipes along Bethel Rd. from south to north.
Figure 16. Elevation of designed pipes along Martha St. from east to west.
Figure 17. Elevation of designed pipes along Poplar Dr. from west to east.
Intersection with Martha St.
Intersection with connecting street
49
Figure 18. Elevation of pipes along the connecting street between Martha St. and Poplar Dr. from south to north.
Figure 19. Elevation of designed pipes along Eva Mae Dr. from north to south.
Intersection with
Poplar Dr. Intersection with
50
APPENDIX E: WATER MAIN EXTENSION: ESTIMATION OF COSTS TO THE UTILITY
Hypothetical Construction Bid
The calculation of the construction costs of the water main extension are detailed in Table 10. The unit cost of each item includes material and installation costs. The unit cost for each item of Table 10 was estimated from three example bids from similar projects in Wake County (Appendix F). When available, unit cost per item from each example bid was averaged to calculate the unit cost to be used in the construction cost opinion calculation for each item. For Item 1, 2% of the subtotal of the project was calculated. For Items 2 through 11 and Item 15, quantity of units were determined from existing ArcGIS shapefiles and the project design in WaterGEMS. Items 12, 20, 24, and 25 were estimated based on example bids of projects with similar overall pipe lengths and diameters. Items 13 and 14 are equal to the number of
51
Table 10. Hypothetical bid for Eva Mae Dr. community water main extension.
Eva Mae Dr. Community
ITEM DESCRIPTION QUANTITY UNIT UNIT COST CONSTRUCTION
COST OPINION
1 Bonds, Insurance, Mobilization, 2% Max 1 LS $ 14,555.00 $ 14,555.00
2 6-inch DI Water Main, Class 350 30 LF $ 45.43 $ 1,363.01
3 8-inch DI Water Main, Class 350 2,400 LF $ 49.80 $ 119,520.00
4 12-inch DI Water Main, Class 350 1,550 LF $ 50.98 $ 79,019.00
5 12"x8" Tapping Sleeve and Valve Assembly 2 EA $ 5,298.75 $ 10,597.50
6 8"x8" Tapping Sleeve and Valve Assembly 2 EA $ 4,100.00 $ 8,200.00
7 6-inch Gate Valve Assembly 12 EA $ 1,912.20 $ 22,946.40
8 8-inch Gate Valve Assembly 11 EA $ 1,804.60 $ 19,850.60
9 12-inch Gate Valve Assembly 6 EA $ 3,357.00 $ 20,142.00
10 New Fire Hydrant Assembly* Includes tapping sleeves 12 EA $ 4,167.00 $ 50,004.00
11 Connection to Existing Water Main 4 EA $ 2,903.40 $ 11,613.60
12 Ductile Iron Fittings 1,600 LBS $ 7.60 $ 12,160.00
13 3/4-inch Water Service 30 EA $ 2,210.60 $ 66,318.00
14 3/4-inch Water Service Curb Stop 30 EA $ 386.00 $ 11,580.00
15 Existing Blowoff and Manhole Removal 3 EA $ 2,122.00 $ 6,366.00
16 Asphalt Roadway Patching 4,000 SY $ 33.38 $ 133,500.00
17 Gravel Driveway Repair 115 SY $ 15.75 $ 1,811.25
18 Asphalt Driveway Repair 15 SY $ 88.50 $ 1,327.50
19 Concrete Driveway Repair 47 SY $ 78.75 $ 3,675.00
20 Miscellaneous Concrete 75 CY $ 181.00 $ 13,575.00
21 Rock Excavation by Mechanical Methods 450 CY $ 184.25 $ 82,912.50
22 Select Backfill 450 CY $ 25.53 $ 11,488.50
23 Temporary Ditch Liner 2,000 SY $ 3.60 $ 7,200.00
24 Erosion Control Measures Maintenance and Removal*
Includes silt fencing 1 LS $ 9,083.38 $ 9,083.38
25 3rd Party Testing Allowance 1 LS $ 5,000.00 $ 5,000.00
26 Clean Up and Seeding (Min. 15% of total cost of piping) 1 LS $ 29,985.30 $ 29,985.30
Note: CY=Cubic Yards, EA=Each, LBS=Pounds, LF=Linear Feet, LS=Lump Sum, SY= Square Yard
Total Bid Price $ 753,793.54
52
Figure 20. Soil composition of construction area (Soil Map, 2015). Permitting Costs
53
Figure 21. Riparian stream buffer intersecting construction area in community.
The extension project disturbs less than one acre of land and therefore is exempt from an Erosion Control permit from NCDENR Division of Land Quality (Navarrette, 2015). The permitting costs included in cost calculations are detailed in Table 11.
Table 11. Permitting costs of water main extension.
Permit Quantity Unit Unit Cost Estimated Cost
Street Right-of-Way 1 LS $ 289.00 $ 289.00
Engineering Field Inspection for a Public Water Main 4000 LF $ 1.16 $ 4,632.00
Pavement Cut Fee 4000 LF $ 51.00 $ 204,000.00
Right-of-Way (per Driveway) 24 EA $ 81.00 $ 1,944.00
Water/Sewer Plan Review 1 LS $ 200.00 $ 200.00
Stream Buffer Impact 1 LS $ 240.00 $ 240.00