Transportation and Risk Perceptions in Individuals Varying in Numeracy
Remi S. Moore
University of North Carolina at Chapel Hill Spring 2013
Acknowledgements
Dr. Melanie Green, thank you so much for advising me this year. Your encouragement, even in the toughest of times, has not only pushed me further as an academic, but also as a person. I’ve learned so much about myself thanks to working with you on this project, and could not imagine reaching this milestone without your advice. Dr. Mitch Prinstein, thank you for serving on my committee and for being a wonderful mentor. I truly appreciate your humor, your genuine support, and your disarming personality which has always put me at ease. Many thanks to all of my friends and mentors in the Green Lab and the Peer Relations Lab. Thank you for all your encouragement along the way, and for all your wonderful feedback. Thanks is always due to my friends, who have been by my side for this entire process. Thank you for the motivation, for weathering long hours in the library with me, and for always laughing at my silly jokes. And of course, thanks Mom and Dad. I wouldn’t be here if it weren’t for you. Thanks to all of you, I’ve grown so much. What I’ve learned from all of you could not be contained in this paper, but I hope you understand just how grateful I am for your support.
Abstract
In medical settings, people often base their perceptions of risk on a mix of numeric and narrative information. Previous research has shown that narrative transportation, immersion in stories, is an effective persuasive technique, and that different representations of numbers may have
different effects on risk perception. However, little research has examined individual differences as mediating factors for communication techniques. Furthermore, past research has only
Transportation and Risk Perceptions in Individuals Varying in Numeracy
How health information is presented is paramount in how people perceive risk. People perceive disease differently based on what kind of information is available, and this in turn may influence if they have any strong emotional response, as well as if and how they engage in preventative action. Information given at the doctor’s office, although of high quality, may not be a layperson’s first choice when informing themselves about different diseases. In fact, many people are turning to the internet rather than asking their doctor about health information (Betsch, Ulshöfer, Renkewitz, & Betsch, 2011). This could be because doctors use hard to understand statistics when describing risk. The frequent use of numbers may be a central problem in communicating a clear message of risk to the public.
People’s knowledge and comfort with numbers has a large effect on their risk perceptions for diseases and other factors in health. People who do not understand numbers or statistics may not perceive a health risk realistically and may not respond with adequate prevention behaviors. For example, if someone underestimates their risk of getting a disease and fails to participate in prevention behavior, they may be more in danger of suffering the effects of the disease than they would be otherwise. On the other hand, overestimation of personal risk may result in faulty decision making.
literacy for informed decision making because numbers are involved in most areas of health communication and must be used to judge risks and benefits of medical treatments. Although the skill is important because numbers permeate most of health communication, about half of Americans are low in numeracy (Kirsch, Jungeblut, Jenkins, & Kolstad 2002).
Numeracy has often been investigated in conjunction with risk perception. A risky behavior is one that entails the possibility of loss (van der Pligt, 1996), whether it be the loss of health, happiness, or some other benefit. A person’s estimations of risk can vary depending on factors like context and descriptions of risk information, or on cultural and individual
characteristics, like numeracy (van der Pligt, 1996). Previous research has shown that
individuals low in numeracy have some problems incorporating numeric information into their risk perceptions, which in turn negatively influence health and financial decisions, and other important judgments (Dieckmann et al., 2009) . Those low in numeracy were also more likely to be affected by framing manipulations in wording. In addition, these individuals interpreted likelihood information differently depending on whether it was reported in frequency likelihood format (10 out of 100) or percentage likelihood form (10% out of 100) (Peters, Västfjäll, Slovic, Mertz, Mazzocco, & Dickert, 2006).
information was present, implying the value of the percentage format over the frequency format (Dieckmann et al., 2009).
Narratives are prose pieces that can describe personally experienced events, and can be useful in expressing things numbers cannot. This is especially true in terms of issues that exist outside of logic and reason, like personal values, meaning in a person’s life, or social
relationships (Howard, 1991). Narratives are becoming more and more common in health contexts, as laypeople often go online to gather health information. Using the internet, those uncomfortable with numbers can rely solely on narrative information about personal experiences with illnesses. However, the reports on the internet are of unverified validity and reliability (Betsch et al., 2011). Many online accounts may be missing important information, like statistics or other numbers that inform risk perceptions, so depending on these alone can be troublesome.
Peters et al. (2006) found that while making decisions, those low in numeracy tended to be more influenced by nonnumeric information. While highly numerate individuals tended to have precise judgments informed by their numeric skill, lowly numerate individuals were easily led astray by irrelevant information.
Dieckmann et al. (2009) compared the use of narrative versus numerical information. In a narrative condition, participants with lower numeracy reported greater usefulness, knowledge, and ratings of trust in the information than the more numerate, suggesting that the less numerate placed more value on the narrative than those with high numeracy, when compared to a
decision makers are unlikely to reach similar perceptions of risk, especially if they are focusing on some sources of information over others.
Although some studies have looked at narrative effects on risk perception in those with varying numeracy (Dieckmann et al., 2009), there has been little research focusing on specific characteristics of narratives that inform risk perception, like the potential to transport readers. Transportation into a narrative world is defined as “an integrative melding of attention, imagery, and feelings,” which is focused on story events (Green & Brock, 2000); people experience transportation when they become immersed in a story. Transportation depends on an array of factors, including perceived realism of the narrative and individual ability to create vivid mental images (Green & Brock, 2005). Transportation has also been shown to have an effect on belief change. Belief change may be caused by a reduction in negative cognitive responses and counter arguing, increased emotional responses, and increased personal relevance and identification with the characters (Green & Brock, 2005).
Stronger emotional responses may also be relevant in terms of risk. Intuitive feelings are the main way humans evaluate risk (Slovic, Finucane, Peters, & MacGregor 2004). This finding can be attributed to risk-as-feelings, a person’s instinctive and intuitive reaction to dangerous situations. Betsch et. al. (2011) found that highly emotional narratives had a significant impact on perceived risk, such that more emotional narratives lead to greater perceived risk. Emotional responses are strongly associated with risk judgments, especially feelings of dread (Slovic & Peters, 2006). Because emotions have such an integral effect on risk perception, they also play a part in behavior change.
der Pligt, 1996). According to Weinstein, Sandman, and Blalock’s (2008) precaution adoption process, people must first realize a specific risk exists. They must next recognize that the risk is significant and can affect people. Third, they must realize that they too are vulnerable to the risk before they can produce any change in behavior to prevent the risk. However, in a study by Dunlop et al. (2010), an individual’s perception of personal risk did not impact intentions to change their behavior.
The current study aims to focus on how individual differences influence and inform risk perception by examining the second and third steps in Weinstein’s et al.’s (2008) precaution adoption process. Based on prior research, individuals with varying numeracy have been shown to be influenced differently by numerical evidence and narrative evidence (Dieckmann et al., 2009). We aim to see how individuals view risk when presented with both types of information in a 2x2 between-subjects design. We focused specifically on narratives varying in transportive elements in order to identify if transportation itself is a dominant factor informing risk perception. Numerical percentages of risk likelihood are also manipulated in order to investigate if
participants’ perceptions of risk are influenced by the interaction between numerical and narrative evidence. In addition, emotional responses and intention to change behavior will be measured to examine any resulting effects on risk perception.
Transportability, or the general tendency to be transported into narratives, was an individual difference we investigated in addition to numeracy. Because those high in
when compared to those low in transportability, because their tendency to be transported is expected to lend itself to becoming personally immersed in the symptoms described in the narrative.
When considering numeracy as a factor, we expected differences in low and high numeracy individuals. In light of Dieckmann et al. (2009), we expected that transportation condition, or narrative quality, would predict risk perceptions in low numeracy individuals. Because individuals with high numeracy are expected to depend more on reported risk likelihood to inform their risk perceptions, we expect that risk condition will predict risk perceptions in highly numerate individuals. Furthermore, risk perceptions are expected to be more accurate, because of their focus on given risk likelihood. Again, because we expected the highly numerate to focus on given risk, we expected them to have lower ratings of intent to change their behavior, as well as fear and anxiety. We expected this because these participants are expected to perceive risk more rationally. In the same vein, we expected for these individuals to have intent to change that is appropriate to their condition (i.e., high for high risk conditions, and low for low risk conditions).
Method Participants and design
A sample of 219 undergraduates (119 female, 99 male, 1 unreported) were recruited from the University of North Carolina at Chapel Hill. Participants were either offered class credit or paid $5 for a one-hour session. Testing was done in groups of up to 8 participants at a time.
prevention of photokeratitis. The disease was described to be caused by UV light, and was characterized by “sharp pain, severe light sensitivity, blindness, and in its worst stages may require a corneal transplant.” The description then described the prevalence of photokeratitis in Americans as either 5% or 40%. Furthermore, the disease “can easily be avoided by wearing sunglasses with 100% UV protection when outdoors or in the sun, and covering windows with a UV blocking transparent film.”
Participants then read a fictional transcript about a patient’s experiences with the disease. The narrative was from the perspective of a young college female. She described her general health as average and her normal sight as near-sighted, requiring contact lenses or glasses. The protagonist described her increasingly serious symptoms and their sudden climax in an event that resulted in blindness. In the high transportation condition, the events were described as follows: “All of a sudden my best friend’s boyfriend pointed up at some Canadian geese coming to land in the grass, and I looked up. That was a mistake. I didn’t even look at the sun directly, but I felt the effects instantly. My eyes were burning, searing like someone poked hot coals into them.” In contrast, the low transportation condition described these same events as: “My best friend’s boyfriend, or maybe it was her, pointed up at some geese that were flying around and I looked up. That was such a mistake. Even though I didn’t even look at the sun directly, my eyes hurt
Participants were randomly assigned to one of four conditions: they read one of two versions of the disease description and narrative, which varied on high/low risk (5% and 40%) and high/low transportation, respectively.
Procedures and measures
The study was administered online via a survey website. After reading either a low (5%) or high (40%) risk version of a description of photokeratitis, participants read either the 565-word high transportation story or the 572-565-word low transportation narrative. After reading, participants completed several different measures as follows.
Transportation. Participants completed a 12-item narrative transportation scale, which indicated the degree of transportation into a given narrative (e.g. “While I was reading the narrative, I could easily picture the events in it taking place”) (Green & Brock, 2000).
Risk Perception. Risk perception was measured using four items adapted from Dillard, Ferrer, Ubel, & Fagerlin (2012), plus three additional questions to further assess risk. To
developing photokeratitis sometime in your life?” to which they responded with a 7-point scale (1 = much lower, 3 = about the same, 7 = much higher).
Emotional responses. To look at risk-as-feelings in relation to photokeratitis specifically, participants responded to items about vulnerability (“If I don’t wear sunglasses outside, I would feel very vulnerable to getting photokeratitis sometime in my life”), scared feelings (“I feel scared about the possibility of getting photokeratitis”), and worried feelings (“I am worried about getting photokeratitis”) on a 7-point scale (1 = strongly disagree, 7 = strongly agree). We took the mean of these items to form an anxiety composite (3 items; α = .90).
Participants also filled out the 20-item Positive and Negative Affect Schedule (PANAS) Questionnaire (Watson & Clark, 1999) to measure emotional responses. On a 5-point scale (1 = very slightly or not at all, 5 = extremely), participants rated different emotions like “Afraid” or “Inspired.” Scared, afraid, nervous, and jittery items from the PANAS questionnaire were combined to form a fear composite (4 items; α = .74), but the jittery item was discarded because it raised reliability significantly (3 items; α = .83).
Thought listing. Participants were asked to list any thoughts they had when they were reading the narrative. This information was used explore other factors of the narrative that may have influenced participants.
Subjective numeracy. Participants completed the 8-item Subjective Numeracy Scale (Fagerlin, Zikmund-Fisher, Ubel, Jankovic, Derry, & Smith, 2007), which measured perceived cognitive abilities regarding numbers as well as preference for numbers. On a 6-point Likert scale (1=not at all good, 6=extremely good) participants responded to questions like “How good are you at calculating a 15% tip?” The subjective numeracy scale was found to be reliable (8 items; α = .81), but we chose to exclude item 7 (e.g. “When you hear a weather forecast, do you prefer predictions using percentages…”) as it significantly raised reliability (7 items; α = .88).
Transportability. Participants also completed a 19-item transportability scale, which measured individual differences in the tendency to be transported in general (e.g. “While I am reading stories, I can easily picture the events in them taking place”) (Green, 1996).
Need for cognition. Participants completed the 18-item need for cognition scale
(Cacioppo & Petty, 1982). This scale measured participants’ enjoyment of cognitive exertion, or their need to think. Participants rated questions like “Thinking is not my idea of fun” on a 5-point scale (1 = extremely unlike me, 2 = somewhat unlike me, 3 = uncertain, 4 = somewhat like me, 5 = extremely like me).
Manipulation checks and demographic questions. Participants answered 3 additional questions. Participants responded to “According to the information you were given at the beginning of the study, what percentage of people are likely to get photokeratitis over their lifetimes?” with a number between 0% and 100%. They then answered “Had you heard of photokeratitis before coming into the study today?” and “Have you or a family member had photokeratitis?” with either yes or no.
Participants were also asked their gender, race, age, year in school, and major. Finally, participants were asked if they had heard anything about the study in the past.
Results
Transportation and risk manipulations were effective. There was a significant effect of transportation condition on transportation, F(1, 211) = 20.02, p < .001. Effects of risk condition and the interaction between risk condition and transportation condition were not significant, all Fs(1, 211) > .06, all ps > .54. There was a significant effect of risk condition on remembered risk1, F(1, 211) = 35344.46, p < .001. Effects of transportation condition and the interaction between transportation and risk condition were not significant, F(1, 211) = .003, p = .95, and F(1, 211) = .40, p = .53, respectively.
Objective numeracy was extremely negatively skewed (M = 9.43 out of a possible score of 11, SD = 1.90), indicating that most individuals in the sample were highly numerate.
Subjective numeracy was slightly negatively skewed (M = 4.40, SD = .93), with a minimum possible value of zero and a maximum of 6. Objective and subjective numeracy were
Males reported higher subjective numeracy than females, t(213.76) = 5.13, p < .001 (M male = 4.72, SD = .78; M female = 4.01; SD = 1.09), as well as higher objective numeracy than females, t(215.57) = 5.21, p < .001 (M male = 10.13, SD = 1.56; M female = 8.93; SD = 1.80). Females reported higher transportability than males, t(216) = -2.25, p < .05 (M male = 4.51, SD = .78; M female = 4.76; SD = .81).
Correlations
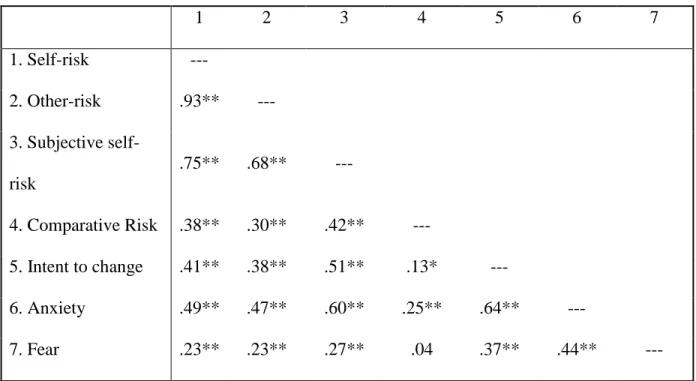
Before examining the effects of the manipulated variables, we looked at the patterns of correlations among the dependent variables. Transportation was moderately correlated with intent to change (r(217) = .44, p < .01). Transportation was strongly associated with anxiety composite (r(217) = .52, p < .01), and moderately associated with fear composite (r(217) = .29, p < .01).
Intent to change was strongly correlated with anxiety (r(217) = .64, p < .01), and
moderately correlated with fear (r(217) = .37, p < .01). Anxiety’s higher association with intent to change indicated that those whose emotions were specifically attributed to photokeratitis planned to make more of an effort to avoid the disorder.
Risk items were highly intercorrelated, and had associations with intent to change, anxiety, and fear. See Table 1.
Intent to change was strongly associated with self-risk (r(217) = .41, p < .01) and
subjective self-risk (r(217) = .51, p < .01), moderately with other-risk (r(217) = .38, p < .01) and negligibly with comparative risk (r(217) = .13, p < .05). Similarly, anxiety was strongly
illustrate a relationship between risk perceptions, feelings concerning a disease, and behavior change.
Our next set of analyses examined the effects of transportation condition and numeracy with each individual difference variable separately.
Transportability
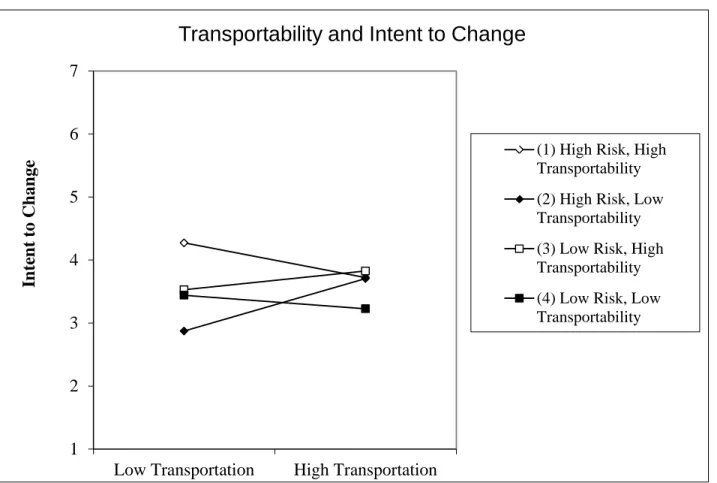
When transportability, transportation and risk conditions, and the interactions of the three were included in the regression, intent to change was significantly predicted by the risk
manipulation, B = -4.01, t(217) = -2.72, p < .01, the interaction between transportability and risk, B= .881, t(217) = 2.86, p < .01, the interaction between risk and transportation conditions, B = 5.54, t(217) = 2.86, p < .01, and the three-way interaction between transportability,
transportation condition, and risk condition, B = -1.169, t(217) = 2.86, p < .01. See Figure 1. We used the website http://www.jeremydawson.co.uk/slopes.htm to examine the interactions and graph the slopes to test differences between the slopes (Dawson, n.d.; Dawson & Richter, 2006).
When we ran a difference-of-slopes test on this three-way interaction with intent to change, we found that in high risk conditions, transportability only made a significant difference in low transportation conditions. In high risk/low transportation conditions, those with high transportability exhibit significantly more intent to change behavior than their low
transportability peers. In other words, when the story is less well written but there is high risk, people with high transportability report higher levels of intent to change. This supports my hypothesis that those with high transportability have higher intent to change, but only in the high risk/low transportation condition.
was not predicted by transportability, transportation condition, risk condition, or any
combination of these three, all Fs(1, 211) = 2.38, all ps > .19. These findings did not support my hypothesis that those with high transportability would have higher anxiety.
When transportability, transportation and risk conditions, and all combinations of the three were included in the regression, the fear composite was significantly predicted by the transportation manipulation, B = 1.51, t(217) = 2.18, p < .05. Individuals showed more fear in the high transportation condition. The fear composite was also marginally predicted by an interaction between transportability and transportation condition, B = -.28, t(217) = -1.92, p = .056. Surprisingly, low transportability individuals reported more fear in the high
transportation condition than high transportability individuals. In the low transportation condition, both high and low transportability groups reported similar fear. Otherwise, the fear composite was not predicted by transportability, transportation condition, risk condition, or any combination of these three, all Fs(1, 211) = 2.63, all ps > .12. This supported my hypothesis that those with higher transportability would have higher fear ratings.
There were no significant effects on self-risk, all Fs(1, 211) = 5.40, all ps > .34, other-risk, all Fs(1, 211) = 6.08, all ps > .19, or subjective self-risk, all Fs(1, 211) = 2.87, all ps > .17. Comparative risk was marginally predicted by transportability, B = .32, t(217) = 1.85, p = .07. Those who were more transportable gave higher risk ratings. Otherwise, comparative risk was not significantly predicted by transportability, transportation condition, risk condition, or any combination of these three, all Fs(1, 211) = 1.33, all ps > .09.
effect on comparative risk, which may suggest that when subjects compare their own risk to others, their view of risk may depend on their individual level of transportability.
Objective Numeracy
When objective numeracy, transportation and risk conditions, and all combinations of the three were included in the regression, there were no significant effects on intent to change, all Fs(1, 211) = .96, all ps > .37; anxiety, all Fs(1, 211) = 1.53, all ps > .34, or fear, all F(1, 211) = .93, all ps > .44.
There were no significant effects on any risk measure, including self-risk, all Fs(1, 211) = 5.36, all ps > .31, other-risk, all Fs(1, 211) = 6.01, all ps > .18, subjective self-risk, all Fs(1, 211) = 3.69, all ps > .27, or comparative risk, all Fs(1, 211) = 1.33, all ps > .33.
When objective numeracy was involved in regression analyses, there were no significant effects on intent to change or any emotional or risk measure. The lack of findings concerning objective numeracy fails to support any of our numeracy-related hypotheses.
Subjective Numeracy
When subjective numeracy, transportation and risk conditions, and all combinations of the three were included in the regression, there were no significant effects on intent to change, all Fs(1, 211) = .492, all ps > .65, the anxiety composite, all Fs(1, 211) = .676, all ps > .32, or the fear composite, all Fs(1, 211) = 1.16, all ps > .33. This failed to support our hypothesis that those with high numeracy would have lower intent to change, anxiety, and fear.
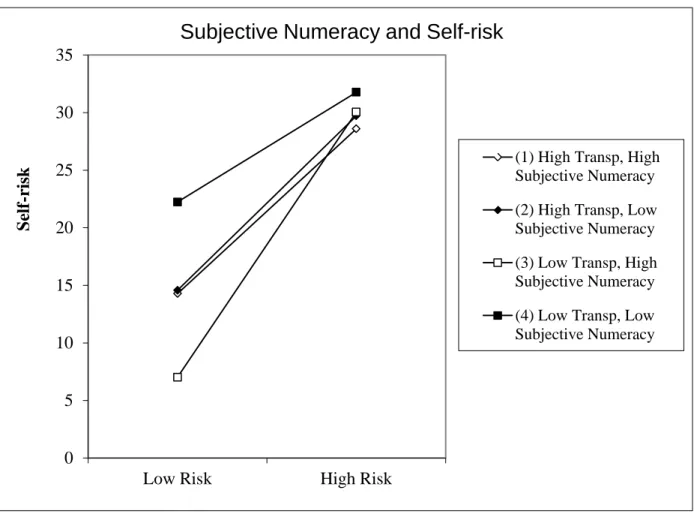
Self-risk. When subjective numeracy, transportation and risk conditions, and all
< .05. It was marginally predicted by an interaction between risk and transportation conditions, B = 45.74, t(217) = 1.90, p = .059. Self-risk was also predicted by the three-way interaction between subjective numeracy, transportation, and risk, B = -10.735, t(217) = -2.00, p < .05. See Figure 2.
To further investigate the direction of effects for self-risk, we used a comparison of slopes in the 3-way interaction. The only significantly different slopes were between high and low subjective numeracy groups across high and low risk conditions within the low
transportation condition.
In the low transportation condition, regardless of subjective numeracy, participants predicted similar ratings of self-risk in the high risk condition, but in the low risk condition, those with high subjective numeracy estimated significantly lower, more accurate self-risk than did their low subjective numeracy counterparts (t(217) = 1.93, p = .054). In other words, in the low transportation/low risk condition, those with high subjective numeracy predicted lower and more accurate self-risk than did those with low subjective numeracy, who overestimated self-risk. Otherwise, all groups estimated similar self-risk regardless of transportation condition or
subjective numeracy, indicating that subjective numeracy only becomes a differentiating factor in low risk/low transportation conditions. This supported our hypothesis that those with high numeracy predict risk more accurately, but only in low transportation/low risk conditions.
When looking at the effects of subjective numeracy and risk condition, regardless of subjective numeracy, those in the high risk condition estimated similar other-risk. Using a difference of slopes test, in the low risk condition those with high subjective numeracy estimated lower, more accurate estimations of other-risk than their counterparts (t(219) = -.84, p = .40). Although the difference of slopes is insignificant, it shows that in low risk conditions, those with high subjective numeracy estimate more accurate other-risk than do those with low subjective numeracy. Were this finding significant, it would support the hypothesis that high numeracy predicts estimations of risk, which are more accurate, even if the effect is specific to low risk conditions. See Figure 3.
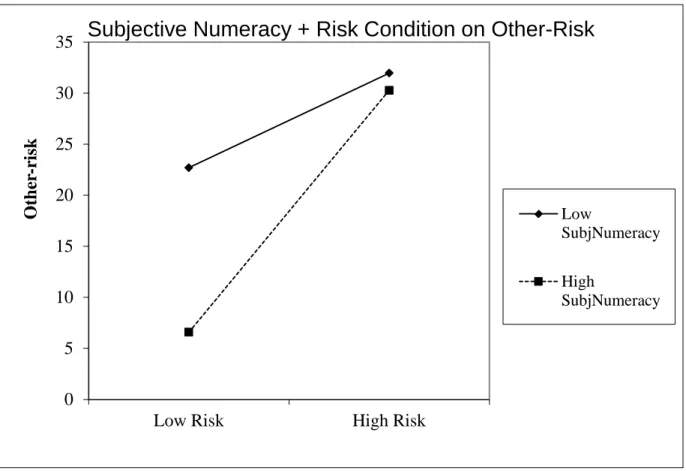
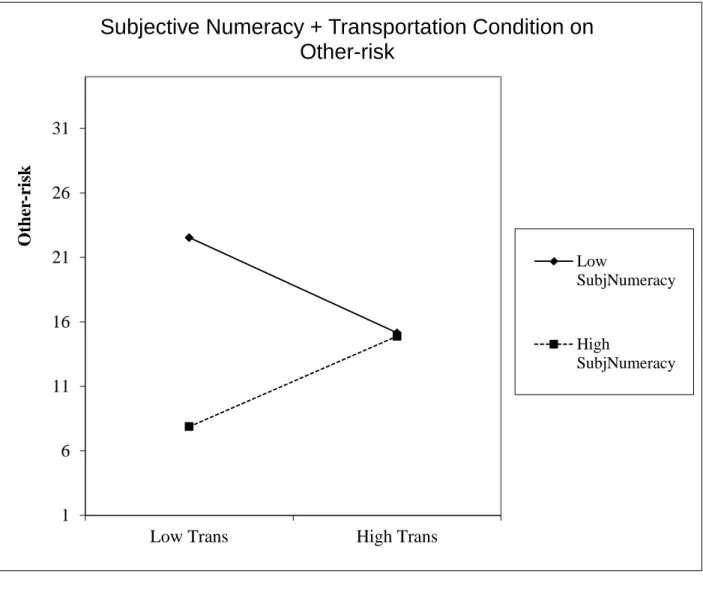
When looking at the effects of subjective numeracy and transportation condition, regardless of subjective numeracy, participants in the high transportation condition reported similar levels of other-risk, but those in the low transportation condition reported marginally significant differences in other-risk (t(217) = -1.79, p = .076). Again, those with high subjective numeracy reported lower appraisals of risk than their low numeracy counterparts. The trend shows that in the low transportation condition, those with high subjective numeracy tend to estimate lower other-risk. However, this does not support our hypothesis that transportation condition predicts risk in low numeracy groups because those in the high transportation group reported lower other-risk than did those in the low transportation group. See Figure 4.
Comparative risk. When subjective numeracy, transportation condition, and risk
condition were included in the regression, comparative risk was significantly predicted by almost all independent variables, including transportation condition (B = -2.48, t(217) = -2.56, p < .05), subjective numeracy (B = -.38, t(217) = -.37, p < .05), the risk and transportation interaction (B = 4.04, t(217) = 2.90, p < .05), subjective numeracy and risk interaction (B = .421, t(217) = 1.98, p < .05), subjective numeracy and transportation interaction (B = .64, t(217) = 2.95, p < .05), and subjective numeracy, transportation, and risk three-way interaction (B = -.917, t(217) = -2.95, p < .05). Risk condition was marginally significant in predicting comparative risk (B = -1.84, t(217) = -1.95, p = .053).
To further investigate the direction of effects for comparative risk, a comparison of slopes in the 3-way interaction was used. See Figure 5.
For participants in the high transportation condition, those with high subjective numeracy estimated higher comparative risk than did those with low subjective numeracy in the low risk condition (t(217) = -2.49, p < .05). In the high risk condition, the opposite is true, and
participants with low subjective numeracy estimated higher comparative risk than the high subjective numeracy group. This trend shows that in the low risk condition, the high subjective numeracy group estimated high comparative risk, while in the high risk condition the low subjective numeracy group estimated higher comparative risk. The pattern here shows that in conditions where narrative evidence is good, subjective numeracy is a significant predictor of comparative risk in different risk conditions. This trend is unexpected and unintuitive.
numeracy group (t(217) = 1.83, p = .068). Although this trend is not significant, it illustrates a pattern that when faced with non-transporting narrative evidence, those with higher numeracy more realistically estimate risk than their low numeracy counterparts. This supports the hypothesis that those with high numeracy more accurately estimate risk, but only in the low transportation/low risk condition.
In high subjective numeracy participants, regardless of transportation condition,
participants in the high risk condition predicted similar comparative risk. However, in the low risk condition, those in the low transportation condition estimated significantly lower risk than did those in the high transportation condition (t(217) = -2.147, p < .05). This finding supports the hypothesis that those with high subjective numeracy more accurately estimate comparative risk but only in the low transportation/low risk condition.
In low subjective numeracy groups, among those in the low risk condition, low transportation individuals estimated higher comparative risk than did their high transportation counterparts. In the high risk condition, however, the opposite is true, and high transportation participants estimate significantly higher risk than their low transportation counterparts (t(217) = 2.28, p < .05). This trend shows that in those with low subjective numeracy, those in the high transportation condition estimate higher comparative risk when in the low risk condition than in the high risk condition. The opposite is true for those in the low transportation condition. This interaction effect was unintuitive and unexpected.
Discussion
research has only investigated the presence or absence of a narrative as a factor influencing risk, rather than specific qualities of the narrative, like transportation quality. The present study aimed to investigate how participants would perceive risk when supplied with varying numerical and narrative evidence in a 2 x 2 between subjects design. Furthermore, the present study aimed to see how individual differences like transportability and numeracy would influence risk
perceptions.
Because those with high transportability are, by definition, generally more immersed in narratives, we hypothesized that they would have higher emotional responses like anxiety and fear, as well as higher behavioral intent to change. Although there was no support for higher anxiety, high transportability groups did exhibit higher levels of fear. Intent to change was higher in high transportability participants only in the high risk/low transportation condition, thus only supporting the hypothesis in that condition. This indicates that high transportability
becomes an influencing factor on intent to change only in threatening conditions when there is not a high quality narrative to depend on. In these situations, their high transportability becomes an influencing factor that makes them more motivated to change their behavior.
Because those with high transportability were expected to focus more on narrative information to inform risk perceptions, we predicted that they would in turn report higher risk perceptions. There was no evidence that transportability predicted risk measures of any kind, so this hypothesis was not supported. When considering the previous hypothesis, these findings indicate that transportability may not be related to risk perceptions per se, but only the resulting fear and intent to change behavior.
responses. We also anticipated that they would have lower intent to change. However, this hypothesis was not supported, because neither objective nor subjective numeracy predicted intent to change, anxiety, or fear.
The fourth hypothesis was that in those with low numeracy, transportation would predict risk perceptions. When considering the three-way interaction of subjective numeracy,
transportation condition, and risk condition on self-risk, those in the low transportation condition did overall estimate higher risk perceptions than their high transportation counterparts. Although this trend was expected, the difference of slopes was not significant, thus failing to support our hypothesis. When considering the three-way interaction on comparative risk, the trend is unintuitive and fails to support our hypothesis. Significant three-way interactions in other risk measures were not found. Support for this hypothesis was not found.
The fifth hypothesis was that in those with high numeracy, risk condition would predict risk perceptions, which is turn would be more accurate. When participants predicted self-risk, they supported this hypothesis only in the low risk/low transportation condition. The same trend appears when participants estimate comparative risk. In the low risk condition, those in the low transportation condition estimated significantly lower comparative risk than those in the high transportation condition. This indicates that by default everyone, regardless of numeracy, relies on narrative information to inform risk. Only when risk is low and there is a lack of quality narrative information do those with high subjective numeracy rely on their numeric skills to accurately inform risk.
Interpretations of noteworthy results
Individual differences as predictors. As an individual difference, both objective and
of the study. This contrasted with transportability, which did have relationships with these factors. This may indicate that subjective numeracy is important when formulating risk perceptions (perhaps a more cognitive process), while transportability is important for forming emotional and behavioral reactions to health information.
Objective and subjective numeracy. Objective numeracy failed to predict any measure,
including intent to change, fear, anxiety, or any risk measure. Subjective numeracy, on the other hand, was a significant predictor of risk measures including self-risk, other-risk, and comparative risk. The difference in findings between these two measures highlights a difference in relevance for actual numeric ability and perceptions of numeracy. Objective numeracy scores were very high compared to those in previous studies. In this study, subjective numeracy (i.e. perceptions of numeracy) was more relevant when informing risk perceptions.
Underestimation of risk. In all high risk conditions, regardless of numeracy, participants
underestimated risk. This may indicate a defensive mechanism present in previous studies. This underestimation may be present in order to protect oneself from distress in a high risk situation.
Comparative Risk. When asked about their own risk when compared to someone of
Interestingly, comparative risk had a weaker association with risk measures, intent to change, anxiety, and fear than did other risk measures. While other risk measures were strongly correlated with one another, comparative risk was only moderately correlated with each risk measure. Self-risk, other-risk, and subjective self-risk were similarly moderately to strongly correlated with intent to change, contrasting with comparative risk’s negligible relationship with intent to change. The other three risk measures were strongly associated with anxiety, but comparative risk was weakly correlated with anxiety. While the other three risk measures were weakly correlated with fear, comparative risk had no relationship with fear. The weaker
correlations with comparative risk indicate that this risk measure may have differed from the other risk measures in some way. The weakened relationships between comparative risk and the other three risk measures, as well as anxiety and fear may indicate why the results were
counterintuitive. See Table 1. Limitations and future directions
The present study was not without limitation. First, the disease described to the participants was a fictional one, and this may have yielded different risk responses than if the disease was a well-known one, like cancer. Our aim in using a fictional disease was to eliminate any preconceived notions about the disease at hand, so that any emotional responses or risk perceptions were entirely related to the information given in the lab. However, for real diseases, it is likely that participants will already have some previously formed perception of risk.
two measures. The Subjective Numeracy Scale was created as an alternative measure of objective numeracy (Fagerlin et al., 2007), so it was surprising that the two would not be
strongly related in this study. It would be beneficial in the future if more studies were conducted comparing objective and subjective numeracy to see what kind of relationship truly exists
between these variables.
Furthermore, our study lacked control groups. It would have been beneficial to use control groups that did not see risk prevalence or narrative information at all, in order to compare them to the risk and transportation interaction groups.
The present study also did not consider how important the health issue was to participants. In future studies, it would be interesting to measure how much an individual cares about the discussed disease or their likelihood of getting it. This factor may predict intent to change.
Future studies should further investigate if other individual differences influence perceptions of risk or emotional responses to health information. Perhaps individuals perceive risk differently based on current or past health status or health habits. Perhaps social factors like close friendships or significant others are more predictive of emotional responses to health information. More research is needed on how different types of people perceive risk and how to improve health communication to target groups.
Implications and conclusion
When people are given both narrative and numerical information to inform their risk perceptions, we found that although the manipulations worked (e.g., those in the high transportation condition had higher transportation than the low transportation condition, and those in the high risk condition reported higher risk than the low risk condition) people generally report risk similarly regardless of individual differences. Individual differences become
References
Betsch, C., Ulshöfer, C., Renkewitz, F., & Betsch, T. (2011). The influence of narrative v. statistical information on perceiving vaccination risks. Medical Decision Making, 31(5), 742-753. doi:10.1177/0272989X11400419
Cacioppo, J. T., & Petty, R. E. (1982). The need for cognition. Journal Of Personality And Social Psychology, 42(1), 116-131. doi:10.1037/0022-3514.42.1.116
Dawson, J. (n.d.). Interpreting interaction effects. Retrieved from http://www.jeremydawson.co.uk/slopes.htm
Dawson, J. F., & Richter, A. W. (2006). Probing three-way interactions in moderated multiple regression: Development and application of a slope difference test. Journal of Applied Psychology, 91, 917-926.
Dieckmann, N. F., Slovic, P., & Peters, E. M. (2009). The use of narrative evidence and explicit likelihood by decision makers varying in numeracy. Risk Analysis, 29(10), 1473-1487. doi:10.1111/j.1539-6924.2009.01279.x
Dillard, A. J., Ferrer, R. A., Ubel, P. A., & Fagerlin, A. (2012). Risk perception measures' associations with behavior intentions, affect, and cognition following colon cancer screening messages. Health Psychology, 31(1), 106-113. doi:10.1037/a0024787 Dunlop, S. M., Wakefield, M., & Kashima, Y. (2010). Pathways to persuasion: Cognitive and
experiential responses to health-promoting mass media messages. Communication Research, 37(1), 133-164. doi:10.1177/0093650209351912
Fagerlin, A., Zikmund-Fisher, B. J., Ubel, P. A., Jankovic, A., Derry, H. A., & Smith, D. M. (2007). Measuring numeracy without a math test: Development of the Subjective Numeracy Scale. Medical Decision Making, 27(5), 672-680.
doi:10.1177/0272989X07304449
Green, M. C. (1996). Mechanisms of narrative-based belief change (Master’s thesis). Ohio State University: Columbus.
Green, M. C., & Brock, T. C. (2000). The role of transportation in the persuasiveness of public narratives. Journal of Personality and Social Psychology, 79(5), 701-721.
doi:10.1037/0022-3514.79.5.701
Green, M. C., & Brock, T. C. (2005). Persuasiveness of narratives. In T. C. Brock, M. C. Green (Eds.), Persuasion: Psychological insights and perspectives, 2nd ed (pp. 117-142). Thousand Oaks, CA US: Sage Publications, Inc.
Howard, G. S. (1991). Culture tales: A narrative approach to thinking, cross-cultural psychology, and psychotherapy. American Psychologist, 46(3), 187-197.
doi:10.1037/0003-066X.46.3.187
Kirsch, I. S., Jungeblut, A., Jenkins, L., & Kolstad, A. (2002). Adult Literacy in America: A first look at the findings of the National Adult Literacy Survey (NCES Report No. 1993-275; 3rd ed.). Washington, DC: U.S. Department of Education, National Center for Education Statistics.
Lipkus, I. M., Samsa, G., & Rimer, B. K. (2001). General performance on a numeracy scale among highly educated samples. Medical Decision Making, 21(1), 37-44.
Peters, E., Västfjäll, D., Slovic, P., Mertz, C. K., Mazzocco, K., & Dickert, S. (2006). Numeracy and decision making. Psychological Science, 17(5), 407-413.
doi:10.1111/j.1467-9280.2006.01720.x
Reyna, V. F., Nelson, W. L., Han, P. K., & Dieckmann, N. F. (2009). How numeracy influences risk comprehension and medical decision making. Psychological Bulletin, 135(6), 943-973. doi:10.1037/a0017327
Slovic, P., & Peters, E. (2006). Risk perception and affect. Current Directions In Psychological Science, 15(6), 322-325. doi:10.1111/j.1467-8721.2006.00461.x
Slovic, P., Finucane, M. L., Peters, E., & MacGregor, D. G. (2004). Risk as analysis and risk as feelings: Some thoughts about affect, reason, risk, and rationality. Risk Analysis, 24(2), 311-322. doi:10.1111/j.0272-4332.2004.00433.x
van der Pligt, J. (1996). Risk perception and self-protective behavior. European Psychologist, 1(1), 34-43. doi:10.1027/1016-9040.1.1.34
Waters, E. A., Weinstein, N. D., Colditz, G. A., & Emmons, K. (2006). Formats for improving risk communication in medical tradeoff decisions. Journal Of Health Communication, 11(2), 167-182. doi:10.1080/10810730500526695
Watson, D., & Clark, L. A. (1999). The PANAS-X: Manual for the positive and negative affect schedule - expanded form. University of Iowa Department of Psychology Publications, Retrieved from http://ir.uiowa.edu/psychology_pubs/11
Footnotes
Appendix Disease Description
High Transportation Condition Narrative
I’d say I’m a pretty average girl. I never had perfect vision, but it definitely wasn’t bad. I hadn’t ever thought of it as a health problem before. I’m a little nearsighted, so I wear contacts, and I have to squint to see things far away without them. Before I got photokeratitis, I never really had any serious health problems, unless you count a few mild allergies and colds. I always liked bright spaces, so I generally let the light into my apartment whenever the sun was out, and I was out in it whenever I had a moment to sit and read or eat lunch.
When I think about it, I guess there were always symptoms. Every once in a while I’d get a sharp pain in my eyes but I’d blink, and it’d be gone in an instant. Sometimes I would have trouble focusing on something right in front of me, especially when I was reading for class, but I thought I was just tired. And every morning, I would have a hard time opening my eyes. The light was just too much for me, but I was never a morning person so I never thought too hard about it. The sharp pains eventually became more persistent. I never noticed that they always got worse in summer.
That day I was having a picnic in the park with my boyfriend and our friends. We were having a lot of fun playing UNO like a bunch of kids. All of a sudden my best friend’s boyfriend pointed up at some Canadian geese coming to land in the grass, and I looked up. That was a mistake. I didn’t even look at the sun directly, but I felt the effects instantly. My eyes were burning, searing like someone poked hot coals into them.
I thought I woke up in the middle of the night, but in reality, it was a sunny day. I realized it when I felt around for the light switch and flipped it. I couldn’t see. I kept thinking I had to be having some crazy nightmare, but no matter how much I rubbed my eyes or blinked, nothing was coming into focus. I was terrified.
The doctors told me that I had to have my corneas replaced because I had a serious case of photokeratitis. I would have never expected news like this. I was devastated, but also happy that it could be fixed, and that I wouldn’t be like this forever. I’m so glad my boyfriend was so compassionate. During my recovery, we spent a lot of time watching movies, and his hilarious descriptions really got me through.
Low Transportation Condition Narrative
I’m a pretty average girl I guess. I don’t think it’s a health problem, per se, but I don’t have the best vision. I wear contacts because I’m nearsighted, and I can’t see things far away all the time. I have allergies and colds every once in a while too. I got photokeratitis and that was a surprise. I like light so I spent a lot of time outside to read or eat lunch, and I opened the blinds to my apartment on sunny days.
I had symptoms the whole time. My eyes hurt a lot sometimes, like I’d get this sharp pain that would stop right after I blinked my eyes. Other times I couldn’t focus no matter what, especially when I was reading for class, but I thought I had to be just tired or something. Every morning, I’d have issues opening my eyes, but I thought that was just because I wasn’t a
morning person. Eventually the pains happened more often, and I think that they happened more in summer, too.
That day there were some geese or something out in a park. My best friend’s boyfriend, or maybe it was her, pointed up at some geese that were flying around and I looked up. That was such a mistake. Even though I didn’t even look at the sun directly, my eyes hurt suddenly. They were burning like someone poked them out with something really hot. It sucked so much. Oh, that day I was having a picnic somewhere, like at the park with my boyfriend and our some other people, our friends. We were having a lot of fun playing a card game like a bunch of kids. It was really ridiculous because they kept skipping me. I still don’t know why they always pick on me in that game.
locks himself in his room. Well so I was hiding in the dark, not even daring to open my eyes, which were already hurting without even looking at anything. I really just wanted it to stop, but I didn’t want to go out, so I just hoped it went away soon.
It felt like the middle of the night, but it was really the next day when I woke up. It was sunny I heard. I think Rebecca told me that. I figured it out when I felt around for the light switch and flipped it. I couldn’t see anything at all. I was really freaking out at this point, but no matter what I did I could not see a thing.
My boyfriend was awesome while I was getting better. We watched a lot of really funny movies, and he described stuff for me, so I was still enjoying my time.
The doctors said that my corneas had to get replaced because I had really bad
Table 1: Correlations of Risk Measures, Intent to Change, Anxiety, and Fear
1 2 3 4 5 6 7
1. Self-risk ---
2. Other-risk .93** --- 3. Subjective
self-risk
.75** .68** ---
4. Comparative Risk .38** .30** .42** ---
5. Intent to change .41** .38** .51** .13* ---
6. Anxiety .49** .47** .60** .25** .64** ---
7. Fear .23** .23** .27** .04 .37** .44** ---
Figure 1: Transportability 3-way Interaction on Intent to Change
Pair of slopes
t-value for slope difference
p-value for slope
difference
(1) and (2) -2.809 0.005
(1) and (3) -0.305 0.761
(1) and (4) -0.119 0.905
(2) and (3) 0.231 0.817
(2) and (4) 0.447 0.655
(3) and (4) 1.150 0.251
1 2 3 4 5 6 7
Low Transportation High Transportation
Int ent t o C ha ng e
Transportability and Intent to Change
(1) High Risk, High Transportability
(2) High Risk, Low Transportability
(3) Low Risk, High Transportability
Figure 2: Subjective Numeracy 3-way Interaction on Self-risk
Pair of slopes
t-value for slope difference
p-value for slope
difference
(1) and (2) -0.107 0.915
(1) and (3) -1.242 0.216
(1) and (4) 0.680 0.497
(2) and (3) -1.107 0.270
(2) and (4) 0.738 0.462
(3) and (4) 1.934 0.054
0 5 10 15 20 25 30 35
Low Risk High Risk
S
el
f-ri
sk
Subjective Numeracy and Self-risk
(1) High Transp, High Subjective Numeracy
(2) High Transp, Low Subjective Numeracy
(3) Low Transp, High Subjective Numeracy
Figure 3: Subjective Numeracy 2-way Interaction with Risk Condition on Other-risk
t-value of simple slope: -0.838 p-value of simple slope: 0.403
0 5 10 15 20 25 30 35
Low Risk High Risk
O
th
er
-ri
sk
Subjective Numeracy + Risk Condition on Other-Risk
Low
SubjNumeracy
High
Figure 4: Subjective Numeracy 2-way Interaction with Transportation Condition on Other-risk
t-value of simple slope: -1.785 p-value of simple slope: 0.076
1 6 11 16 21 26 31
Low Trans High Trans
O
th
er
-ri
sk
Subjective Numeracy + Transportation Condition on
Other-risk
Low
SubjNumeracy
High
Figure 5: Subjective Numeracy 3-way Interaction on Comparative Risk
Pair of slopes
t-value for slope difference
p-value for slope
difference
(1) and (2) -2.485 0.014
(1) and (3) -2.147 0.033
(1) and (4) -0.286 0.775
(2) and (3) 0.641 0.522
(2) and (4) 2.284 0.023
(3) and (4) 1.834 0.068
1 2 3 4 5 6 7
Low Risk High Risk
C om p ar at ive R is k
Subjective Numeracy and Comparative Risk
(1) High Transp, High Subjective Numeracy
(2) High Transp, Low Subjective Numeracy
(3) Low Transp, High Subjective Numeracy