I. Abstract
Background: Several studies have investigated the relationship between body mass index (BMI) and falling; however, the results have been inconclusive. We are not aware of another study that has investigated the relationship between recent BMI change and the risk of falling in the elderly.
Purpose:The purpose of the present study was to investigate the association of BMI and BMI change with the risk of falling in independent living persons over the age of 65.
Methods: Data are from a cohort of 396 independent living residents of Carol Woods Retirement Community over the age of 65. Baseline measurements were taken in 2014 and 2015. The cohort was followed from January 1st, 2016 through December 31st, 2016 and examined for occurrence of falls. The incidence rate of new falls in the population was determined and the associations between falls and BMI, BMI change, and other covariates were examined utilizing Cox proportional hazards models.
Results: There were 54 reported falls in 2016 (13.6%). The incidence rate of falls was 1.24 falls per hundred people per month. There was no statistically significant association between baseline BMI and the risk of falling. A one unit increase in BMI in the previous year was shown to decrease the hazard of experiencing a fall by 51.4% (^HR
=0.486[0.349,0.675]).
Conclusions: A recent decrease in BMI is significantly associated with a higher risk of falling in independent living residents of Carol Woods Retirement Community.
II. Introduction
cause of injury-related death globally, resulting in an annual estimated 646,000 deaths [1]. Falls
are especially detrimental to the elderly population, representing the leading cause of injuries and
death [2]. Among people age 65 and older, falls are more likely to result in injury, death, or a
loss of independence [1,2]. Additionally, falls are more prevalent among the elderly than among
other age groups. In the U.S., approximately 33% of people over age 65 are reported to fall
annually [3].
Falls are a common cause of injury among the independent-living residents of Carol Woods
Retirement Community. Additionally, many Carol Woods residents self-report that they gain
weight within their first year of living at Carol Woods. The purpose of this study was to
investigate whether BMI and BMI change are associated with the risk of falling in the Carol
Woods Retirement Community population, and thus gain a better understanding of factors
related to falls among the elderly.
Body mass index (BMI) is a ratio that describes relative weight for height in kg/m2. BMI
does not directly measure body fat, but studies have shown that BMI is moderately correlated
with total body fat percentage [4]. The National Institutes of Health recommends for BMI to be
used in a clinical setting to assess overweight and obesity classifications [4]. Overweight and
obesity classifications are known to be associated with a plethora of health risks, including
higher morbidity for hypertension, type 2 diabetes, coronary heart disease, strokes, and some
types of cancer [4]. However, BMI in the elderly (age 65 or greater) has been shown to have
either a neutral or negative association with mortality, a situation Oreopoulos et al. dub the
“obesity paradox” [5].
Prior research has found mixed results regarding the potential association between weight
carried out the NSW Falls Prevention Baseline Survey in a sample of 5,681 participants age 65
or older with a private telephone who were residing in a household in New South Wales [6]. This
survey investigated various risk factors for falls utilizing computer assisted telephone
interviewing [6Results showed that a significantly higher proportion of individuals who
self-reported a fall were obese; however, the study did not find a significant association between
individuals categorized as overweight and the occurrence of a fall [6]. The NSW study used
self-reported height, weight and falls in the analysis [6].
A study by Handrigan et al. examined the sex-specific association between obesity and self-reported falls among community-dwelling Canadians age 65 and older [7]. The study sample included 6399 men and 9461 women [7]. A larger percentage of women in the study population reported a fall (21.7%) than men (16.9%) [7]. Additionally, obesity in men had a significant association with higher odds of falling, whereas obesity in women was not shown to be associated with higher odds of falling [7].
A 1988 study by Tinetti et al. investigated risk factors for falls among elderly persons living in a community [8]. They utilized a prospective cohort design with a sample of 336 participants age 75 and older [8]. The sample was taken from eligible participants in the 2,328 participants in the Yale Health and Aging Project [8]. Data was collected through an initial clinical evaluation, home evaluation, and bimonthly phone calls [8]. Identified fall incidences were self-reported [8]. They found no significant association between BMI and the risk of falling, but did find that medication use, especially use of sedatives, was significantly associated with a higher risk of falling [8].
association between BMI and risk of fall occurrence, while other have found no association. Most of these studies utilized self-reported rather than measured weight and fall occurrence, and a cross-sectional rather than cohort study design. There does not seem to currently be consensus in the scientific community about the association between BMI and fall risk. Additionally, we could not find a prior study that examined the potential association between recent BMI change and fall risk, and we are not aware of any other studies that used survival analysis to test the association between falls in the elderly and BMI. The primary purpose of this study was to investigate the potential association between BMI and fall risk, as well as between recent BMI change and fall risk.
III. Methods
a. Study Population
This study used a prospective cohort study design, and was conducted at Carol Woods
Retirement Community in Chapel Hill, NC. The cohort (n=396) consisted of all independent
living persons aged 65 or older at the Carol Woods Retirement Community in Chapel Hill, NC,
as of January 1st, 2016. Baseline measurements of predictor variables and potential confounders
were collected using participants’ last measurements in 2015. Weight measurements were also
collected in the calendar year 2014, to determine BMI change from 2014 to 2015. Follow up for
new occurrences of the falls continued through December 31st, 2016.
b. Definition of Outcome and Predictor Variables
The outcome variable was defined as the occurrence of a fall during the study follow-up
period. All Carol Woods residents experiencing a fall are instructed to immediately report the
fall to Carol Woods clinic staff. Carol Woods provided an unidentified data set, which included
The primary predictor, BMI, was calculated using the participant’s last weight and height
measurements of 2015 and 2014. We calculated BMI as BMI=weight(lb)
{height(¿)}2×703, in accordance
with the CDC’s mathematical definition of BMI [9]. In addition, BMI was categorized following
CDC BMI classifications [9]. BMI change was calculated by subtracting the BMI calculated
using the participant’s last measured weight in 2014 from the BMI calculated the participant’s
last measured weight in 2015. The age of each participant as of January 1, 2016 was calculated
using the participant’s birth date.
Covariates included sex, systolic blood pressure, pulse, number of medications,
osteoporosis diagnosis, and diabetes diagnosis. Carol Woods provided unidentified relevant data
for all independent living residents from the closest possible date in the calendar year 2015 to
January 1st, 2016. These data were taken from Carol Woods electronic medical records database,
which contains a medical record for each resident.
c. Survival Data
Survival time was calculated as the number of days between January 1st, 2016 and the event of a first fall. The survival time for residents not experiencing a fall during the follow-up period was considered censored on December 31st, 2016, and thus survival time was calculated as the number of days between January 1st, 2016 and December 31st, 2016. Survival time served as the outcome variable for the survival analysis.
d. Statistical Analysis
population was calculated as IR=new occurrences of falls
person−months at risk . The person-months at risk for the cohort was calculated as the sum of the collected survival time for each participant. The
incidence rate can be interpreted as the number of new cases of falls in the study population per month.
Prior to estimating the association between BMI and the risk of falling, the age-adjusted interaction of BMI and sex on the risk of falling was investigated via Cox proportional hazards regression. The interaction was found to not be statistically significant (p=0.1181), so subsequent analyses were not stratified by sex. Frequency in percentages is reported for categorical
variables, and means and standard deviations are reported for continuous variables.
The categorical variables relevant to this study include sex, age category, systolic blood pressure category, BMI category, diabetes diagnosis, and osteoporosis diagnosis. Age category was grouped as 65 to 74 years, 75 to 84 years, 85 to 94 years, and greater than 94 years. BMI
category was created following CDC BMI classifications [9]. Systolic blood pressure category
was derived using American Heart Association classifications [10]. The differences in fall
frequencies across categories was investigated using the X2 test for each categorical variable. Relative risk and 95% confidence intervals were calculated for categorical variables with two categories to give a measure of the relative change in fall risk from one category to the other.
The continuous variables relevant to this study include age, BMI, BMI change, pulse, number of medications, and systolic blood pressure. The difference in means for each continuous variable between participants who fell and those who did not was investigated using a 2-tailed
t-test for the difference of means.
Cox proportional hazards regression was used to carry out the analysis of the potential
significant confounding by covariates, four Cox models were fit. The outcome variable of time to
fall was the same in all the models. The potential confounders included sex, age, systolic blood
pressure, pulse, number of medications, osteoporosis diagnosis, and diabetes diagnosis. Two
models contained BMI as the primary predictor, one adjusted for age and sex, and another
adjusted for age, sex, systolic blood pressure, pulse, number of medications, osteoporosis
diagnosis, and diabetes diagnosis. Two additional models contained BMI change as the primary
predictor, one adjusted for age and sex, and another adjusted for age, sex, systolic blood
pressure, pulse, number of medications, osteoporosis diagnosis, and diabetes diagnosis.
The two models for each primary predictor were compared to evaluate potential
confounding by systolic blood pressure, pulse, number of medications, osteoporosis diagnosis,
and diabetes diagnosis on the relationship of BMI and BMI change with falls in our study
population. We used 10% as the cut-off for confounding, so covariates that yielded an adjusted hazard ratio that was 10% or greater different from crude hazard ratio were considered
confounders. If confounding by systolic blood pressure, pulse, number of medications, osteoporosis diagnosis, and diabetes diagnosis was not determined to be significant, the most
precise (smallest 95% confidence interval) model for the primary predictor was used.
IV. Results
-0.02(1.09). Most of the study participants had BMIs categorized as normal or overweight. There were 74 underweight members of the study population and 49 obese members of the study population.
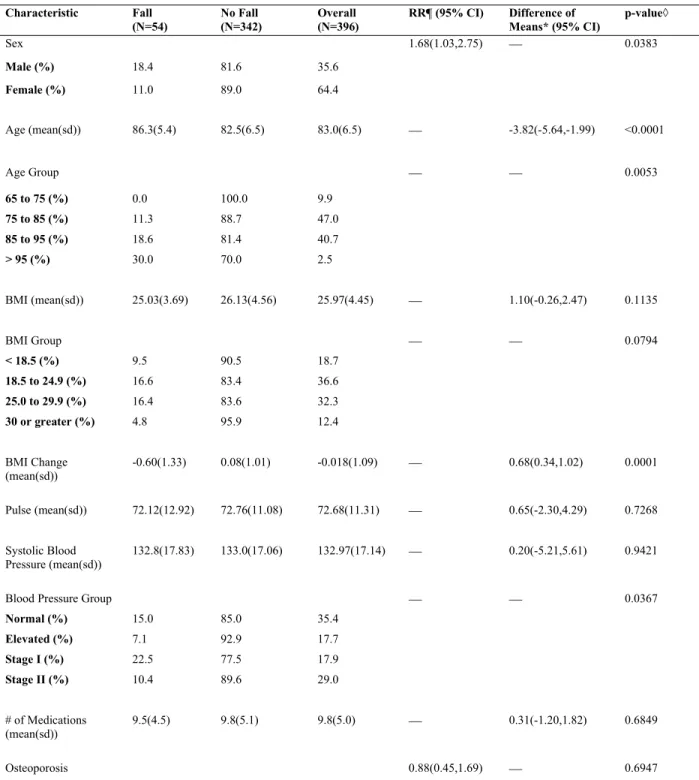
Characteristics of the study participants by fall status are shown in Table 1. The occurrence of a fall was significantly associated with sex, age, blood pressure group, and BMI change. The average age of individuals who fell over the course of the study (86.3 years) was older than the average age of individuals who did not fall (82.5 years). The relative risk of falling for males relative to females was 1.68(1.03, 2.75). Individuals with a systolic blood pressure categorized as Stage I hypertension were most likely to fall. The average BMI change in participants experiencing a fall was a decrease in BMI, whereas in the group of participants who did not experience a fall the average BMI change was an increase.
The average survival time for males was 323.3(8.2) days and the average survival time for females was 341.2(4.8) days. The average survival time for those who experienced a decrease in BMI from 2014 to 2015 was 317.4(5.8), while the average survival time for those whose BMI
Table 1. Characteristics of Study Participants by Fall Status
Characteristic Fall (N=54) No Fall (N=342) Overall (N=396)
RR¶ (95% CI) Difference of Means* (95% CI)
p-value◊
Sex 1.68(1.03,2.75) 0.0383
Male (%) 18.4 81.6 35.6
Female (%) 11.0 89.0 64.4
Age (mean(sd)) 86.3(5.4) 82.5(6.5) 83.0(6.5) -3.82(-5.64,-1.99) <0.0001
Age Group 0.0053
65 to 75 (%) 0.0 100.0 9.9
75 to 85 (%) 11.3 88.7 47.0
85 to 95 (%) 18.6 81.4 40.7
> 95 (%) 30.0 70.0 2.5
BMI (mean(sd)) 25.03(3.69) 26.13(4.56) 25.97(4.45) 1.10(-0.26,2.47) 0.1135
BMI Group 0.0794
< 18.5 (%) 9.5 90.5 18.7
18.5 to 24.9 (%) 16.6 83.4 36.6
25.0 to 29.9 (%) 16.4 83.6 32.3
30 or greater (%) 4.8 95.9 12.4
BMI Change
(mean(sd)) -0.60(1.33) 0.08(1.01) -0.018(1.09) 0.68(0.34,1.02) 0.0001
Pulse (mean(sd)) 72.12(12.92) 72.76(11.08) 72.68(11.31) 0.65(-2.30,4.29) 0.7268
Systolic Blood Pressure (mean(sd))
132.8(17.83) 133.0(17.06) 132.97(17.14) 0.20(-5.21,5.61) 0.9421
Blood Pressure Group 0.0367
Normal (%) 15.0 85.0 35.4
Elevated (%) 7.1 92.9 17.7
Stage I (%) 22.5 77.5 17.9
Stage II (%) 10.4 89.6 29.0
# of Medications (mean(sd))
9.5(4.5) 9.8(5.1) 9.8(5.0) 0.31(-1.20,1.82) 0.6849
Diagnosed (%) 15.3 84.7 85.1
Not Diagnosed (%) 13.4 86.6 14.9
Diabetes‡ 1.19(0.40,3.57) 0.7171
Diagnosed (%) 11.5 88.5 6.6
Not Diagnosed (%) 13.8 86.2 93.4 * Difference of means of no fall group minus fall group
¶ Relative risk of a fall in males/females, not diagnosed/diagnosed
◊ X2or Fisher exact test used for categorical variables; 2-tailed t-test of the difference of means used for continuous variables ‡ Fisher exact test used
either remained the same or increased was 344.5(5.7) days. Thus, females survived longer on average than males and those who did not experience a decrease in BMI from 2014 to 2015 survived longer on average than those who did. Figures 1, 2, and 3 show the Kaplan-Meier survival curves stratified by baseline BMI, gender, and the nature of BMI change, respectively.
Figure 2. This plot shows the Kaplan-Meier (KM) curves for males and females. The KM curve for females is consistently higher than the KM curve for males. This figure illustrates that females have a better survival prognosis (survival= no incidence of a fall) than males.
Cox proportional hazards regression was utilized to investigate the possible effect of the predictor variables, BMI and BMI change, on survival time, while considering potential
confounding by sex, age, pulse, systolic blood pressure, number of medications, diabetes diagnosis, and osteoporosis diagnosis. There was not determined to be meaningful confounding on the association of BMI and fall occurrence by the covariates because the estimated hazard ratios for BMI in the crude and adjusted models did not differ by greater than 10%. Thus, the Cox model with BMI as the primary predictor was adjusted only for sex and age to obtain the more precise 95% confidence interval for the hazard ratio. There was determined to be
meaningful confounding on the association of BMI change and fall occurrence by the covariates as the estimated hazard ratios for BMI change in the crude and adjusted models differed by greater than 10%. Thus, the Cox model with BMI change as the primary predictor was adjusted for sex, age, pulse, systolic blood pressure, number of medications, diabetes diagnosis, and osteoporosis diagnosis.
As shown in Table 2, BMI was not found to have a statistically significant effect on fall incidence because the confidence interval for the hazard ratio contained the null value of one ( ^
HR=0.954 [0.887,1.027]). However, a statistically significant hazard ratio was obtained for the effect of BMI change on fall incidence because the confidence interval did not include the null value of one. A one unit increase in BMI change was associated with a 51.4% decrease in the hazard of falling (^HR=0.486).
Table 2. Adjusted hazard ratios and associated 95% confidence intervals for BMI and BMI change as risk factors for the occurrence of falls in independent living persons at Carol Woods Retirement Community over the age of 65
VARIABLE HAZARD RATIO 95% HAZARD
RATIO CI
BMI* 0.954 (0.887,1.027) BMI Change¶ 0.486 (0.349,0.675)
*BMI adjusted for sex and age; No. of observations=330
V. Discussion
Falls in the elderly are a multifaceted problem stemming from a multitude of different risk factors. The results from this study show that, in the elderly (65 or older) population of
independent living residents of Carol Woods Retirement Community, BMI change and age are significantly associated with the risk of falling. In particular, an increase in age and a recent decrease in BMI were shown to significantly increase the risk of falling in the study population.
While the effect of BMI on fall incidence was not statistically significant, a higher BMI (^HR =0.954 [0.887,1.027]) had a slight protective effect against falls in the study population. While we cannot reject that fall incidence and BMI may be unrelated, this finding provides slight support for Oreopoulos’s “obesity paradox” described in the introduction.
In independent living residents at Carol Woods, males had 1.68 times the risk of
experiencing a fall compared to females (RR=1.68 [1.03, 2.75]). This finding is opposite of what most prior research has discovered. One reason for the discrepancy may be that males are more likely to need the help of security to get up after a fall, since they are on average heavier and more difficult for a friend or family member to help up on their own. This discrepancy could also be attributed to our rather small and homogenous study population. In addition, this discrepancy could be due to chance.
We have identified that a recent decrease in BMI is significantly associated with a higher risk of falling in independent living residents of Carol Woods retirement community. This
information thus brings about the need to consider the underlying causes of weight loss (and thus BMI decrease) among the elderly population. First, we can divide the reason for weight loss into two categories- intentional and unintentional. In individuals at least 74 years old, a study by Cui et al found the prevalence of intentional weight loss to be 6%, while the prevalence of
unintentional weight loss was 18.8% [11]. These data illustrate that in a population similar to our study population, unintentional weight loss is over double as prevalent as intentional weight loss. Unintentional weight loss can be attributed to several different factors. Some examples of the reasons for unintentional weight loss in the elderly include disease related-issues, medication-related issues, functional issues, intake issues, psychological problems, reduced social activity, and low income [12]. We are uncertain whether the reason for recent weight loss in our
population would be associated with the risk of experiencing a fall. Future research may want to investigate the potential association between the intentionality of recent weight loss and fall occurrence in the community-dwelling elderly population.
VI. Limitations
One major limitation of this study was the low prevalence of falls in the study population. While in the U.S. approximately 33% of individuals over age 65 fall annually, only 13.64% of the individuals in the study population fell between January 1st, 2016 and December 31st, 2016. This low prevalence of falls in the population led to lower than expected power for this study (Table 3). A lower than expected power decreased the likelihood of our study to find a statistically significant relationship between incidence of falls and BMI.
prevalence of falls in the population, incomplete recording of falls at Carol Woods was likely also a factor. The list of falls provided by Carol Woods included falls for which Carol Woods security was called to respond, as residents are instructed to notify Carol Woods security in the case of a fall. However, some residents may have experienced a fall and refrained from notifying Carol Woods security if they were able to get up without the help of Carol Woods staff.
Additionally, residents may not have reported falls that occurred off Carol Woods campus. Because the study was carried out solely at Carol Woods Retirement Community, the results may not be generalizable to the larger elderly community. A more varied study population would be beneficial to make judgments and recommendations regarding the entire independent-living elderly community.
Future studies into a similar topic should attempt to obtain a larger sample size and more robust data for fall incidence to gain greater statistical power and thus a greater likelihood of finding significant results. Additionally, further studies may want to include multiple
independent-living communities to draw inferences about a larger population.
Table 3. Power of Study (n=396) to Detect Different Relative Risks When Prevalence of Falls in the Study Population is 13.64%
Relative Risk 1.8 1.6 1.4 1.2
Power (%) 79.1 56.9 31.1 11.8
VII. Conclusions
We have identified that older individuals and those experiencing a recent weight loss (decrease in BMI) have a significantly increased risk for falls relative to the study population.
VIII. References
1. World Health Organization Media Centre (January 2018) Falls Fact Sheet. World Health Organization. World Health Organization Fact Sheets.
http://www.who.int/mediacentre/factsheets/fs344/en/. Accessed 25 January 2018.
2. Centers for Disease Control and Prevention (September 2016) Falls Are Leading Cause of Injury and Death in Older Americans. U.S. Department of Health and Human
Services. CDC Newsroom. https://www.cdc.gov/media/releases/2016/p0922-older-adult-falls.html. Accessed 25 January 2018.
3. Himes CL, Reynolds SL (2012). Effect of obesity on falls, injury, and disability. J Am Geriatr Soc 60(1):124-129. doi: 10.1111/j.1532-5415.2011.03767.
4. NHLBI (1998). Clinical Guidelines on the Identification, Evaluation, and Treatment of Overweight and Obesity in Adults: The Evidence Report.
http://www.nhlbi.nih.gov/guidelines/obesity/ob_gdlns.pdf. Accessed 1 February 2018.
5. Oreopoulos, A., et al. (2009). The Obesity Paradox in the Elderly: Potential Mechanisms
and Clinical Implications. Clin Geriatr Med 25: 643-659. doi:
10.1016/j.cger.2009.07.005.
6. Centre for Health Advancement and Centre for Epidemiology and Research (2009). New South Wales Falls Prevention Baseline Survey. NSW Department of Health.
http://www.health.nsw.gov.au/surveys/other/Publications/falls-prevention-survey.pdf.
Accessed 3 February 2018.
7. Handrigan, GA et al. (2017). Sex-specific association between obesity and self-reported falls and injuries among community-dwelling Canadians aged 65 years and older.
8. Tinetti ME, Speechley M, Ginter SF (1988). Risk factors for falls among elderly persons living in the community. N Engl J Med 319(26): 1701-1707. doi:
10.1056/NEJM198812293192604.
9. Division of Nutrition, Physical Activity, and Obesity, National Center for Chronic Disease Prevention and Health Promotion (August 2017). U.S. Department of Health and Human Services. Centers for Disease Control and Prevention Healthy Weight About Adult BMI. https://www.cdc.gov/healthyweight/assessing/bmi/adult_bmi/index.html. Accessed 6 February 2018.
10. American Heart Association (November 2017). American Heart Association. Understanding Blood Pressure Readings: Know Your Numbers.
http://www.heart.org/HEARTORG/Conditions/HighBloodPressure/KnowYourNumbers/
Understanding-Blood-Pressure-Readings_UCM_301764_Article.jsp#.WsJKrZPwYXp.
Accessed 6 February 2018.
11. Cai J, Cui Z, Stevens J. Associations of demographics, smoking, and weight status with intentionality of weight loss.