This analysis compares communities in Luzeme County, Pennsylvania that are using variable rate pricing systems to finance solid waste management activities to those
using other financing methods. Communities are compared on demographic and waste management system attributes. Driving factors behind the decision to adopt variable rates are also explored. Results of the analysis indicate that communities using
variable rates exercise a higher level of control over solid waste collection, have higher median family incomes, are more urban, have higher populations of retired
I wish to express heartfelt thanks to Paul Crissman of the North Carolina Department of Environment, Health, and Natural Resources' Solid Waste Section for allowing me the latitude in my grant to conduct this research. I also would like to thank my advisor. Prof. Richard Andrews, and Prof. Michael Berry for their strong guidance in designing this research project. I thank Prof. Michael Luger for his insight into this particular case study and his keen eye as a reviewer. His comments and suggestions greatly strengthened this paper. I also wish to thank my good friend Kate Stovel for
LIST OF FIGURES... vi
LIST OF TABLES... vii
Introduction ... 1
Part I... 4
Waste Generation ... 4
The Waste Stream... 4
Reducing the Waste Stream ... 5
The Solid Waste 'Crisis' ... 8
The Root of the 'Crisis'... 9
Government Response... 10
Revenue Generation Alternatives for SWM... 11
Pre-Disposal Charges ... 11
Property Tax Based Financing ... 12
Direct Charges ... 13
Flat Fees ... 13
Point of Disposal Financing... 14
Tipping Fees ... 15
Unit Bases Pricing ... 15
Volume Based Programs... 16
Weight Based Programs... 17
Rationale for UBP... 18
Economic Efficiency ... 18
Equity... 19
Ensuring Revenues/Generating Additional Revenues... 20
Resource Conservation... 20
Public Health and Aesthetics ... 22
Education... 22
Improved Program Information/Control ... 23
Flow Control ... 23
EPA Endorsement... 24
Cost Reduction... 25
Elements of a Successful Program ... 25
Effects of Unit Based Pricing... 26
Household and Waste Management System Decisions... 26
Positive Effects of Unit Based Pricing ... 27
Negative Effects of UBP ... 27
Illegal Waste Diversion... 27
Excessive Compaction... 30
Revenue Imbalances ... 31
Study Design and Methodology... 34
Site selection ... 34
Data Sources ... 36
Census data ... 36
1992 County Waste Management Report... 36
Telephone Interview/Questionnaire for Borough Managers . . 37
Data Analysis and Results ... 39
Quantitative Data: Selection of Variables for Analysis... 39
Comparison of Means... 39
Expert Opinion... 42
Statistical Model... 42
Statistical Analysis: Results and Discussion ... 44
Qualitative Data Results and Discussion... 51
Conclusions ... 55
Further Study ... 58
SELECTED BIBLIOGRAPHY... 61
APPENDIX A: Information Extracted from the 1990 Census ... 63
APPENDIX B: Local Government Manager Questionnaire... 64
LIST OF FIGURES
Figure 1 :Breakdown of the US Municipal Solid Waste Stream, 1986. Source:
Franklin Associates, "Characterization of MSW in the US, 1960 to 2000," 1988.
Figure 2: Waste Prevention and Materials Management in the Context of Materials Use. Source: Office of Technology Assessment, "Facing America's Trash, What's Next for Municipal Solid Waste?" Washington, D.C., 1989: p.8.
Figure 3: Household Solid Waste Flows. Source: U.S. Environmental Protection Agency, "Charging Households for Waste Collection and Disposal: The Effects of Weight or Volume-Based Pricing on Solid Waste Management," Washington, D.C., 1990.
Figure 4: Waste Management System Solid waste Flows. Source: U.S. Environmental Protection Agency, "Charging Households for Waste Collection and
Disposal: The Effects of Weight or Volume-Based Pricing on Solid Waste Management," Washington, D.C., 1990.
Figure 5: Basic influence diagram for waste management financing decision making.
Figure 6: Path diagram for solid waste management financing through unit based pricing observed in Luzeme County, Pennsylvania.
Figure 7: Level of Control over Solid Waste Management Collection for UBP and Non-UBP Communities Observed in Luzeme County, Pennsylvania.
Figure 8: 1990 Age Distribution in UBP and Non-UBP Communities in Luzeme County, Pennsylvania.
Figure 9: Communities Using UBP for Solid Waste Financing, Year of Program
Implementation, and Non-Respondents to the 1992 County Recycling Survey
LIST OF TABLES
Table 1: Results of the 1992 Luzeme County Recycling and Waste Management Survey.
Table 2: Results of Means Comparisons Between UBP and Non-UBP Communities.
Table 3: Local Government Manager Questionnaire Results for UBP Communities in
In response to increasing solid waste management costs resulting from widespread adoption of waste reduction programs, landfill siting difficulties, and increased landfill performance criteria, local governments are faced with the need to increase revenues for solid waste management and encourage waste reduction where possible. One method of increasing revenues is through the use of unit based pricing (UBP) for solid waste collection and disposal. In addition to generating needed revenues, this method of financing economically signals system users to reduce wastes by directiy charging them some portion of the marginal cost of waste management. The incentive to reduce waste may result in beneficial activities such as source reduction, reuse, recycling, and composting or alternatively may result in detrimental actions such as illegal dumping. As a result of variations in program implementation and enforcement levels as well as community characteristics, illegal waste diversion levels may be high
enough to fully offset any program advantages.
This analysis examines communities in Luzeme County, Pennsylvania that are using UBP and compares them to those that are using other methods to finance waste
management. Communities are compared on demographic, waste management, and
local government characteristics. The results of questionnaires and telephone interviews with local government managers are also used in the analysis.
Results of the analysis indicate that the level of local government control over solid waste collection and median family income are direcdy related to the existence of a UBP program. The percentage of the population over 60 years of age, existence of a recycling program, and percent of the population urban in an urban area as defined by the 1990 US Census are secondary factors indirectly related to the existence of UBP program through the level of local government control over municipal solid waste collection. These results suggest that UBP programs are more feasible in urban areas where the local government is directly involved in solid waste management activities.
questionnaire results also suggest the existence of a progression in financing methods
Waste Generation
By merely existing, we generate waste. At the most primitive level of human
existence, waste includes cooking ash, broken utensils, and clothing scraps. In modem industrialized nations, waste includes materials from several sources including the residential and commercial sectors, agriculture, mining, manufacturing, construction, and pollution control equipment [Menell, 1990]. This technical report focuses on residential waste, a part of the municipal solid waste stream.
The municipal solid waste stream is the result of a complex assembly of decisions beginning with raw materials extraction and including manufacturing, consumer, waste processing and disposal decisions. Consumers affect the waste stream through
consumption decisions and their choice of waste management alternatives. The residential consumer may reduce at the source, reuse, recycle, compost, combust or dispose of potential waste materials.
The Waste Stream
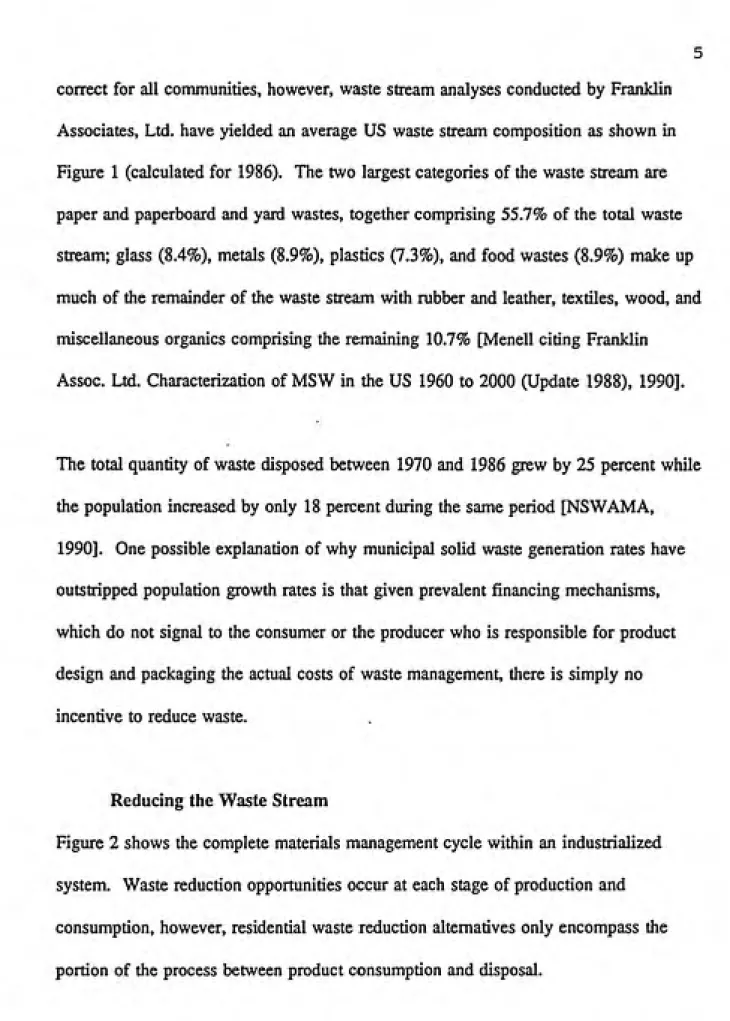
correct for all communities, however, waste stream analyses conducted by Franklin Associates, Ltd. have yielded an average US waste stream composition as shown in Figure 1 (calculated for 1986). The two largest categories of the waste stream are paper and paperboard and yard wastes, together comprising 55.7% of the total waste stream; glass (8.4%), metals (8.9%), plastics (7.3%), and food wastes (8.9%) make up much of the remainder of the waste stream with rubber and leather, textiles, wood, and
miscellaneous organics comprising the remaining 10.7% [Menell citing Franklin Assoc. Ltd. Characterization of MSW in the US 1960 to 2000 (Update 1988), 1990].
The total quantity of waste disposed between 1970 and 1986 grew by 25 percent while the population increased by only 18 percent during the same period [NSWAMA, 1990]. One possible explanation of why municipal solid waste generation rates have outstripped population growth rates is that given prevalent financing mechanisms, which do not signal to the consumer or the producer who is responsible for product design and packaging the actual costs of waste management, there is simply no
incentive to reduce waste. .
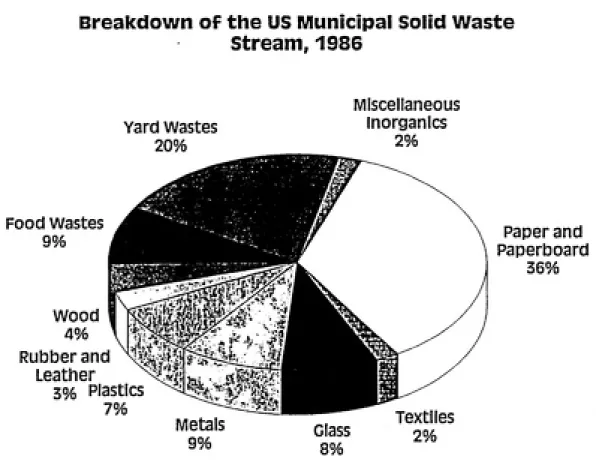
Reducing the Waste Stream
Breakdown of the US Municipal Solid Waste Stream, 1986
Yard wastes 20%
Miscellaneous
Inorganics
2%
Food Wastes 9%
Wood
4%
Rubber and Leather
30/0 Plastics 7%
Paper and Paperboard
36%
Metals
9%
Class
8%
Textiles 2%
decisions 10 minimiie amount and loxiciiy of MSW and to increase use
ol recyciaote products Products
Processing and manu/ac:ufing
MOdiiying design ot
aroducts ro mmimiie
amouni and loxtcily ol
MSW and 10 improve
product recyciaoility
^m^
Secondary materials /vasie maienats
segregated Oy source Hype and degree ol
seoaraiion oepanas on local conailionsi Source separation FUllened cans Hazardous waste management (desiruclion. Uisoosail Uensifitfd mastics Com post
Paoef Cans, jars
oodles Mixed waste Housenoid a£aroou3 wdsie dated oaeer Solid rasiduss Incineraiton Soiio residues LandfiMing Energy recovery Intermediate processing
P'OCeSSrnfj 10 prepare
(ecovered maie,pais (or oiar'-ets
Remaining cotnousiiOle
'Tiaieriais can oe incinerated lo recover
«nefqy
Remaining unusaole
materials wtii ne
landfiltea. wiin 'neihane
recovery •^rtiin
.ipmopfiai*
Rgure 2: Waste Prevention and Materials Management in the Context of Materials Use. Source: Office of Technology Assessment,
Over the past 15 years, solid waste management has surfaced as one of the most
problematic environmental issues in the country. Municipal solid waste landfills,
virtually unregulated for many decades, comprise many of the nation's Superfund sites because they were the only receptacles for hazardous wastes for many years. Landfills pose a threat to groundwater and are associated with odor problems, fires, and
proliferation of disease vectors. As a result, landfill siting has become one of the most visible and violently debated facility siting issues in the nation [See several sources, esp. Menell, 1990].
The days of the unregulated 'dump' responsible for so many of these environmental problems are virtually gone in this country. Landfill performance criteria have
tightened at both the state and federal level over the past three decades, culminating in
the current, highly restrictive federal regulations. By April 1994, landfills will be
required to have liners and leachate collection systems. Landfill closeout criteria will
also be more stringent, requiring caps and groundwater monitoring for an indefinite period. These regulations will not affect all landfills because they contain provisions
A direct result of increased concern about landfilling and the environment has been an increase in municipal recycling across United States, but the resulting flood of
recycled materials in the market has decreased their value to the point that many municipalities find themselves paying to get rid of the separated materials, thus incurring a further financial burden. Recyclable collection can also be a significant added expense in a government's solid waste program, especially when recyclable
collection services are offered at the same level as solid waste collection [Powell, 1993].
These three factors - increased recycling, costiy landfill performance criteria and lengthy siting processes - have resulted in solid waste management costs increasing in the municipal budget at unprecedented rates. Given these dramatic changes, many local governments now view solid waste management capacity as a critical issue
[Montavon, 1990].
The Root of the 'Crisis'
The problem at the root of the current solid waste 'crisis' is that the costs of solid waste management are largely hidden. In a free market economy, consumer choice for products and packaging is driven directiy by product cost and thus indirectly by
product design. When the incremental costs of waste management are not directly
experienced by the consumer, there is no economic incentive to alter product and
incentive to preferentially reuse, recycle or compost wastes that could otherwise
simply be discarded in the general waste stream. In fact, in cases where consumers do
not directly experience the incremental costs of disposal, they characteristically prefer
products with higher levels of packaging because of the increase in convenience,
perceived safety against tampering and reduced risk of breakage [Menell, 1990]. As a
result, the manufacturing sector receives no signal to reduce the environmental impacts
associated with disposal of its products [Menell, 1990].
Government Response
State and federal governments have responded to the solid waste crisis in several
ways. In 1988, the EPA set a national goal of achieving 25% source reduction and
recycling by 1992. Over 40 states have passed similar waste reduction and recycling
goals or mandates [Scarlett, 1993]. Landfill disposal bans have increased on materials
including yard wastes, batteries, and white goods. Packaging bans and bottle bills
have also gained in popularity. These policies, however, are not adequate to address
the underlying problems associated with the 'throwaway ethic' because they do not
deal with the distorted economic incentives that drive consumer and manufacturing
decisions [Menell, 1990]. Furthermore, targeting specific materials for bans does not
ensure that environmentally superior alternatives will be chosen.
system that perfectly charged the consumer would correct the market distortion previously discussed. Such a system would result in consumers economizing on disposal costs, as they do now on consumption costs and the revenues could be used to pay for the residual costs imposed on the disposal system. The transaction costs of such a system, however, would be prohibitive [See esp. Menell, 1990 and Kraten,
1990].
Pre-disposal taxes have been another alternative instituted in many states. Taxes are levied on materials including tires, car batteries, beverage containers, unrecycled newsprint, petroleum products, new motor vehicles, etc [Montavon, 1990].
Pre-disposal taxes can be effective at economically signalling the consumer, however, unless all substitute products have a similar pre-disposal tax, the consumer may not choose the environmentally preferable product.
Revenue Generation Alternatives for Solid Waste Management
Revenues for solid waste management may be generated at the point of disposal, at the
point of product purchase via special fees, or through the general tax base.^ Charges
for waste management may be levied directiy or through the property tax system. This section provides a brief overview of each of these options.
Pre-Disposal Charges
Pre-disposal charges are charges levied at the time of product purchase. These charges
already exist for a variety of items such as tires and white goods. The revenues from
the special charge or tax are used to finance management of these products once they enter the waste stream. In my research, I have not come across any pre-disposal
charges at the local level, perhaps because the authority to levy such charges does not
generally exist at this level.
Property Tax Based Financing
Revenues may also be generated from the general property tax base. A portion of the
tax revenues in the general fund is used for solid waste activities including collection,
recycling, disposal, education, enforcement, and other activities. My research in the spring of 1993 indicates that approximately 35% of counties in North Carolina
currently finance solid waste management entirely through the tax base and virtually
all of the remaining 65% that charge directly subsidize solid waste operations from the
general fund for direct and/or indirect costs.
Under a tax-based system, residents receive a given level of solid waste services
regardless of the amount or type of wastes they dispose, thus, waste disposal is
marginally "free" to everyone. The problem with this type of system is that it does
encourage waste reduction, nor does it signal the true disposal costs of otherwise
equivalent products.
Property tax based financing is also less equitable than other financing methods.
Waste disposal is not a function of property value, rather it is a function of the
number of people living on the property, their ages, economic status, and whether they
participate in waste reduction activities.
Finally, property tax based financing results in solid waste costs competing with the
costs of schools, police and fire protection, libraries, parks, health clinics and other
services. As solid waste management costs increase, the only alternatives under this system are to decrease other services or increase property taxes, neither of which is desirable.
Direct Charges
The use of direct charges has been increasing in this country for several years [Montz,
1987]. Direct charges may take the form of flat fees or unit based pricing. A discussion of various direct charging options follows.
Flat Fees
Flat fees are one method of waste management financing that is gaining in popularity.
solid waste services. These fees may take many forms. In North Carolina, collection
fees, use fees or availability fees are all authorized for local governments [Campbell,
1992]. To the resident, however, there is little or no difference between these types of
fees.
At this time, flat fees are widely used in North Carolina. My research indicates that
approximately 64 of the 100 counties in the state have implemented flat fees at this
time ranging from $12 to $180 per year. These charges are generally included on the
annual county tax bill and payment is generally non-negotiable unless a private waste
management company is under contract to the resident for collection services.
Unlike property taxes, flat fees are relatively easy to adjust as costs fluctuate and can
alleviate strain on the tax base. However, this method, like the property tax method,
does not signal the marginal costs of waste disposal to the user, and therefore does not
encourage waste reduction. It is also inequitable because the flat fee is charged on a
residential unit or household basis, regardless of the number of persons residing at the
address.Point of Disposal Financing
landfill, would be more expensive to dispose of than a plastic bag, which is inert in a landfill. Such a system is not feasible at this time, and would likely suffer from prohibitive transaction costs [Kraten, 1990]. Feasible point of disposal financing
alternatives do exist, however, with low transaction costs.
Tipping Fees
Tipping fees are commonly used for waste management financing. Tipping fees may be charged at landfills or waste collection and transfer stations and charges may be per ton or per load, the latter of which can vary by vehicle size and type. Residents living in areas where solid waste collection services are provided by private or public waste hauling services do not directiy experience tipping fees for general household waste: instead, the haulers direcdy experience these costs and may choose to pass them on to the customer through the general fund or through either flat or variable direct charges. As a result, unless residents haul their own waste, they may only indirectly experience this type of point of disposal financing and may not receive an economic signal to reduce waste generation. Other types of point of disposal financing, however, do consistently provide a marginal economic signal system users.
Unit Based Pricing
Another feasible method of point of disposal financing is unit-based pricing. In
pound of material disposed. Economic signalling occurs with this method of financing for each incremental unit of waste disposed: the smaller the increment, the better the signaling. When paired with alternatives to disposal such as recycling and yard waste collection, this method can result in significant waste reduction. Even in the absence of recycling or yard waste disposal alternatives, customers in UBP programs practice some level of waste reduction [Bonini and Tolbert, 1993].
Volume Based Programs
Volume based systems for UBP include per can, bag and tag and window sticker programs. Per can systems, such as that used in Seattle, charge customers based on the number and size of cans of garbage disposed each collection day. There is generally a variable subscription rate designed to suit individual needs, for example, one system user may subscribe to one 13 gallon can while another subscribes to two 33 gallon cans. Any additional garbage must be in specially purchased bags, or have special stickers affixed. The Seatde program currently distributes stickers for extra bags through grocery and convenience stores or via mail at a highly deterrent price of $5.00 per sticker. Billing under such a system may be monthly, quarterly or annually and the subscription level may be changed by the customer.
community, bags or stickers may be distributed by the municipality or at convenience stores and supermarkets.
House sticker programs involve the purchase of a sticker that is placed on the
resident's house which entities the resident to a specific amount of garbage collection
per collection day. For example, stickers may be purchased entiding the customer to
1, 2, or 3 bags. Any additional garbage must be put in specially purchased bags or
tagged with specially purchased stickers. House stickers are generally purchased once
annually from the municipality and last for one year.
All of these volume-based programs are widely used at this time. The east coast
seems to have more bag and tag systems, while the west seems to be partial to per can
systems [Morris, 1993]. Benefits and problems associated with these systems will be
discussed later in this section.
Weight Based Programs
Weight based programs charge each customer by the weight of garbage disposed as
opposed to volume. This necessitates weighing each can or bag collected and billing
households regularly, resulting in high program implementation costs. The incentive
to reduce waste in this system is aimed at reducing heavier wastes, such as paper,
glass, and organics, through purchasing decisions, recycling, composting or use of a
signalled to the consumer to be less important to recycle or otherwise reduce in the waste stream. Thus, the weight reduction incentive does not necessarily encourage
consumption of the most environmentally protective products, just the lightest.
Additionally, there is a stronger incentive to recycle or illegally dump heavier materials in this system, when in most markets, lighter materials like aluminum and specific plastic resins are more valuable. One final criticism of the weight based system is that landfills do not fill up by weight, they fill by volume.
Rationale for UBP
Several reasons may be cited for the adoption of a UBP program for municipal solid waste financing. The primary reasons include economic efficiency, equity, resource conservation, generation of additional funds, and ensuring revenues. Less frequentiy cited reasons include improving public health and aesthetic appeal, improved
information for the solid waste management authority, and education.
Economic Efficiency
For any good or service, unit-based pricing with prices set at the marginal cost of
service is necessary for economic efficiency. However, it is possible to have a UBP
Most programs do not charge for all costs of MSW managemenL Not only are system costs high, but externalities associated with waste management, such as groundwater contamination, are not priced in the market. If system costs are extremely high, pricing at the full marginal cost would also increase the incentive to illegally reduce wastes. Based on the experience of UBP programs in this country, pricing at the full marginal cost does not seem necessary to encourage legal waste reduction and ensure adequate revenues.
Equity
Vertical equity, however, is generally absent from programs. As a result, UBP programs are normally regressive. One possible explanation of this is that local government managers appear to value horizontal equity more highly than verticle equity. The same regressivity is present in most other direct charge for service situations such as water and sewer, gas, and electricity unless 'circuit breakers,' such as lower rates for low income or elderly users, are in place.
Ensuring Revenues/Generating Additional Revenues
When the costs of solid waste management increase, generating additional revenues from a direct charging program, such as UBP, can be much easier than cutting other competing programs or increasing property taxes. Indeed, cutting basic programs or increasing property taxes can be tantamount to political suicide for many elected officials. Instituting a direct charge is therefore one way to avoid the turbulent issue of property taxes while taking in additional revenues. UBP programs also serve to ensure revenues because program revenues are designated for solid waste management. This alleviates the continual struggle between solid waste costs and other programs supported by the general fund.
Resource Conservation
life of the landfill. Source reduction, reuse, and recycling can all result in conservation of raw material and energy inputs.
A materials balance identity depicts the flow of municipal solid wastes: TW = D + SR + RU + RC + C + I
Where:
TW = total waste generated; D = amount disposed;
SR = amount reduced at the source; RU = amount reused;
RC = amount recycled;
C = amount composted and yard wastes processed; and
I = amount illegally diverted by burning, littering, or otherwise discarded [adapted from EPA, Charging..., 1990].
Generally, source reduction results in the greatest savings of resources and recycling in
the least of the three waste reduction alternatives. It should be noted that while these
waste reduction techniques result in resource conservation, none guarantees reduction in the toxicity of the waste stream with the possible exception of source reduction.
Composting and yard waste processing also results in conservation of resources by reducing the amount of waste destined for landfilUng, reducing leachate formation in the landfill because of the putrescible nature of the waste diverted, and by proving mulches and soil enhancing outputs.
Conservation of landfill space resulting from waste diversion is also a form of
resource conservation. Indeed, given the vast increase in landfill tipping fees over the past two decades and increased difficulty in facility siting, existing landfills appear to
be a very valuable resource.
Public Health and Aesthetics
Education
UBP programs educate the public because they force decision making regarding
alternatives to solid waste disposal. System users must determine what can be
composted, reused, recycled, and make decisions based on this information while
deciding which products to consume. It thereby helps to educate the population on solid waste problem while empowering them by giving them control over the decision making process and rewarding them financially for waste stream diversion.
Improved Program Information/Control
Implementation of a UBP program necessitates stricter accounting and control of
program costs than simple tax based or flat rate financing. UBP programs also result in better information about waste flows. Information from more rigorous accounting
of costs, revenues, and waste flows can be used to improve the waste management program, including instituting additional costs savings [EPA, Charging...,1990].
Flow Control
Solid waste flow control is currently the subject of heated debate in the solid waste management industry. In essence, this is because the public sector sees flow control as a critical component to integrated waste management, while the private sector sees it as impeding competition and infringing on its rights [Matar, 1992]. Because of the
disparity of these views, there have been numerous court cases on solid waste flow
control, primarily dealing with charges of violating the Commerce Clause of the United States Constitution.
It is possible for local governments to utilize flow control methods other than banning
export of wastes from or importation to their jurisdiction, either of which would likely invoke a finding of Commerce Clause violation if evaluated in a court of law. The basic idea behind flow control is gaining control of the waste stream. One way to achieve a higher degree of control is to require resident participation in a UBP program. Requiring participation necessitates that residents utilize the collection
system offered by the municipality thereby giving control of the waste stream to the
municipality
EPA Endorsement
The EPA has virtually endorsed UBP programs in at least two documents. "Charging
Households for Waste Collection: The Effects of Weight- of Volume-Based Pricing on Solid Waste Management" and "Disposal and Variable Rates in Solid Waste:
very positively on UBP. The Variable Rates handbook states under a section titled,
"Will it pay/Can we afford it?" referring to variable rates, that, "The question is
whether you can afford not to do it!" While unusual, this type of overt endorsement
in a federal document contributes strongly to the rationale for adopting such a system.
Cost Reduction
The potential of cost reduction has made UBP programs very attractive for some
communities. Cost reductions can come from reduced collection costs because of
reduced wastes destined for disposal. When waste generation rates decrease,
collection routes can be expanded with fewer trips to the transfer station or landfill
and personnel can be decreased. Cost savings also occur at the landfill because less waste is disposed [EPA, Charging..., 1990].
Elements of a Successful Program
UBP programs can vary in success as a result their design, fee structure, enforcement of illegal dumping provisions, education, etc. The following factors are cited as elements of a successful program:
• ongoing public education;
• distribution of waste reduction information;
• enforceable weight limits on bags or cans;
• pricing structure suitable to generate revenues and promote waste reduction, but not so high as to overly promote illegal dumping;
• readily available alternatives to disposal;
• easily obtained bags or stickers(for bag/tag programs);
• easily implemented and efficient billing system (for per can programs); and • easily implemented cost accounting programs [see several sources, esp. Becker,
1991].
Although the above list is lengthy, most of these factors are elemental for an efficient and effective solid waste management program. The critical difference lies in the implementation of the UBP program and enforcement of illegal waste disposal.
Effects of Unit Based Pricing
UBP has several very positive effects, as discussed in earlier sections of this report, however, it also has many negative side effects. This section will addresses decision making at the household and municipal level for solid waste management and briefly recap the positive attributes and introduce the negative effects of a UBP program.
Household and Waste Management System Decisions
UBP programs necessitate household decision making for waste management to a
decisions are made. Residents make source reduction decisions when purchasing materials; reuse decisions when purchasing or considering disposal; and recycling
decisions are made at the point product purchase based on packaging and at the point
of waste separation for disposal or recycling. After disposal, decisions include
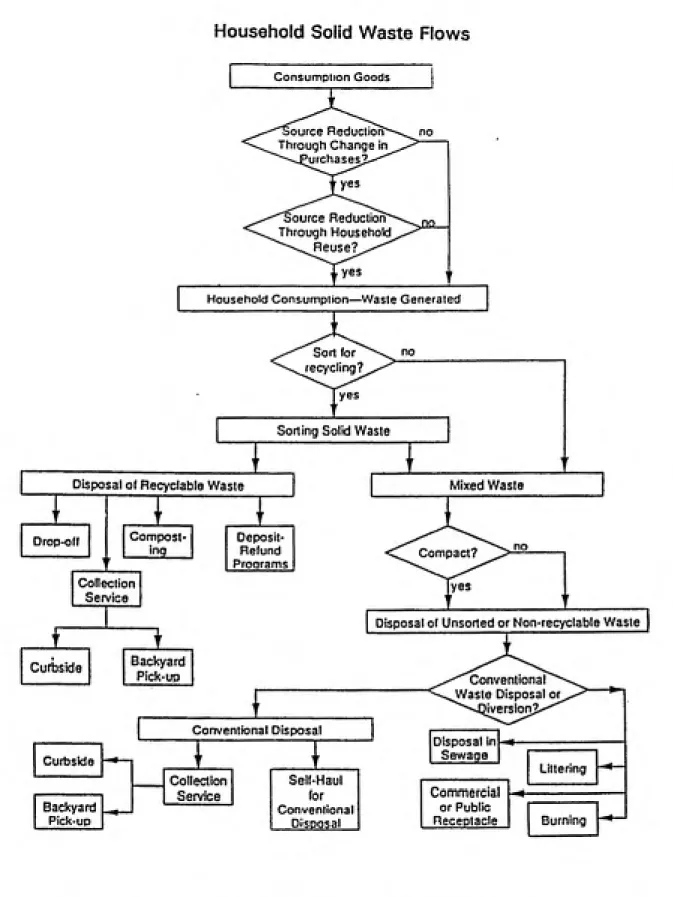
compaction and conventional disposal or illegal disposal. Figure 3 depicts the flow of solid wastes through the household and decisions made at the household level.
Waste managers also make several decisions including the following: whether to offer
a recycling program; whether recycling collection will be curbside or drop-off;
management of non-recyclable such as yard waste; management of special waste such as scrap tires and white goods; whether to incinerate wastes prior to landfilling; whether to provide collection directiy or contract for services, etc. Figure 4 depicts the waste flow chart on which these decision-making processes are based.
Positive Effects of Unit Based Pricing
Positive impacts of UBP programs have been discussed in earlier sections of this report and include source reduction, reuse, recycling, composting, education, increased economic efficiency, landfill space conservation, improved program information and
can include improved public health, cost reduction and flow control.
Consumption Goods
ource Reduction
Through Change in
urchases?
Source Reduction
Through Household
Reuse?
Household Consumption—Wasle Generated
Sorting Solid Waste
Disposal of Recyclablo Waste
Drop-off Compost-inq Mixed Waste Deposit-Refund Programs Collection Service Compact?
Disposal of Unsorted or Non-recyclable Wasle
Cufbside Backyard
Pick-up Conventional
J(Vaste Disposal or^
Diversion?' Conventional Disposal Curbside Backyard Pick-up Collection Service Disposal in Sewage Self-Haul for Conventional Disposal Commercial or Public Receptacle Littering Burning
Figure 3: Household Solid Waste Flows. Source: U.S. Environmental Protection Agency,
"Charging Households for Waste Collection and Disposal: The Effects of Weight or
Waste Management System Solid Waste Flows
curbsid*
flscyclablo Waste
Curbsids Collodion
Rscyclables other
than Yard Waste
Recyclablss
Processed,
Ready for
Market
Rscyclable and Non-recyclabio
Waste Goneralod Hscycl Sal Prices Service Conditions lor Conventional Disposal Sol PncBS Service Condilions lor Recycling Curbside Service, Drop-oil Center. Bolh dropoK Recyclable Waste DroD-otf Collection Further Separation by Collection Personnel? Yard Waste Compost Center Wood Chipper Non-rscyclable Waste Transfer Station?
RocyclaUa Materials Markets
ͣ ͣ' '' '' '
Glass Paper Plastic Mntal Olhof
ͣ ' 1ͣ
Lsnctfill Indntrttor
Figure 4: Waste Management System Solid waste Flows. Source: U.S. Environmental Protection Agency, "Charging Households for Waste Collection and Disposal: The Effects of Weight or Volume-Based Pricing on Solid Waste Management,"
UBP can result in many negative effects, most notably, illegal disposal. The marginal cost signalling which produces the positive effects of source reduction, reuse, recycling and composting, also encourages illegal waste diversion. Illegal waste diversion can take several forms including littering, illegal dumping, abuse of commercial dumpsters and apartment dumpsters (classified as theft of service), burning of waste and abuse of charitable contribution drop-of sites [Goldberg, 1990].
Excessive illegal dumping can pose a significant public health threat at worst, and is an eyesore at best. Enforcement of provisions against illegal dumping are therefore important. Depending on characteristics of the land and local government enforcement capabilities enforcing dumping provisions and cleaning up persistent dumping sites can offset any gains made by implementing a UBP program.
Excessive Compaction
One drawback to the volume based systems is that trash compaction may be used to minimize the volume of waste placed at the curb instead of other waste reduction techniques. Excessive compaction can increase the weight of bags substantially, resulting in increased risk of solid waste collection personnel injury. It also
sale of electric trash compactors in the area. In order to combat over compaction, some programs have instituted a weight limit per bag, however, enforcement of this limit is problematic. As with many other issues, public education is the most productive approach [Becker, 1991].
Revenue Imbalances
An attractive feature of UBP systems is that revenues generated are linked to the amount of waste disposed. A problem arises, however, when recycling rates increase, perhaps due to additional materials being added to the recycling program, and disposal rates stay the same or drop because of diversion to recycling. Recycling is expensive. Many communities must pay wholesalers to accept their separated recyclable. As a result, when recycling rates increase, costs increase and if revenues from disposal do not also increase, additional subsidies from the general fund or program price
increases will be necessary.
The same scenario holds true for yard waste collection and processing. Even when processed yard wastes are sold to the community or public operations as mulch, revenues rarely match costs of collection and shredding. As a result, program
Statement of Purpose and Preliminary Research Question
In Part I of this document, several reasons were given supporting the adopting a UBP
program. In addition, many potential negative side effects were presented. Some
negative side effects, like illegal dumping, can be so severe as to offset any benefits of
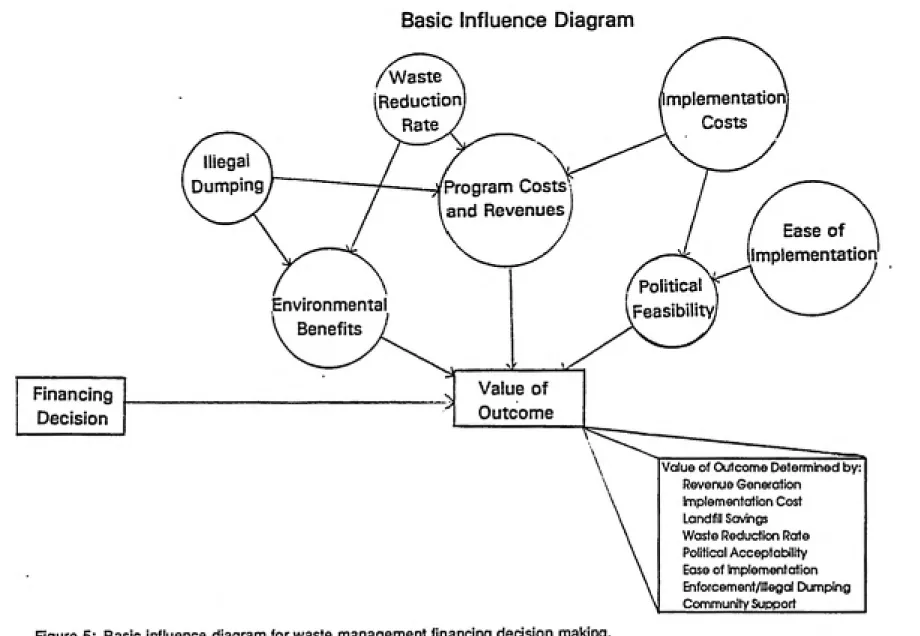
UBP program adoption.An influence diagram exhibiting the uncertainty of solid waste management financing
decisions is shown in Figure 5. The outcome of the financing program can be evaluated in terms of revenue generation, implementation cost, landfill savings, waste reduction rate, political acceptability, ease of implementation, enforcement/illegal
dumping and community support. Given the relatively large uncertainty inherent in
adopting a UBP program as compared to low levels of uncertainty in other activities
implemented at the local government level, it is interesting that over 1000
communities in the United States have faced these risks and adopted a UBP program
[Skumatz, 1993]. These observations lead to the basic research question in this
analysis which is:
Financing
Decision
/Waste
Implementation Costs Reduction
Ihegai
Dumping Program Costs i
and Revenues
Ease of
Implementation
I Political
Feasibility
Environmental Benefits
Value of Outcome
Value of Outcome Determined by:
Revenue Generation
Implementation Cost Landfill Savings
Waste Reduction Rote
Political Acceptability Ease of Implementation
Enforcement/Illegal Dumping
Community Support__________
A primary consequence of this research is that its results will add to the foundation of
knowledge regarding factors that may influence solid waste management financing
decision making. This research will also illustrate the ways in which fundamental
differences in communities result in different waste management financing needs and
shed light on which types of differences may be important factors in this process.
Study Design and Methodology
Site selection
This research project addresses the basic research question through a case study of
Luzeme County, Pennsylvania. Luzeme County is located in eastern Pennsylvania,
approximately 50 miles west of the New Jersey boarder. The county's largest city is
Wilkes-Barre, situated within the high population density Wyoming Valley, which
occupies the Northeastern comer of the county. As of March, 1993, 75 municipalities
made up the county, 10 of which have UBP programs.
Luzeme county was chosen primarily because of the high number of UBP programs
within the county. Luzeme County was also chosen because it has already
experienced significant increases in landfill tipping fees because of landfill closures
and importation of wastes from neighboring high population density areas, including
New Jersey, where landfill space has been at a premium for some time. Because
disposal costs associated with increased federal landfill performance criteria, Luzeme
County's response to these pressure may also represent glimpse into the future.
Selection of Luzeme county resulted in avoiding potential confounding factors because
all 75 municipalities fall under the same county waste management plan which
necessitates use of one prescribed landfill. The plan requires that all wastes be
disposed in the Keystone Landfill, located roughly 5 mUes outside the north eastem
edge of the county, near Scranton, Pennsylvania. The county has entered into a
contract with the landfill operator which has set 1993 tipping fees for Luzeme county
waste at is $52 per ton. As a result of this arrangement, variations in tipping fee costs
are controlled for. The study is further strengthened because it entails a survey of the
entire county, or statistical population, and thereby avoids the considerable weakness
random sampling would lend to addressing this research question.
In interpreting the results and their applicability to other communities, it is important
to note that Luzeme County is not representative of much of the United States. The
age distiibution in the county is slightiy skewed toward the older population and
educational attainment is lower than the US average with only 13.1% of the population
having 16 or more years of schooling compared to the national average of 20.3%
[Slater and Hall, 1993]. The county average personal income of $16,405 is also lower
Data Sources
Data were collected through the 1990 census, the 1992 County Recycling and Waste Management Survey, and via direct questionnaire administered via telephone to local government managers or their assistants.
Census data
Census data were collected from the 1990 census results. The factors extracted from
the census are identified in Appendix 1. Variables were selected based on their potential to affect waste management financing decisions and their ability to indicate differences in community characteristics.
1992 County Waste Management Report
Luzeme County's Solid Waste Management program conducts an annual survey on recycling and municipal solid waste management. The questionnaire requests
information on waste landfilled, materials recycled, leaf composting, per bag collection
fees, and waste collection method.
These data are limited because the reporting level on the county recycling report was
not at 100 percent. Several attempts were made to contact the five communities that
failed to respond, however, four of the five of them have not responded to multiple
telephone messages and do not appear to have full time government administrative
Because the non-respondent communities have populations that are rural, non-farm, as
defined by the 1990 Census, have very low populations ranging from 1990 levels of
242 in Penn Lake Park to 1,159 in Slocum, do not have staff to answer telephones and
do not return messages, it is assumed that the municipal staffing level is minimal and
that solid waste service levels provided by the municipality were therefore also at a
minimum. These municipalities were assigned waste management information at the
lowest level (i.e., no control of hauling, no leaf program and no recycling program) for
the correlation table, means testing, tolerance testing and the logistical model.
Tabulated results of the survey broken down by program and non-program
municipalities are presented in Table 1. The non-respondent communities are Buck
Township, Nescopeck Township, Penn Lake Park Borough, and Slocum Township.
Telephone Interview/Questionnaire for Borough Managers
A questionnaire was developed for municipal managers aimed at eliciting information
about the specific factors that resulted in the adoption of a UBP program. The
questionnaire focussed primarily on the major sources of cost increases associated with
solid waste services and if and how community members influenced the decision
process. Information on budgeting, the level of services provided by the public works
department, landfill used before Keystone, influence of proximity to other UBP
programs and general respondent information were also collected under the assumption
that the following factors might contribute to the decision to adopt a UBP program:
Name § Si o t § o
••-. o
(J 1
A.
c o o o15
Recycling Program
Name
1
gs 3 15 1 S o o -1 w c o ͣ p o ͣ q U To (D _I o (t c!
Ashley B. No f 0 0 Nescopeck T. * - No 3 0 0
Boar Creek T. No 3 0 1 New Columbus B. No 3 0 0
Black Creek T. No 3 0 0 Newport T. No 2 0 0
BuckT.* No 3 0 0 Nuangola B. No 2 1 1
Butler T. No 3 0 0 Penn Lake Park B.* No 3 0 0
Conyngham B. No 3 0 0 Pittston C. No 2 0 1
Conyngham T. No 3 0 0 Pittston T. No 2 0 1
Courtdale B. No 3 0 0 Plymouth B. No 3 0 1
Dallas B. No 2 1 1 Plymouth T. No 3 0 0
Dallas T. No 2 1 1 Pringle B. No 1 0 1
Dennison T. No 3 0 0 Rice T. No 3 0 1
Dorrance T. No 3 0 1 Ross T. No 3 0 0
Exeter B. No 2 0 1 Salem T. No 3 0 0
Exeter T. No 3 0 0 Schickshinny B. No 3 0 0
Fairview T. No 3 1 0 Sugarloaf T. No 3 0 0
Farimount T. No 3 0 0 Slooum T.* No 3 0 0
Forty Fort B. No 3 0 1 Sugar Notch B. No 2 0 0
Foster T. No 3 0 0 Union T. No 3 0 0
Franklin T. No 3 0 0 Warrior Run B. No 2 0 0
Freeland No 2 0 1 West Hazleton B. No 1 1
Hanover T. No 1 0 1 West Pittston B. No 3 1
Harveys Lake B. No 2 0 1 West Wyoming B. No 2 0 0
Hazia T. No 2 0 0 White Haven B. No 2 0
Hazleton C. No 2 1 1 Wilkes-Barre C. No 1 1
Hollenback T. No 3 0 0 Wilkes-Barre T. No 2 1 0
Hughestown B. No 2 0 1 Wright T. No 3 1
Hunlock T. No 3 0 0 Wyoming B. No 3 1
Huntington T. No 3 0 0 Avoca B. Yes 2 0 0
Jackson T. No 3 0 1 Dupont B. Yes 1 0
Jeddo B. No 3 0 0 Duryea B. Yes 1 0
Kingston B. No 1 1 1 Edwardsviile B. Yes 1 0
Kingston T. No 2 1 1 Jenkins T. Yes 1 0
Lake T. No 3 0 1 Laflin B. Ym 2 0
Laurel Run B. No 3 0 0 Larkeville B. Yes 2 0
Lehman T. No 3 0 0 Plains T. Yes 1 0
Luzerne B. No 2 0 1 Swoyersville B. Yes 1 0
Nanticote C. No 1 1 1 Yatesville B. Yes 1 0
Nescopeck B. No 3 0 0
* Level of control over MSW hauling is ranked from 1 to 3. 1 is the highest level of control, whereby the municipality provides services directly, 2 indicates the municipality contracts for services, and 3 indicates the municipality exercises no control over MSW collection. * Responses are coded 0 and 1: 0 indicates no program, 1 indicates a program exists. * Asterisked communities did not respond to the survey: information assumed.
• direct charging for other services (such as water and sewer);
• involvement in solid waste collection;
• use of a specific landfill prior to the county mandated switch to Keystone
landfill;
• public pressure to adopt such a system; • proximity to an existing system; and • cost increases.
The existence of recycling and leaf management programs were also assumed to be possible contributors and these data were obtained from the county recycling report A copy of the questionnaire is presented in Appendix 2.
Data Analysis and Results
Quantitative Data: Selection of Variables for Analysis
Quantitative data were primarily generated from the census information and 1992 county recycling report. A summary of the two variable selection methods for modeling are presented below.
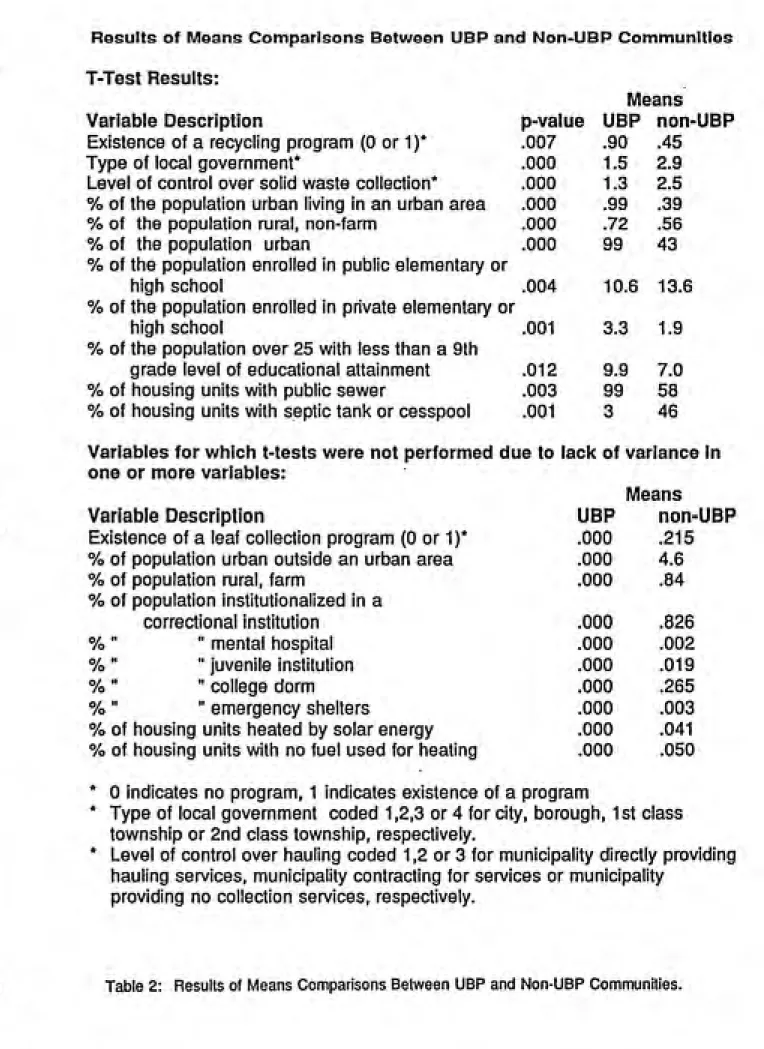
Comparison of Means
an age distribution skewed to the higher ages. UBP communities also tend to be
boroughs rather than cities or townships. Enrollment in private schools is significantly
different, however, because it is probably not a variable that contributes to the
outcome, rather it is likely a proxy for other variables such as the percentage of the
population that is Roman Catholic or the number of children in a household, it was not selected for this analysis. The means testing also shows that educational attainment levels in the UBP areas are lower than those in non-UBP communities. Findings that the percentage of housing units in UBP areas with public or private water source or
public sewer is higher than in non-UBP areas is consistent with the findings that UBP
areas are more urban as is the finding that more housing units use septic tanks or cesspools in non-UBP areas.
Because there was no variance in one group for some variables, t-tests were not computed, however, these results are significant and are also presented in the Table. None of the UBP communities had leaf collection programs, while 14 of the non-UBP programs reported they had programs in the 1992 county recycling report. Non-UBP communities had a much higher average percentage of their populations in rural, non-farm areas, while the UBP communities were primarily urban in an urban area. The
percentage of the population in institutions in UBP communities is zero for
correctional institutions, mental hospitals and juvenile institutions, college dorms, or
o,
Means
p-value UBP non-UBP
.007 .90 .45
.000 1.5 2.9
.000 1.3 2.5
.000 .99 .39
.000 .72 .56
.000 99 43
.012 9.9 7.0
.003 99 58
.001 3 46
T-Test Results:
Variable Description
Existence of a recycling program (0 or 1)* Type of local government*
Level of control over solid waste collection*
% of the population urban living in an urban area
% of the population rural, non-farm
'/o of the population urban
% of the population enrolled in public elementary or
high school .004 10.6 13.6 % of the population enrolled in private elementary or
high school .001 3.3 1.9 % of the population over 25 with less than a 9th
grade level of educational attainment % of housing units with public sewer
% of housing units with septic tank or cesspool
Variables for which t-tests were not performed due to lack of variance in one or more variables:
Means
Variable Description
Existence of a leaf collection program (0 or 1)*
% of population urban outside an urban area % of population rural, farm
% of population institutionalized in a
correctional institution
% " " mental hospital '/o " " juvenile institution Yo " " college dorm
Vo " " emergency shelters
Yo of housing units heated by solar energy Vo of housing units with no fuel used for heating
0 indicates no program, 1 indicates existence of a program
Type of local government coded 1,2,3 or 4 for city, borough, 1st class township or 2nd class township, respectively.
Level of control over hauling coded 1,2 or 3 for municipality directly providing hauling services, municipality contracting for services or municipality
providing no collection services, respectively.
Table 2: Results of Means Comparisons Between UBP and Non-UBP Communities.
percentage of housing units using solar energy or no fuel for heating is zero in UBP
communities and very near zero for other communities.
Expert Opinion
Statistically significant differences in the means between the two groups does not
provide all information necessary for variable selection in this analysis for two
reasons. First, degrees of freedom are limited because there are only 10 UBP
communities, and thus it is more difficult to obtain significant differences between
group means than it would be given a larger sample. Second, comparison of means
alone can mask certain effects, as is seen in this case with median family income. It
is therefore necessary to also use expert judgment in selecting variables which were
considered likely to contribute significantly to an explanatory model of UBP program
adoption.
Statistical Model
Nonlinear regression was chosen for the statistical analysis because the dependant
variables are dichotomous or binary: either a municipality has a UBP program or it
does not. Several options exist for dichotomous regression, however, probit or logit
regression are the most reasonable choices because, in this analysis, the variable errors
yield essentially the same results [Aldrich and Nelson, 1984]. Logit analysis,
specifically, was chosen for this analysis because it is one of the best understood and most commonly used alternatives to linear probability models for dichotomous dependant variables and because it offers the added opportunity to calculate log odds [Aldrich and Nelson, 1984].
One assumption of logit modeling is that there is no exact linear dependance among the independent variables [Aldrich and Nelson, 1984]. To ensure this, correlation tables were run on all variables. Where two variables were found to be strongly correlated, only one was used in developing the model. Multicollinearity was also tested on all model variables using tolerance testing. (See Appendix 3 for results.)
In logistical regression, no norm exists for summary measures, such as R^ used in
linear regression. Although various pseudo R^ measures have been developed, Aldrich
and Nelson suggest extreme caution in using them or simply avoiding them
completely. As a result, they are not used in this paper. Instead, because the primary goal of this research is to generate a predictive model, maintaining a significant overall model and model variables as well as maximizing the predictive value of the model, as shown in the "classification table" of the regression output, were the primary focus of the logistical regression model development.
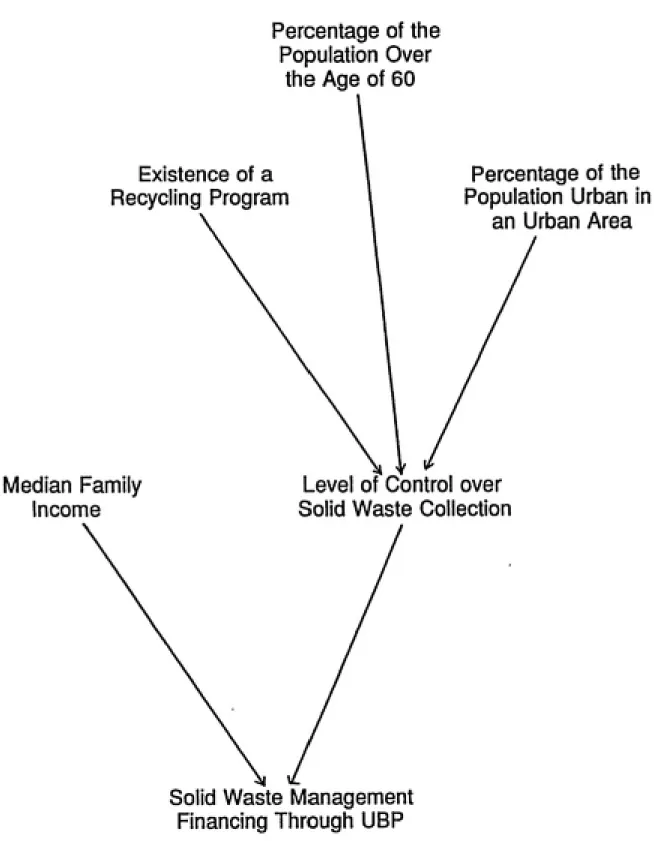
Logistical regression on UBP programs in the 75 municipalities studied generated a model with 95% predictive power using two variables: median family income and local government control over solid waste collection services. A two stage path model was developed for the collection variable using percentage of the population over the age of 60, presence of a recycling program and percentage of the population urban in an urban area as the predictors of level of control over solid waste collection. (See Figure 6.) Output of the logistical regression are located in Appendix 3. The five variables that were used to generate the model and postulated reasons behind their strong predictive power are presented below.
Variable: Median family income
(not statistically significantiy different for UBP communities ($32,559) and non-UBP communities ($31,246) in t-test)
Population Over
the Age of 60
Existence of a
Recycling Program
Percentage of the
Population Urban in
an Urban Area
Median Family
Income
Level of Control over Solid Waste Collection
Solid Waste Management
Financing Through UBP
Figure 6: Path diagram for solid waste management financing through unit based pricing
percentage of the disposable income of working members of the community and that
UBP programs would financially benefit older populations who generate less waste per
capita.
Variable: Level of control over waste collection (Higher in UBP communities)
The local government's level of control over waste collection was the strongest
variable in predicting the existence of a UBP program. (See Figure 7 and Appendix
3.) Provision of collection services, either directly or indirectly through contract to
private haulers, indicates involvement in waste management at the most basic level.
Local governments that do not provide any collection services are not involved in
waste management, and therefore not involved in waste management financing
decisions. It follows then that local governments that do not provide collection
services will not have UBP programs, which is what we observe in Luzeme County.
If one accepts this line of reasoning, it seems self evident that level of control over
collection would be a strong predictor of the existence of a UBP program and that as a
result, further exploration of this variable is indicated.
Because this variable is a likely proxy for many community characteristics, another
Percentage of
Communities
Variable Rate Communities non-Variable Rate
Communities
low =
med
high
Municipality does not provide or contract for collection services: residents arrange for collection directly with private haulers or haul their own waste.
Municipality contracts for collection services.
Municipality provides solid waste collection services directly.
Figure 7: Level of Control over Solid Waste Management Collection for UBP and Non-UBP
program. None of these variables significantiy contribute to the model when used to
directiy predict the existence of a UBP program. (See Appendix 3.)
Variable: % of population urban in an urban area
(higher in UBP communities)
Higher population densities are associated with increasing levels of solid waste
services, including curbside collection and waste reduction programs. In contrast, rural
area solid waste hauling and recycling is more frequently the responsibility of the
residential population. As a result, waste management financing is less of a concern
in rural areas where there is less likely to be waste management programs
implemented at the local government level and, as a result, UBP considerations are
unlikely to become an issue.
Higher population densities also decrease the likelihood that illegal dumping and trash
burning will be used as waste reduction alternatives and the high population density
increases the ease of enforcing against violators.
Variable: % of population 60 years of age or more
(higher in UBP communities)
25
20
15 f
10
5
-1-11
%age %age 12-
22-21 29
30-39
%age %aQe 40-
50-49 59
%age
60-64
%age
65-up
UBPcommunities non-UBP communtities
Figure 8: 1990 Age Distribution in UBP and Non-UBP Communities in Luzerne County,
contributes to the model is that proportionately large retired populations on fixed incomes can exert significant political pressure on local governments to minimize their direct service costs, including those associated with solid waste management. These populations also lobby to keep property taxes down, increasing the political feasibility of a UBP program.
Large populations of retired citizens are cited by local government managers as a
driving factor in the decision to adopt UBP programs because they participate in decision-making processes and prefer waste financing mechanisms that reflect their low per capita waste generation rates. Without variable rates, older residents end up subsidizing waste management for younger residents, which have higher per capita waste generation rates. As a result, variable rates for waste collection are very
attractive to older populations.
Variable: Existence of a recycling program
Existence of a recycling program is a strong predictor of the level of control over waste collection. This is presumably because communities that are not involved in
waste collection and transportation, either directiy or via a private contractor, are less
being direct provision of waste collection services, recycling collection and processing, and use of an enterprise fund, those communities that do not provide collection
services are simply farther behind in the waste management continuum waste than their counterparts and would need to experience a higher level of institutional learning before adopting a recycling program.
Qualitative Data Results and Discussion
Qualitative data were collected via questionnaire to borough managers and assistant managers. Results of questionnaire data are presented in Table below.
Program types
are considerably less expensive over the course of a year. In addition, the local
government preferred house stickers because revenue is generated at the beginning of
the year instead of trickling in throughout the year as it does for bag systems. System
selection, therefore, seems to be in response to a variety of local government
preferences, and may not be a reflection of the level of progressiveness of the solid
waste management program in general.
Equity and cost
The two primary factors cited for program adoption are to improve equity and respond
to solid waste management cost increases. Each of these factors was cited by six
communities as a major driving force behind program adoption. Five of the six
respondents that cited equity as a driving factor specifically mentioned increasing
equity for elderly residents on a fixed income as the chief equity concern.
Cost increases were the result of significantly increased tipping fees in aU cases. In
addition, one respondent also cited that the community had recently calculated solid
waste management costs and adopted a UBP program in response to their discovery
that these costs were a large part of the municipal budget.
factor in adopting a UBP system and three of the five cited cost increases. Only one of the five previously using the tax base cited increasing equity as a motivating factor
and two cited costs. See Table 3. Because flat rates and UBP can both be used to
alleviate revenue shortfalls, whereas only variable rate programs may be used to
achieve equity in solid waste financing, this finding suggests a natural progression may exist from property taxes to flat rates to variable rates.
Illegal dumping
Adoption in response to illegal dumping was cited in 2 municipalities, Laflin and Swoyersville. In the case of Laflin, the borough was adjacent to two municipalities with UBP programs at the time they adopted the program. The Borough Secretary stated that the primary reason for adoption was "self defense" against illegal dumping from the adjacent communities. While Swoyersville is not adjacent to any UBP programs administered by neighboring boroughs, many private haulers in the county use a variable rate system to charge their customers and as a result, the waste reduction and diversion pressure can be high even in the absence of a government imposed variable rate program. Swoyersville, therefore, may have experience the same effect it would have had it been adjacent to government administered UBP
Name of Who Provides Current Year Prior Previous Main Reason(s) Proximity
Municipality SW Collection* Program Initiated Financing Landfill for UBP Adoption influence?
Avoca Contract House sticker and bag 1983 Property Ta WA* Equity* No
Dupont IVIunicipality Bag 1991 Flat Fee Empire Equity, Other No
Duryea Municipality House Sticlcer 1987 Fiat Fee Empire Cost, Equity No
Edwardsville Municipality Bag stickers 1988 Property Ta West Side Cost, Equity No
Janldns Municipality House sticker and bag 1989 Property Ta Empire Cost No
Lafiin Contract House sticker and bag 1992 Property Ta N/A* Illegal Dumping Yes
Larksville Contract House sticker and bag stickers 1989 Fiat Fee Empire Cost, Equity, Othw* No
Plains Municipality Bag 1989 Flat Fee Empire Cost, Equity No
Swoyersville Municipality Bag 1989 Flat Fee Empire Illegal Dumping No
Yetesville Municipality House sticker and two 1989 Property Ta Empire Cost No
*AII UBP municipalities provide collection and hauling directly or contract for these services.
*Avoca has been using Keystone for many years.
* Dupont adoption was partially the result of pressure form the property owners' association in
response to the lack of management on the part of the Borough.
* Lafiin had previously contracted to private haulers who may take waste to any landfill. * Larksville adopted the program because they needed to have some waste limit when they
contract to haulers.
and Non-Respondent Communities
Swoyersville, 1989
Duryea, 1987
Avoca, 1983
Dupont, 1991
Yatesvilie, 1989
-Jenkins, 1989 Laflin, 1992 Larksvllle, 1989
Edwardsvllle, 1988 Plains. 1989
Slocum Township
Nescopeck Township "VN
Buck Township' Penn Laks Park Borough*
Non- Respondents to county Recycling Survey
Figure 9: Communities Using UBP for Solid Waste Financing, Year of Program Implementation,
Proximity influence
When asked whether proximity to other UBP programs influenced the decision, only
Laflin responded positively. Given the relative ages of the programs, shown in Table
3 and Figure 9, it is likely that Duryea was also influenced by the program in the
adjacent Avoca Borough.
Based on results of the questionnaire, UBP programs and their ages were plotted on a
map of the county shown in Figure 9. There is a clear clustering effect in the high
population density region of the county. In addition, the UBP programs occupy
physically smaller local govemment divisions than do other programs in the area. The
order of program adoption does not appear to follow a specific pattern, however, the
observation that these programs are limited to the northeastern quadrant of the county
indicates that there may be some type of demonstration effect occurring.
Conclusions
Several conclusions can be drawn from this study: there are differences between UBP
and non-UBP program communities; the reasons given for program adoption suggest
that a progression in financing methods exists; and that special population subgroups
Differences Between Communities
Results of this analysis indicate that Luzeme county communities using UBP as a means of financing solid waste management differ from those using other means to finance waste management. Communities using UBP have the following characteristics which appear to be associated with variable rate adoption: relatively high percentages of persons over 60, slightly higher median family incomes indicating relatively high per-capita incomes in the younger population, they are relatively small geographically, have high percentages of people living in urban areas and tend to be boroughs rather than cities or
townships.
Solid waste management levels also differ between the two groups.
Communities using UBP are more likely to be in direct control of solid waste collection and to have a recycling program than other communities, indicating that communities using UBP are more direcdy involved in solid waste
management processes.
Progression/Evolution in Financing
Findings indicate that movement to UBP from a flat rate system is more likely to be motivated by a desire to increase equity, whereas movement from a property tax based system is more likely to be driven by the need to increase