VIEWPOINTSPAPERS
health
global
Shane M Khan
1, Ilene S
Speizer
2, 3, Kavita Singh
2, 3,
Gustavo Angeles
2, 3, Nana AY
Twum–Danso
2, Pierre Barker
21 Data and Analytics, Division of Data, Research and Policy, United Nations Children’s Fund (UNICEF), New York, New York, USA
2 Department of Maternal and Child Health, Gillings School of Global Public Health, University of North Carolina at Chapel Hill, Chapel Hill, North Carolina, USA
3 Carolina Population Center, University of North Carolina at Chapel Hill, Chapel Hill, North Carolina, USA
Correspondence to:
Shane M. KhanData and Analytics, Data, Research and Policy
United Nations Children’s Fund (UNICEF) New York, NY, USA
Email: [email protected]
Does postnatal care have a role in improving
newborn feeding? A study in 15 sub–Saharan
African countries
Background Breastfeeding is known as a key intervention to improve
newborn health and survival while prelacteal feeds (liquids other than breastmilk within 3 days of birth) represents a departure from optimal feeding practices. Recent programmatic guidelines from the WHO and UNICEF outline the need to improve newborn feeding and points to post-natal care (PNC) as a potential mechanism to do so. This study examines if PNC and type of PNC provider are associated with key newborn feed-ing practices: breastfeedfeed-ing within 1 day and prelacteal feeds.
Methods: We use data from the Demographic and Health Surveys for 15
sub–Saharan African countries to estimate 4 separate pooled, multilevel, logistic regression models to predict the newborn feeding outcomes.
Findings: PNC is significantly associated with increased breastfeeding
within 1day (OR = 1.35, P < 0.001) but is not associated with PLFs (OR = 1.04, P = 0.195). PNC provided by nurses, midwives and untrained health workers is also associated with higher odds of breastfeeding with-in 1 day of birth (OR = 1.39, P < 0.001, (OR = 1.95, P < 0.001) while PNC provided by untrained health workers is associated with increased odds of PLFs (OR = 1.20, P = 0.017).
Conclusions: PNC delivered through customary care may be an effective strategy to improve the breastfeeding within 1 day but not to discourage PLFs. Further analysis should be done to examine how these variables
operate at the country level to produce finer programmatic insight.
Breastfeeding is recognized as a key intervention to improve the health and sur-vival of children and the use of optimal breastfeeding practices such as exclu-sive breastfeeding is one of the most effective means to reduce undernutrition,
an underlying cause of under–five mortality [1]. The World Health
Organiza-tion (WHO) and the United NaOrganiza-tional Children’s Fund (UNICEF) recommend
early initiation of breastfeeding [2] which refers to breastfeeding of a newborn
within an hour of birth. Global monitoring efforts by UNICEF also include ini-tiation of breastfeeding within one day of birth which provides additional in-formation on the feeding patterns of newborns and the behaviors of women.
Early initiation of breastfeeding has a number of health benefits, one of which
is to reduce neonatal mortality [3–5]. The early ingestion of breastmilk can have
positive effects on a newborn’s immune systems such as the provision of
im-munoglobulins and lymphocytes [6–8], priming of the gastrointestinal tract
and decreasing the permeability of the tract to pathogens, including HIV [9,10].
Another health benefit of early initiation of breastfeeding is reduced rates of di
VIEWPOINTS PAPERS
Early initiation of breastfeeding is also associated with a number of factors. One such factor is skin–to–
skin contact with the mother [13,14], a form of thermal care which is a recommended means to reduce
neonatal mortality [15]. Early breastfeeding is also associated with a number of factors related to contact
with the health system. For example, in Brazil, early initiation is associated with vaginal delivery as well
as other factors such as antenatal guidance on breastfeeding and having a full term pregnancy [16].
Oth-er studies point out that breastfeeding within an hour of birth is less likely to occur when women have
caesarian sections, even in the presence of hospital practices that favor breastfeeding [17,18]. In a review
article, authors find that higher socio–economic status is associated with lower odds of breastfeeding ini
-tiation but this pattern is only seen in developing countries [19].
Prelacteal feeds (PLFs) represent a departure from optimal newborn feeding practices. PLFs are any liq-uid other than breast milk that is given to the newborn before breastfeeding is established between the mother and newborn. The WHO and UNICEF outline that for successful breastfeeding, PLFs should be
avoided and PLFs should not be encouraged unless medically indicated [20]. These feeds usually occur
within the first few days of life and are associated with a number of negative health outcomes for the new
-born and mother. These include insufficient maternal milk production, new-born diarrhea and reduced
length of breastfeeding duration [21,22]. PLFs can also expose newborns to infections through the
inges-tion of contaminated food and liquids which can act on the GI tract to increase permeability to pathogens,
and hence, increase newborn infections [9,11].
A number of studies have shown factors related to PLFs. For example, PLFs are negatively associated with
early initiation of breastfeeding (within an hour of birth) [23]. In India, PLFS were associated with lower
maternal education among hospital–delivered infants [24]. However, in rural, Western Uganda, more
educated women were more prone to provide PLFs to newborns [25]. In low socio–economic settlements
in Karachi, Pakistan, PLFs were associated with having a birth attendant [26]. In a national study in
Ne-pal, women without education, who were not working, who had no antenatal care and were first time
mothers were more likely to provide PLFs [27]. Both in India and Vietnam, newborns of women with a
cesarean section were more likely to ingest PLFs [24,28].
In a recent joint statement, the WHO and UNICEF recommend that all newborns, regardless of place of birth (whether in a facility or not), should receive a basic package of care, including postnatal care which includes the promotion and support of exclusive breastfeeding and the early initiation of breastfeeding
[29]. Interventions such as thermal care, hygienic cord care, examination for danger signs and improving parental knowledge of care seeking are also recommended. The evidence on the importance of PNC from developing countries comes mainly from South Asian countries (India, Bangladesh and Pakistan) and are
from interventions and trials at sub–national levels (such as districts, villages and communities) [30–32].
Currently, there is a gap in the literature on how interventions such as PNC are associated with newborn feeding practices at the national level, when delivered through usual services of the government and non– governmental sources of care ie, outside of an intervention setting. The literature is especially sparse for
sub–Saharan Africa. The only study we found was a small, cross–sectional study in Ethiopia [33] where
PNC was associated with increased odds of timely initiation of breastfeeding. Apart from the issue of gen-eralizability of PNC interventions, we currently do not know which type of provider of PNC is best suit-ed to improve the newborn fesuit-eding outcomes. The WHO–UNICEF PNC recommendation acknowlsuit-edg- acknowledg-es that skilled and unskilled health workers can provide PNC though skilled providers are better suited
[29]. However, in the literature on newborn feeding, we find varying opinions on if skilled or unskilled
care can improve breastfeeding. In Bangladesh, for example, specially trained peer counselors can
im-prove initiation and duration of exclusive breastfeeding [34]. However, a literature review finds that trained
health care workers (physicians, nurses etc.) were found to be a barrier to providing quality information,
counseling and care to women on early breastfeeding [19].
VIEWPOINTSPAPERS
METHODS
Data and variables
Data for this study are from the USAID–supported Demographic and Health Surveys (DHS). DHS sur-veys collect data from nationally–representative probability samples of households. Households are
se-lected using a two–stage sample design where census enumeration areas are first sese-lected and then a ran
-dom sample of households is selected in the second stage. Within selected households, all women ages 15–49 are interviewed and provide information on themselves and their children on various health, pop-ulation and nutrition issues. Women also provide informed consent to the survey prior to the start of questions. All data are anonymized. This analysis focuses on the last birth in the last two years before the surveys for which information on PNC is provided. We include Benin 2011–2012, Burkina Faso 2010, Comoros 2012, Congo Brazzaville 2012, Cote d’Ivoire 2012, Gabon 2012, Guinee 2012, Mali 2012–2013, Namibia 2013, Niger 2012, Nigeria 2013, Sierra Leone 2013, Tanzania 2010, Uganda 2011 and Zimba-bwe 2011, based on the availability of comparable data on PNC.
There are two outcome variables. The first is the percentage of newborns who were breastfed within 1
day of birth among all newborns. The second outcome variable is the percentage of newborns who re-ceived a PLF ie, a feed that occurs within 3 days of births that is not breastmilk. The measure of PLFs is
based on asking the mother if, within the first 3 days after delivery, the newborn was given anything to
drink, other than breast milk. This is only asked for newborns who were ever breastfed.
The key independent variable is PNC within 1 day which refers to any check within 1 day to a newborn following birth. The question also provides examples of what a check may entail (checking temperature, cord etc.). We exclude a check by ‘others’ (such as friends or relatives as these are not likely to be medi-cal). Women were also asked, if for the last birth in the 2 years before the survey, what provider or
tradi-tional birth attendant performed the check on the newborn’s health. Qualitative work confirms that wom
-en are able to tell coher-ent narratives about the mom-ents around birth and recognize checks on the health
of a child [35]. Given that PLFs can occur anytime within 3 days, we attempt to establish PNC preceding
PLFs by defining PNC as a check within 1 day of birth instead of 3 days. Both of these outcomes are bi
-nary. To investigate if PNC provider is associated with the outcomes, we create a variable for PNC
pro-vided by three categories of caregivers: physicians, nurses/midwives/auxiliary midwives and finally, tra
-ditional birth attendants/community health workers/other.
In our models, we introduce a number of statistical controls based on the literature, classified as individual–
level controls or country–level controls. We include: age of the mother, previous birth interval, parity, cae-sarian section of birth, use of antenatal care (ANC), receipt of tetanus toxoid vaccination, skilled delivery, educational level of the woman, marital status, media access (regular access to print and mass media), place
of residence and a wealth index of household goods and assets (provided in the DHS data files), construct
-ed using Principal Component Analysis of household–level ownership of goods and assets.
We include 4 binary, country–level variables to account for the variation in the supply of PNC. The five
country–level variables are: Gross Domestic Product (GDP) per capita (“high” when US$ 1000 or greater per capita or “low” when below US$ 1000 per capita), per capita government expenditure on health (“high” when US$ 100 or greater per capita and “low” when below US$ 100 per capita), number of phy-sicians per 1000 population (“high” when the value is 0.1 or greater and “low” when the value is below
0.1) and finally, the number of nurses per 1000 population (“high” when the value is 1 and greater and
“low” when the value is less than 1). Finally, since there are prominent recommendations on newborn feeding practices in areas of high HIV prevalence, we included a dummy variable for HIV prevalence (“high” when 5% or greater and “low” when less than 5%) as an explanatory variable in the models.
Statistical analysis
VIEWPOINTS PAPERS
As breastfeeding within 1 day and PLFs are binary outcomes, a logistic regression model can be used, as-suming that the error term follows a logistic distribution. However, as we study individual–level data from different countries, this suggest that these data are clustered and as a consequence, a multilevel model may be required (MLM). To verify if MLM is needed, we compared all MLMs to single level logistic re-gressions using a Likliehood–ratio (LR) test. These results should that the data are clustered at the try level and that MLMs perform better than the single–level logistic regressions. In our models, coun-try–level variance was between 4 to 11 percent. Multilevel models and bivariate table are run without
sample weights while univariate are weighted using DHS sample weights provided in datafiles.
RESULTS
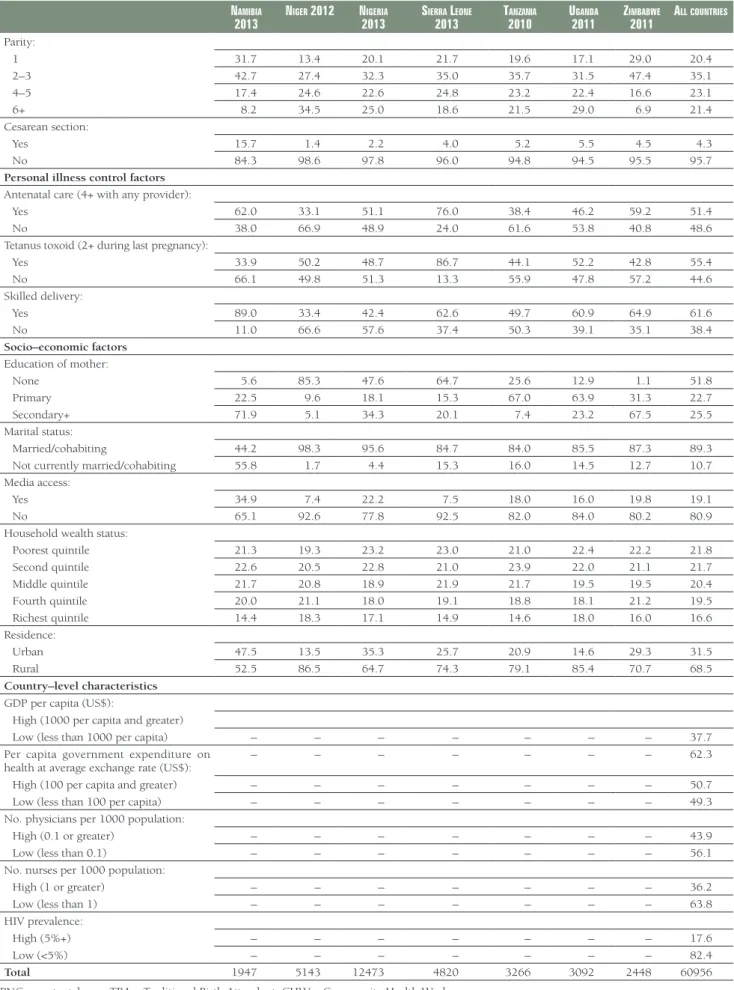
Breastfeeding within a day of birth is high (81 percent) and varies considerably across the countries, rang-ing from 66 percent in Cote d’Ivoire to 94 percent in Mali (Table 1). Levels of prelacteal feeds are lower (39 percent overall), ranging from 11 percent in Namibia to 65 percent in Cote d’Ivoire. PNC is low over-all; only 15 percent of the sample received PNC within a day, of which the vast majority was provided by a nurse (12 percent) and only 2 and 1 percent provided by physicians and by traditional birth attendants/ community health workers/others (TBA/CHWs/others) respectively. In the sample, about half of the wom-en had 3 or fewer childrwom-en. Caesarian sections are uncommon (4 percwom-ent). More than half of the womwom-en had contact with the health system through ANC care (52 percent), receipt of tetanus toxoid (56 percent) and had a skilled delivery (62 percent). The majority of the sample is married, has no education, no
reg-ular access to media and about 40 percent is classified into the poorest or second lowest wealth quintiles.
In 7 of the 15 countries, newborns who receive PNC were more likely to be breastfed within 1 day com-pared with newborns who did not receive PNC but in several countries (eg, Comoros, Congo (Brazza-ville), Uganda), the opposite occurs (Figure 1). Figure 2 shows that while overall newborns receiving
Figure 2. Among ever breast–fed newborns, percentage who had a prelacteal feed by post–natal care within 1 day of birth. Asterisk indicates P < 0.05. Figure 1. Percentage of newborns breastfed within 1 day of birth by post–natal care within 1 day. Asterisk indicates P < 0.05.
Figure 1
VIEWPOINTSPAPERS
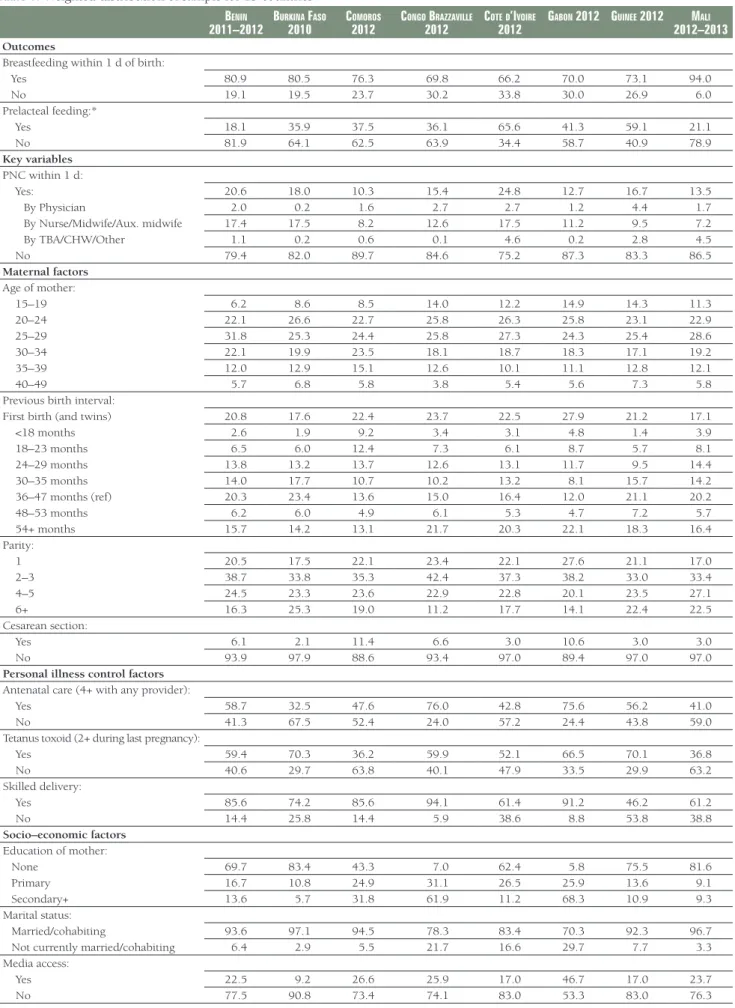
Table 1. Weighted distribution of sample for 15 countriesBenin
2011–2012 Burkina Faso 2010 Comoros 2012 Congo Brazzaville 2012 Cote d’ivoire 2012 gaBon 2012 guinee 2012 2012–2013mali Outcomes
Breastfeeding within 1 d of birth:
Yes 80.9 80.5 76.3 69.8 66.2 70.0 73.1 94.0
No 19.1 19.5 23.7 30.2 33.8 30.0 26.9 6.0
Prelacteal feeding:*
Yes 18.1 35.9 37.5 36.1 65.6 41.3 59.1 21.1
No 81.9 64.1 62.5 63.9 34.4 58.7 40.9 78.9
Key variables
PNC within 1 d:
Yes: 20.6 18.0 10.3 15.4 24.8 12.7 16.7 13.5
By Physician 2.0 0.2 1.6 2.7 2.7 1.2 4.4 1.7
By Nurse/Midwife/Aux. midwife 17.4 17.5 8.2 12.6 17.5 11.2 9.5 7.2
By TBA/CHW/Other 1.1 0.2 0.6 0.1 4.6 0.2 2.8 4.5
No 79.4 82.0 89.7 84.6 75.2 87.3 83.3 86.5
Maternal factors
Age of mother:
15–19 6.2 8.6 8.5 14.0 12.2 14.9 14.3 11.3
20–24 22.1 26.6 22.7 25.8 26.3 25.8 23.1 22.9
25–29 31.8 25.3 24.4 25.8 27.3 24.3 25.4 28.6
30–34 22.1 19.9 23.5 18.1 18.7 18.3 17.1 19.2
35–39 12.0 12.9 15.1 12.6 10.1 11.1 12.8 12.1
40–49 5.7 6.8 5.8 3.8 5.4 5.6 7.3 5.8
Previous birth interval:
First birth (and twins) 20.8 17.6 22.4 23.7 22.5 27.9 21.2 17.1
<18 months 2.6 1.9 9.2 3.4 3.1 4.8 1.4 3.9
18–23 months 6.5 6.0 12.4 7.3 6.1 8.7 5.7 8.1
24–29 months 13.8 13.2 13.7 12.6 13.1 11.7 9.5 14.4
30–35 months 14.0 17.7 10.7 10.2 13.2 8.1 15.7 14.2
36–47 months (ref) 20.3 23.4 13.6 15.0 16.4 12.0 21.1 20.2
48–53 months 6.2 6.0 4.9 6.1 5.3 4.7 7.2 5.7
54+ months 15.7 14.2 13.1 21.7 20.3 22.1 18.3 16.4
Parity:
1 20.5 17.5 22.1 23.4 22.1 27.6 21.1 17.0
2–3 38.7 33.8 35.3 42.4 37.3 38.2 33.0 33.4
4–5 24.5 23.3 23.6 22.9 22.8 20.1 23.5 27.1
6+ 16.3 25.3 19.0 11.2 17.7 14.1 22.4 22.5
Cesarean section:
Yes 6.1 2.1 11.4 6.6 3.0 10.6 3.0 3.0
No 93.9 97.9 88.6 93.4 97.0 89.4 97.0 97.0
Personal illness control factors
Antenatal care (4+ with any provider):
Yes 58.7 32.5 47.6 76.0 42.8 75.6 56.2 41.0
No 41.3 67.5 52.4 24.0 57.2 24.4 43.8 59.0
Tetanus toxoid (2+ during last pregnancy):
Yes 59.4 70.3 36.2 59.9 52.1 66.5 70.1 36.8
No 40.6 29.7 63.8 40.1 47.9 33.5 29.9 63.2
Skilled delivery:
Yes 85.6 74.2 85.6 94.1 61.4 91.2 46.2 61.2
No 14.4 25.8 14.4 5.9 38.6 8.8 53.8 38.8
Socio–economic factors
Education of mother:
None 69.7 83.4 43.3 7.0 62.4 5.8 75.5 81.6
Primary 16.7 10.8 24.9 31.1 26.5 25.9 13.6 9.1
Secondary+ 13.6 5.7 31.8 61.9 11.2 68.3 10.9 9.3
Marital status:
Married/cohabiting 93.6 97.1 94.5 78.3 83.4 70.3 92.3 96.7 Not currently married/cohabiting 6.4 2.9 5.5 21.7 16.6 29.7 7.7 3.3 Media access:
Yes 22.5 9.2 26.6 25.9 17.0 46.7 17.0 23.7
VIEWPOINTS PAPERS
Benin
2011–2012 Burkina Faso 2010 Comoros 2012 Congo Brazzaville 2012 Cote d’ivoire 2012 gaBon 2012 guinee 2012 2012–2013mali
Household wealth status:
Poorest quintile 20.3 20.2 23.0 22.2 24.3 21.3 22.9 20.4
Second quintile 20.5 21.9 20.8 23.0 20.4 21.6 21.4 20.2
Middle quintile 19.4 22.0 21.1 20.2 20.7 22.5 20.7 19.4
Fourth quintile 19.7 21.0 18.5 19.0 18.6 19.3 19.1 22.1
Richest quintile 20.1 14.9 16.6 15.5 15.9 15.2 15.9 17.8 Residence:
Urban 41.3 17.0 28.4 61.4 38.7 84.3 26.5 20.3
Rural 58.7 83.0 71.6 38.6 61.3 15.7 73.5 79.7
Country–level characteristics
GDP per capita (US$):
High (1000 per capita and greater) – – – – – – – –
Low (less than 1000 per capita) – – – – – – – –
Per capita government expenditure on health at average exchange rate (US$):
High (100 per capita and greater) – – – – – – – –
Low (less than 100 per capita) – – – – – – – –
No. physicians per 1000 population:
High (0.1 or greater) – – – – – – – –
Low (less than 0.1) – – – – – – – –
No. nurses per 1000 population:
High (1 or greater) – – – – – – – –
Low (less than 1) – – – – – – – –
HIV prevalence:
High (5%+) – – – – – – – –
Low (<5%) – – – – – – – –
Total 5130 5988 1298 3426 3039 2102 2818 3965
namiBia
2013 niger 2012 nigeria 2013 sierra leone 2013 tanzania 2010 uganda 2011 zimBaBwe 2011 all Countries Outcomes
Breastfeeding within 1 d of birth:
Yes 89.1 78.6 73.7 89.1 90.5 88.7 91.7 80.1
No 10.9 21.4 26.3 10.9 9.5 11.3 8.3 19.8
Prelacteal feeding:*
Yes 10.2 49.1 58.4 20.7 30.8 41.1 13.1 39.1
No 89.8 50.9 41.6 79.3 69.2 58.9 86.9 60.9
Key variables
PNC within 1 d:
Yes: 15.3 10.7 11.4 26.4 1.2 8.8 9.5 14.6
By Physician 5.6 0.2 4.5 1.5 0.1 1.8 1.6 2.3
By Nurse/Midwife/Aux. midwife 9.5 8.8 5.9 21.0 0.9 6.7 7.7 10.9
By TBA/CHW/Other 0.2 1.7 1.0 3.9 0.2 0.3 0.2 1.5
No 84.7 89.3 88.6 73.6 98.8 91.2 90.5 85.4
Maternal factors
Age of mother:
15–19 10.7 9.6 8.5 13.5 10.2 10.3 12.4 10.4
20–24 25.5 23.1 22.7 23.0 27.1 28.2 31.2 24.5
25–29 25.5 27.4 28.0 26.1 25.4 27.5 27.6 27.1
30–34 20.1 20.8 20.1 18.0 17.5 16.2 16.3 19.3
35–39 12.3 13.0 13.4 12.9 14.2 12.5 9.0 12.6
40–49 5.9 6.1 7.3 6.5 5.5 5.4 3.5 6.1
Previous birth interval:
First birth (and twins) 32.2 13.6 20.3 22.0 19.9 17.2 29.3 20.7
<18 months 2.4 4.1 4.1 2.5 3.6 6.1 2.4 3.5
18–23 months 4.9 11.3 9.9 6.9 8.0 12.9 3.6 8.1
24–29 months 8.2 20.6 15.7 12.0 16.9 20.5 6.8 14.3
30–35 months 7.7 18.1 15.1 13.9 15.6 13.7 8.7 14.2
36–47 months (ref) 9.8 18.3 18.1 16.7 16.0 15.0 14.9 17.8
48–53 months 4.9 4.3 4.4 5.7 5.0 3.4 5.8 5.2
54+ months 29.8 9.7 12.4 20.4 14.9 11.1 28.5 16.3
VIEWPOINTSPAPERS
namiBia2013 niger 2012 nigeria 2013 sierra leone 2013 tanzania 2010 uganda 2011 zimBaBwe 2011 all Countries
Parity:
1 31.7 13.4 20.1 21.7 19.6 17.1 29.0 20.4
2–3 42.7 27.4 32.3 35.0 35.7 31.5 47.4 35.1
4–5 17.4 24.6 22.6 24.8 23.2 22.4 16.6 23.1
6+ 8.2 34.5 25.0 18.6 21.5 29.0 6.9 21.4
Cesarean section:
Yes 15.7 1.4 2.2 4.0 5.2 5.5 4.5 4.3
No 84.3 98.6 97.8 96.0 94.8 94.5 95.5 95.7
Personal illness control factors
Antenatal care (4+ with any provider):
Yes 62.0 33.1 51.1 76.0 38.4 46.2 59.2 51.4
No 38.0 66.9 48.9 24.0 61.6 53.8 40.8 48.6
Tetanus toxoid (2+ during last pregnancy):
Yes 33.9 50.2 48.7 86.7 44.1 52.2 42.8 55.4
No 66.1 49.8 51.3 13.3 55.9 47.8 57.2 44.6
Skilled delivery:
Yes 89.0 33.4 42.4 62.6 49.7 60.9 64.9 61.6
No 11.0 66.6 57.6 37.4 50.3 39.1 35.1 38.4
Socio–economic factors
Education of mother:
None 5.6 85.3 47.6 64.7 25.6 12.9 1.1 51.8
Primary 22.5 9.6 18.1 15.3 67.0 63.9 31.3 22.7
Secondary+ 71.9 5.1 34.3 20.1 7.4 23.2 67.5 25.5
Marital status:
Married/cohabiting 44.2 98.3 95.6 84.7 84.0 85.5 87.3 89.3 Not currently married/cohabiting 55.8 1.7 4.4 15.3 16.0 14.5 12.7 10.7 Media access:
Yes 34.9 7.4 22.2 7.5 18.0 16.0 19.8 19.1
No 65.1 92.6 77.8 92.5 82.0 84.0 80.2 80.9
Household wealth status:
Poorest quintile 21.3 19.3 23.2 23.0 21.0 22.4 22.2 21.8
Second quintile 22.6 20.5 22.8 21.0 23.9 22.0 21.1 21.7
Middle quintile 21.7 20.8 18.9 21.9 21.7 19.5 19.5 20.4
Fourth quintile 20.0 21.1 18.0 19.1 18.8 18.1 21.2 19.5
Richest quintile 14.4 18.3 17.1 14.9 14.6 18.0 16.0 16.6 Residence:
Urban 47.5 13.5 35.3 25.7 20.9 14.6 29.3 31.5
Rural 52.5 86.5 64.7 74.3 79.1 85.4 70.7 68.5
Country–level characteristics
GDP per capita (US$):
High (1000 per capita and greater)
Low (less than 1000 per capita) – – – – – – – 37.7
Per capita government expenditure on
health at average exchange rate (US$): – – – – – – – 62.3
High (100 per capita and greater) – – – – – – – 50.7
Low (less than 100 per capita) – – – – – – – 49.3
No. physicians per 1000 population:
High (0.1 or greater) – – – – – – – 43.9
Low (less than 0.1) – – – – – – – 56.1
No. nurses per 1000 population:
High (1 or greater) – – – – – – – 36.2
Low (less than 1) – – – – – – – 63.8
HIV prevalence:
High (5%+) – – – – – – – 17.6
Low (<5%) – – – – – – – 82.4
Total 1947 5143 12473 4820 3266 3092 2448 60956
PNC – postnatal care, TBA – Traditional Birth Attendant, CHW – Community Health Worker *Denominator is ever–breast fed newborns.
VIEWPOINTS PAPERS
PNC are significantly less likely to receive a prelacteal feed, patterns by country vary considerably; 5 coun
-tries show a statistically significant relationship but 4 show the opposite pattern.
In the bivariate analysis, newborns receiving PNC within 1 day are significantly more likely to initiate
breastfeeding within a day and less likely to receive a prelacteal feed (Table 2). Women receiving
antena-Table 2. Percentage of all newborns breastfed within 1 day and percentage of newborns receiving prelacteal feeds among ever breastfed newborns, by key characteristics (unweighted), 15 countries
all newBorns ever BreastFed newBorns Breastfeeding within: Prelacteal feed
1 day P P
Key dependent variables
PNC within 1 day:
Yes 84.2 <0.001 35.3 <0.001
No 79.8 39.3
Maternal factors
Age of mother:
15–19 76.3 <0.001 42.5 <0.001
20–24 80.1 38.9
25–29 81.9 37.0
30–34 81.4 37.7
35–39 80.8 38.6
40–45 80.4 40.7
45–49 79.9 45.3
Previous birth interval:
First birth (and twins) 81.8 <0.001 38.7 <0.001
<18 months 76.8 39.6
18–23 months 78.2 41.6
24–29 months 80.5 41.6
30–35 months 82.1 40.7
36–47 months 81.8 39.7
48–53 months 81.5 35.7
54+ months 81.5 33.7
Parity:
1 77.0 <0.001 39.6 <0.001
2–3 81.9 35.6
4–5 82.2 38.2
6+ 79.9 43.2
Cesarean section:
Yes 62.4 <0.001 38.3 0.710
No 81.3 38.7
Breastfed within 1 hour:
Yes – 28.0 <0.001
No – 47.3
Personal illness control factors
Antenatal care (4+ with any provider):
Yes 82.0 <0.001 33.9 <0.001
No 78.9 43.8
Tetanus toxoid (2+ during last pregnancy):
Yes 81.5 <0.001 35.5 <0.001
No 79.2 42.7
Skilled delivery:
Yes 82.8 <0.001 30.9 <0.001
No 76.7 51.4
Socio–economic factors
Education of mother:
None 79.3 <0.001 42.7 <0.001
Primary 82.4 37.1
VIEWPOINTSPAPERS
all newBorns ever BreastFed newBornsBreastfeeding within: Prelacteal feed
Marital status:
Married/cohabiting 80.7 0.001 39.4 <0.001
Not currently married/cohabiting 79.0 33.2 Media access:
Yes 81.6 0.001 33.6 <0.001
No 80.3 39.8
Household wealth status:
Poorest quintile 77.2 <0.001 43.2 <0.001
Second quintile 79.2 40.8
Middle quintile 82.1 38.1
Fourth quintile 82.3 35.7
Richest quintile 83.1 33.3
Residence:
Urban 81.7 <0.001 34.2 <0.001
Rural 80.0 40.6
Country characteristics
GDP per capita (US$):
High (1000+ per capita) 74.0 <0.001 49.7 <0.001
Low (<1000 per capita) 84.7 31.6
Per capita government expenditure on health at average exchange rate (US$):
High (100+ per capita) 77.5 <0.001 44.3 <0.001
Low (<100 per capita) 83.7 32.7
No. physicians per 1000 population. <0.001
High (0.1+) 75.7 <0.001 50.6
Low (<0.1) 84.3 29.2
No. nurses per 1000 population:
High (1+) 79.1 <0.001 44.1 <0.001
Low (<1) 81.4 35.6
HIV prevalence:
High (5%+) 90.2 <0.001 24.9 <0.001
Low (<5%) 78.5 41.6
Total 61018 59309
PNC – postnatal care
tal care, tetanus toxoid and skilled delivery are significantly more likely to breastfeed within a day and less likely to provide a prelacteal feed to the newborn. A caesarian birth is significantly associated with
breastfeeding within 1 day but not with PLFs. Women with no education are less likely to breastfeed ear-ly and more likeear-ly to provide a prelacteal feed. While household wealth is positiveear-ly associated with breast-feeding within 1 day, the association is negative with prelacetal feeds. Women in urban areas are more likely than rural women to initiate breastfeeding within 1 day and less likely to give a prelacetal feed. Bi-variate analysis of the country–level variables also shows lower levels of GDP, expenditures, and physician and nurse density are associated with greater initiation of breastfeeding within 1 day and lower levels of prelacteal feeds. In countries with higher HIV prevalence, breastfeeding within 1 day is higher and prelac-teal feeds are lower.
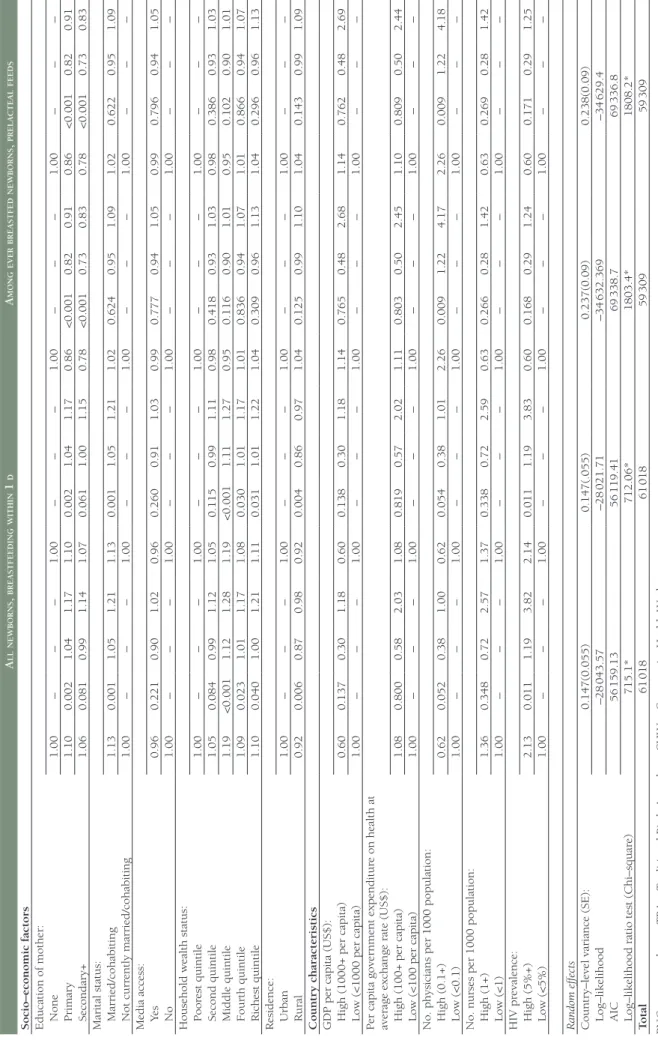
Table 3 shows that after controlling for individual and country–level variables, PNC within 1 day is
sig-nificantly associated with higher odds of breastfeeding within 1 day (OR = 1.35, 95% CI 1.27–1.44). The
odds of breastfeeding within 1 day are significantly lower for women who had a caesarian section com
-pared with those that did not have a caesarian section (OR = 0.26, 95% CI 0.23–0.28). Many of the
vari-ables related to contact with the health care system that are significant at the bivariate level are also sig
-nificant in the multilevel model. These include ANC (OR = 1.07, 95% CI 1.02–1.12), tetanus coverage
(OR = 1.10, 95% CI 1.05–1.15) and skilled delivery (OR = 1.48, 95% CI 1.40–1.56). Several
socio–eco-nomic variables are significantly associated with breastfeeding within 1 day. Compared to women with
no education, women with primary education are significantly more likely to initiate breastfeeding with
VIEWPOINTS PAPERS
Table 3.
Multilevel logistic r
egr
ession for br
eastfeeding within 1 d among all newbor
ns and pr
elacteal feeds among ever br
eastfed newbor
ns, 15 countries
A ll newborns , bre A stfeeding within 1 d A mong ever bre A stfed newborns , prel A cte A l feeds Model 1 P 95% CI Model 2 P 95% CI Model 3 P 95% CI Model 4 P 95% CI Fixed Ef fects
Key variables PNC within 1 d: Ye
s 1.35 <0.001 1.27 1.44 – – – – 1.04 0.195 0.98 1.09 – – – – No 1.00 – – – – – – – 1.00 – – – – – – – Pr
ovider of PNC within 1 d: By Physician
– – – – 0.93 0.269 0.81 1.06 – – – – 0.94 0.343 0.83 1.07 By Nurse/Midwife – – – – 1.39 <0.001 1.29 1.50 – – – – 1.03 0.315 0.97 1.09 By TBA/CHW/Other – – – – 1.95 <0.001 1.60 2.36 – – – – 1.20 0.017 1.03 1.39 No – – – – 1.00 – – – – – – – 1.00 – – – Mater nal factors
Age of mother: 15–19
1.00 – – – 1.00 – – – 1.00 – – – 1.00 – – – 20–24 1.08 0.049 1.00 1.17 1.09 0.043 1.00 1.17 0.93 0.038 0.86 1.00 0.93 0.040 0.86 1.00 25–29 1.15 0.002 1.05 1.26 1.16 0.001 1.06 1.26 0.84 <0.001 0.78 0.91 0.85 <0.001 0.78 0.92 30–34 1.13 0.020 1.02 1.25 1.14 0.014 1.03 1.26 0.85 <0.001 0.77 0.93 0.85 <0.001 0.77 0.93 35–39 1.12 0.050 1.00 1.26 1.13 0.038 1.01 1.27 0.85 0.002 0.77 0.94 0.85 0.002 0.77 0.94 40–49 1.16 0.027 1.02 1.33 1.17 0.020 1.03 1.34 0.91 0.117 0.81 1.02 0.91 0.127 0.81 1.03 Pr
evious birth inter
val:
First birth (and twins)
0.35 <0.001 0.24 0.49 0.35 <0.001 0.24 0.50 1.19 0.374 0.81 1.77 1.20 0.374 0.81 1.77 <18 months 0.78 <0.001 0.69 0.88 0.78 <0.001 0.69 0.88 1.07 0.181 0.97 1.19 1.07 0.185 0.97 1.19 18–23 months 0.92 0.070 0.84 1.01 0.92 0.069 0.84 1.01 1.04 0.332 0.96 1.12 1.04 0.332 0.96 1.12 24–29 months 1.01 0.733 0.94 1.09 1.01 0.721 0.94 1.09 1.03 0.399 0.96 1.10 1.03 0.400 0.96 1.10 30–35 months 1.01 0.805 0.94 1.09 1.01 0.813 0.94 1.09 0.98 0.624 0.92 1.05 0.98 0.623 0.92 1.05
36–47 months (r
ef) 1.00 – – – 1.00 – – – 1.00 – – – 1.00 – – – 48–53 months 0.93 0.190 0.84 1.04 0.93 0.194 0.84 1.04 0.97 0.457 0.88 1.06 0.97 0.455 0.88 1.06 54+ months 0.89 0.003 0.83 0.96 0.89 0.003 0.83 0.96 0.96 0.231 0.90 1.03 0.96 0.230 0.90 1.03 Parity: 1 1.00 – – – 1.00 – – – 1.00 – – – 1.00 – – – 2–3 0.48 <0.001 0.34 0.68 0.48 <0.001 0.34 0.69 0.97 0.868 0.65 1.43 0.97 0.869 0.65 1.43 4–5 0.49 <0.001 0.34 0.70 0.49 <0.001 0.34 0.71 1.03 0.889 0.69 1.53 1.03 0.891 0.69 1.53 6+ 0.45 <0.001 0.32 0.65 0.45 <0.001 0.32 0.65 1.05 0.794 0.71 1.57 1.05 0.797 0.71 1.57 Cesar ean section Ye s 0.26 <0.001 0.23 0.28 0.26 <0.001 0.24 0.29 1.60 <0.001 1.46 1.76 1.61 <0.001 1.47 1.77 No 1.00 – – – 1.00 – – – 1.00 – – – Br
eastfed within 1 h: Yes
– – – – – – – – 0.57 <0.001 0.55 0.59 0.57 <0.001 0.55 0.59 No – – – – – – – – 1.00 – – – 1.00 – – –
Personal illness contr
ol factors
Antenatal car
e (4+ with any pr
ovider): Ye s 1.07 0.009 1.02 1.12 1.07 0.008 1.02 1.12 0.90 <0.001 0.87 0.94 0.90 <0.001 0.87 0.94 No 1.00 – – – 1.00 – – – 1.00 – – – 1.00 – – –
Tetanus toxoid (2+ during last pr
VIEWPOINTSPAPERS
A ll newborns , bre A stfeeding within 1 d A mong ever bre A stfed newborns , prel A cte A l feedsSocio–economic factors Education of mother: None
1.00 – – – 1.00 – – – 1.00 – – – 1.00 – – – Primar y 1.10 0.002 1.04 1.17 1.10 0.002 1.04 1.17 0.86 <0.001 0.82 0.91 0.86 <0.001 0.82 0.91 Secondar y+ 1.06 0.081 0.99 1.14 1.07 0.061 1.00 1.15 0.78 <0.001 0.73 0.83 0.78 <0.001 0.73 0.83
Marital status: Married/cohabiting
1.13 0.001 1.05 1.21 1.13 0.001 1.05 1.21 1.02 0.624 0.95 1.09 1.02 0.622 0.95 1.09 Not curr ently married/cohabiting 1.00 – – – 1.00 – – – 1.00 – – – 1.00 – – –
Media access: Ye
s 0.96 0.221 0.90 1.02 0.96 0.260 0.91 1.03 0.99 0.777 0.94 1.05 0.99 0.796 0.94 1.05 No 1.00 – – – 1.00 – – – 1.00 – – – 1.00 – – –
Household wealth status: Poor
est quintile 1.00 – – – 1.00 – – – 1.00 – – – 1.00 – – – Second quintile 1.05 0.084 0.99 1.12 1.05 0.115 0.99 1.11 0.98 0.418 0.93 1.03 0.98 0.386 0.93 1.03 Middle quintile 1.19 <0.001 1.12 1.28 1.19 <0.001 1.11 1.27 0.95 0.116 0.90 1.01 0.95 0.102 0.90 1.01 Fourth quintile 1.09 0.023 1.01 1.17 1.08 0.030 1.01 1.17 1.01 0.836 0.94 1.07 1.01 0.866 0.94 1.07 Richest quintile 1.10 0.040 1.00 1.21 1.11 0.031 1.01 1.22 1.04 0.309 0.96 1.13 1.04 0.296 0.96 1.13 Residence: Urban 1.00 – – – 1.00 – – – 1.00 – – – 1.00 – – – Rural 0.92 0.006 0.87 0.98 0.92 0.004 0.86 0.97 1.04 0.125 0.99 1.10 1.04 0.143 0.99 1.09 Countr y characteristics
GDP per capita (US$): High (1000+ per capita)
0.60 0.137 0.30 1.18 0.60 0.138 0.30 1.18 1.14 0.765 0.48 2.68 1.14 0.762 0.48 2.69
Low (<1000 per capita)
1.00 – – – 1.00 – – – 1.00 – – – 1.00 – – –
Per capita gover
nment expenditur
e on health at
average exchange rate (US$): High (100+ per capita)
1.08 0.800 0.58 2.03 1.08 0.819 0.57 2.02 1.11 0.803 0.50 2.45 1.10 0.809 0.50 2.44
Low (<100 per capita)
1.00 – – – 1.00 – – – 1.00 – – – 1.00 – – –
No. physicians per 1000 population: High (0.1+)
0.62 0.052 0.38 1.00 0.62 0.054 0.38 1.01 2.26 0.009 1.22 4.17 2.26 0.009 1.22 4.18 Low (<0.1) 1.00 – – – 1.00 – – – 1.00 – – – 1.00 – – –
No. nurses per 1000 population: High (1+)
1.36 0.348 0.72 2.57 1.37 0.338 0.72 2.59 0.63 0.266 0.28 1.42 0.63 0.269 0.28 1.42 Low (<1) 1.00 – – – 1.00 – – – 1.00 – – – 1.00 – – – HIV pr evalence: High (5%+) 2.13 0.011 1.19 3.82 2.14 0.011 1.19 3.83 0.60 0.168 0.29 1.24 0.60 0.171 0.29 1.25 Low (<5%) 1.00 – – – 1.00 – – – 1.00 – – – 1.00 – – – Random ef fects Countr
y–level variance (SE):
0.147(0.055) 0.147(.055) 0.237(0.09) 0.238(0.09) Log–likelihood –28 043.57 –28 021.71 –34 632.369 –34 629.4 AIC 56 159.13 56 119.41 69 338.7 69 336.8
Log–likelihood ratio test (Chi–squar
e) 715.1* 712.06* 1803.4* 1808.2* T otal 61 018 61 018 59 309 59 309
PNC – postnatal car
e, TBA – T
raditional Birth Attendant, CHW – Community Health W
VIEWPOINTS PAPERS
not significant (OR = 1.06, 95% CI 0.99–1.14). Women in rural areas are significantly less likely to initi
-ate breastfeeding within a day than those in urban areas (OR = 0.92, 95% CI 0.87–0.98). Of the country– level controls in the model, higher HIV prevalence is associated with increased odds of breastfeeding within 1 day (OR = 2.13, 95% CI 1.19–3.82).
Model 2 shows that the provider of PNC is significantly associated with breastfeeding within 1 day. PNC
from physicians is not associated with breastfeeding within 1 day but PNC provided by nurses/midwives/ auxiliary midwives and TBA/CHW/others is associated with higher odds of breastfeeding within 1 day (nurses/midwives/aux. midwives OR = 1.39, 95% CI 1.29–1.50, TBA/CHW/others OR = 1.95, CI 1.60– 2.36).
Table 3 shows that after controlling for individual and country–level variables, PNC within 1 day is not
significantly associated with prelacteal feeds (OR = 1.04, 95% CI 0.98–1.09). Age is significantly associ
-ated with the outcome in the model with older women tending to have lower odds of providing prelac-teal feeds to newborn while birth spacing and parity were not associated with prelacprelac-teal feeds. Newborns
who had a Caesarian section delivery are significantly more likely to have PLFs (OR = 1.60, 95% CI 1.46–
1.76). Contact with the health care system through ANC, tetanus toxoid vaccination and skilled delivery
are significantly associated with lower odds of prelacteal feeds (see Table 3). For example, skilled
deliv-ery is associated with a 42% reduction in odds of prelacteal feeding (OR = 0.58, 95% CI 0.56–0.61). Ed-ucation shows a clear gradient with prelacteal feeds; as the edEd-ucational level of the woman increases, the odds of prelacteal feeding decreases (see Table 3). Of the country–level characteristics, only the density
of physicians is significantly associated with prelacteal feeds in the models: higher density of physicians
is associated with higher odds of prelacteal feeds (OR = 2.26, CI 1.22–4.17). In model 4 of Table 3, the type of provider of PNC is not associated with prelacteal feeds. Other results remain similar to model 2 of the second panel of Table 3.
DISCUSSION
PNC is one of the current strategies recommended for scale–up and implementation in many developing countries to improve health outcomes for newborns and mothers. While several trials and intervention
studies show that PNC can improve newborn feeding patterns [30–32], this is the first study to demon
-strate this association using national–level data for multiple countries in sub–Saharan Africa.
The major findings are that PNC is associated with breastfeeding within 1 day though not with prelac
-teal feeds. These findings are important as they suggest that PNC when delivered through customary care
(as opposed to intervention and trial conditions) can be a useful strategy to improve breastfeeding
(with-in 1 day) but not to reduce PLFs. These f(with-ind(with-ings highlight the need to strengthen cl(with-inical practice so that
providers of PNC can move beyond promoting timely initiation of breastfeeding to providing more
em-phasis on the avoidance of PLFs, which by definition would improve exclusive breastfeeding rates in these
countries.
Our findings also indicate that both trained medical personal (nurses, midwives and auxiliary midwives)
and untrained providers of PNC are associated with increased odds of breastfeeding within 1 day though the type of provider of PNC is not associated with PLFs. Given that all of the countries that we studied are developing countries, use of untrained persons for this type of intervention may be a useful imple-mentation approach as the promotion of optimal newborn feeding does not require high levels of special-ized training
A third important finding from this study is that, with the exception of caesarian section, contact with the
formal health care system is associated with improved newborn feeding practices. This is seen in other
studies eg, Nepal [27] and India [24]. This underscores the utility of the continuum of care and
reinforc-es the need to implement around this framework. Delivery mode by careinforc-esarian section, however, is
asso-ciated with poorer newborn feeding outcomes, a finding that is reflected in a number of other studies
[16,24,28,36,37], even in the presence of baby–friendly policies [17].
VIEWPOINTSPAPERS
could study the association of PNC within an hour and breastfeeding within the same time period.How-ever, we considered that a short time period of 1 hour does not provide sufficient time for PNC to be pro
-vided (given that in these settings, even PNC within 1 day is low). The literature also identifies a number
of additional factors that predict early initiation of breastfeeding and PLFs which were not available for
analysis. For example, intention to breastfeed [38] is an important predictor of initiation and duration of
breastfeeding but was not available in DHS data. Dealing with sample weights is a challenge for analysis
of this kind. Different countries contribute varying proportions of the overall sample and do not reflect
the relative population size of the country. Appropriate sample weight can be constructed though the sample weights must be de–normalized. However, the appropriate sampling fraction for each country and their population sizes used to create these weights are not publicly available.
Despite these limitations, our findings are consistent with trials and intervention studies, and overall, PNC
policy and practice can be further tailored to reduce PLFs rates. Further research at a country–level is
needed to understand if the results of this aggregate, multi–country study are reflected within each of
these countries.
Disclaimer: The findings and conclusions in this report are those of the authors and do not necessarily repre -sent the official position of their respective organizations.
Funding: None.
Authorship contributions: SMK conceived and operationalized the analysis and first draft of the paper. All authors discussed the paper, contributed to the final content, and writing of the paper and approved the final version.
Competing interests: The authors have completed the Unified Competing Interest form at www.icmje.org/ coi_disclosure.pdf (available on request from the corresponding author) and declare no competing interests.
1 Bhutta ZA, Ahmed T, Black RE, Cousens S, Dewey K, Giugliani E, et al. What works? Interventions for maternal and child undernutrition and survival. Lancet. 2008a;371. doi:10.1016/S0140-6736(07)61693-6. Medline:18206226
2 World Health Organization, United Nations Children’s Fund. Global strategy for infant and young child feeding. Gene-va: World Health Organization, 2003.
3 Edmond KM, Zandoh C, Quigley MA, Amenga-Etego S, Owusu-Agyei S, Kirkwood BR. Delayed breastfeeding initiation increases risk of neonatal mortality. Pediatrics. 2006;117:e380-6. doi:10.1542/peds.2005-1496. Medline:16510618
4 Huffman SL, Zehner ER, Victora C. Can improvements in breast-feeding practices reduce neonatal mortality in develop-ing countries? Midwifery. 2001;17:80-92. doi:10.1054/midw.2001.0253. Medline:11399129
5 Mullany LC, Katz J, Li YM, Khatry SK, LeClerq SC, Darmstadt GL, et al. Breast-feeding patterns, time to initiation, and mortality risk among newborns in southern Nepal. J Nutr. 2008;138:599-603. Medline:18287373
6 Goldman AS. The immune system of human milk: antimicrobial, antiinflammatory and immunomodulating properties. Pediatr Infect Dis J. 1993;12:664-71. Medline:8414780doi:10.1097/00006454-199308000-00008
7 Goldman AS, Garza C, Nichols BL, Goldblum RM. Immunologic factors in human milk during the first year of lactation. J Pediatr. 1982;100:563-7. Medline:6977634doi:10.1016/S0022-3476(82)80753-1
8 Brandtzaeg P. Mucosal immunity: integration between mother and the breast-fed infant. Vaccine. 2003;21:3382-8.
Med-line:12850345doi:10.1016/S0264-410X(03)00338-4
9 Goldman AS. Modulation of the gastrointestinal tract of infants by human milk. Interfaces and interactions. An evolu-tionary perspective. J Nutr. 2000;130:426S-31S. Medline:10721920
10 Rollins NC, Filteau SM, Coutsoudis A, Tomkins AM. Feeding mode, intestinal permeability, and neopterin excretion: a longitudinal study in infants of HIV-infected South African women. J Acquir Immune Defic Syndr. 2001;28:132-9.
Med-line:11588506doi:10.1097/00126334-200110010-00004
11 Badruddin SH, Islam A, Hendricks KM, Bhutta ZA, Shaikh S, Snyder JD, et al. Dietary risk factors associated with acute and persistent diarrhea in children in Karachi, Pakistan. Am J Clin Nutr. 1991;54:745-9. Medline:1897481
12 Clemens J, Elyazeed RA, Rao M, Savarino S, Morsy BZ, Kim Y, et al. Early initiation of breastfeeding and the risk of in-fant diarrhea in rural Egypt. Pediatrics. 1999;104:e3. Medline:10390289doi:10.1542/peds.104.1.e3
VIEWPOINTS PAPERS
13Sinusas K, Gagliardi A. Initial management of breastfeeding. Am Fam Physician. 2001;64:981-8. Medline:11578034
14 World Health Organization. Pregnancy, childbirth, postpartum and newborn care: A guide for essential practice. Gene-va: World Health Organization, 2003.
15 Darmstadt GL, Bhutta ZA, Cousens S, Adam T, Walker N, de Bernis L, et al. Evidence-based, cost-effective interventions: how many newborn babies can we save? Lancet. 2005;365:977-88. Medline:15767001 doi:10.1016/S0140-6736(05)71088-6
16 Vieira TO, Vieira GO, Giugliani ERJ, Mendes CM, Martins CC, Silva LR. Determinants of breastfeeding initiation within the first hour of life in a Brazilian population: cross-sectional study. BMC Public Health. 2010;10:760. Medline:21143893 doi:10.1186/1471-2458-10-760
17 Rowe-Murray HJ, Fisher JRW. Baby friendly hospital practices: cesarean section is a persistent barrier to early initiation of breastfeeding. Birth. 2002;29:124-31. Medline:12000413doi:10.1046/j.1523-536X.2002.00172.x
18 Boccolini CS, de Carvalho ML, de Oliveira MIC, Leal Mdo C, Carvalho MS. Factors that affect time between birth and first breastfeeding.[Article in Portuguese] Cad Saude Publica. 2008;24:2681-94. Medline:19009148
19 Dennis C-L. Breastfeeding initiation and duration: a 1990-2000 literature review. J Obstet Gynecol Neonatal Nurs. 2002;31:12-32. Medline:11843016doi:10.1111/j.1552-6909.2002.tb00019.x
20 World Health Organization. Evidence for the ten steps to successful breastfeeding. Geneva: World Health Organization, 1998.
21 Hossain MM, Radwan MM, Arafa SA, Habib M, DuPont HL. Prelacteal infant feeding practices in rural Egypt. J Trop Pe-diatr. 1992;38:317-22. Medline:1844092doi:10.1093/tropej/38.6.317
22 Lakati AS, Makokha OA, Binns CW, Kombe Y. The effect of pre-lacteal feeding on full breastfeeding in Nairobi, Kenya. East Afr J Public Health. 2010;7:258-62. Medline:21516965
23 El-Gilany AH, Sarraf B, Al-Wehady A. Factors associated with timely initiation of breastfeeding in Al-Hassa province, Saudi Arabia. East Mediterr Health J. 2012;18:250-4. Medline:22574479
24 Patel A, Banerjee A, Kaletwad A. Factors associated with prelacteal feeding and timely initiation of breastfeeding in hos-pital-delivered infants in India. J Hum Lact. 2013;29:572-8. Medline:23427115doi:10.1177/0890334412474718
25 Wamani H, Astrřm AN, Peterson S, Tylleskär T, Tumwine JK. Infant and young child feeding in western Uganda: knowl-edge, practices and socio-economic correlates. J Trop Pediatr. 2005;51:356-61. Medline:15947011doi:10.1093/tropej/ fmi048
26 Fikree FF, Ali TS, Durocher JM, Rahbar MH. Newborn care practices in low socioeconomic settlements of Karachi, Pak-istan. Soc Sci Med. 2005;60:911-21. Medline:15589663doi:10.1016/j.socscimed.2004.06.034
27 Khanal V, Adhikari M, Sauer K, Zhao Y. Factors associated with the introduction of prelacteal feeds in Nepal: findings from the Nepal Demographic and Health Survey 2011. Int Breastfeed J. 2013;8:9. Medline:23924230 doi:10.1186/1746-4358-8-9
28 Nguyen PH, Keithly SC, Nguyen NT, et al. Prelacteal feeding practices in Vietnam: challenges and associated factors. BMC Public Health. 2013;13:932. doi:10.1186/1471-2458-13-932. Medline:24099034
29 World Health Organization, United Nations Children’s Fund. Home visits for the newborn child. Geneva: World Health Organization, 2009.
30 Bhutta ZA, Memon ZA, Soofi S, Salat MS, Cousens S, Martines J. Implementing community-based perinatal care: results from a pilot study in rural Pakistan. Bull World Health Organ. 2008;86:452-9. Medline:18568274doi:10.2471/ BLT.07.045849
31 Kumar V, Mohanty S, Kumar A, Misra RP, Santosham M, Awasthi S, et al. Effect of community-based behaviour change management on neonatal mortality in Shivgarh, Uttar Pradesh, India: a cluster-randomised controlled trial. Lancet. 2008;372:1151-62. Medline:18926277doi:10.1016/S0140-6736(08)61483-X
32 Baqui AH, Ahmed S, El Arifeen S, Darmstadt GL, Rosecrans AM, Mannan I, et al. Effect of timing of first postnatal care home visit on neonatal mortality in Bangladesh: a observational cohort study. BMJ. 2009;339:b2826. Medline:19684100 doi:10.1136/bmj.b2826
33 Setegn T, Gerbaba M, Belachew T. Determinants of timely initiation of breastfeeding among mothers in Goba Woreda, South East Ethiopia: a cross sectional study. BMC Public Health. 2011;11:217. Medline:21473791 doi:10.1186/1471-2458-11-217
34 Haider R, Ashworth A, Kabir I, Huttly SR. Effect of community-based peer counsellors on exclusive breastfeeding prac-tices in Dhaka, Bangladesh: a randomised controlled trial [see commments]. Lancet. 2000;356:1643-7. Medline:11089824 doi:10.1016/S0140-6736(00)03159-7
35 Yoder P. Stanley, Mikey Risato, Riad Mahmud, Alfredo Fort, Fazlur Rahman, Avril Armstrong, and Sayed Rubayet. Wom-en's recall of delivery and neonatal care in Bangladesh and Malawi: A study of terms, concepts, and survey questions. DHS Qualitative Research Studies No. 17. Calverton, Maryland, USA: ICF Macro. 2010. Available: http://dhsprogram. com/pubs/pdf/QRS17/QRS17.pdf. Accessed: 1 August 2017.
36 Chien L-Y, Tai C-J. Effect of delivery method and timing of breastfeeding initiation on breastfeeding outcomes in Taiwan. Birth. 2007;34:123-30. Medline:17542816doi:10.1111/j.1523-536X.2007.00158.x
37 El-Gilany A-H, Abdel-Hady DM. Newborn first feed and prelacteal feeds in Mansoura, Egypt. BioMed Res Int. 2014;2014:258470. Medline:24895560doi:10.1155/2014/258470
38 Donath SM, Amir LH; ALSPAC Study Team. The relationship between prenatal infant feeding intention and initiation and duration of breastfeeding: a cohort study. Acta Paediatr. 2003;92:352-6. Medline:12725552doi:10.1111/j.1651-2227.2003. tb00558.x