COORDINATION OF MAP KINASE SIGNALING DURING CELL FATE
DECISIONS
Michal J. Nagiec
A dissertation submitted to the faculty of the University of North Carolina at Chapel Hill in partial fulfillment of the requirements for the degree of Doctorate of Philosophy in the Department of Pharmacology, School of Medicine.
Chapel Hill 2011
Approved by:
ABSTRACT
MICHAL J. NAGIEC: Coordination of MAP Kinase Signaling During Cell Fate Decisions (Under the direction of Dr. Henrik Dohlman)
Cells detect and respond to a wide diversity of environmental signals. These signals commonly stimulate mitogen-activated protein kinase (MAPK) pathways that evoke a cellular response. Particular environmental signals generate MAPK responses that are mutually exclusive. The coordination of competing MAPK signals is required to produce an appropriate cell fate. Budding yeast, Saccharomyces cerevisiae, use MAPK
pathways to respond to developmental signals and environmental stress. Mating
pheromones initiate the mating response pathway, which promotes mating
differentiation. Hyperosmotic stress initiates the high osmolarity stress (HOG) response
pathway, which promotes stress adaptation. The two pathways share components
despite producing competing cell fates. Here we describe mechanisms that coordinate
MAPK signaling to ensure proper cell fate decisions. We studied how the mating MAPK
Fus3 and the HOG MAPK, Hog1 are coordinated in co-stimulated cells. We find that
stress adaptation takes precedence over mating differentiation by two Hog1-dependent
mechanisms. First, Hog1 phosphorylates the protein kinase, Rck2, and thereby inhibits
pheromone-induced protein translation. Second, Hog1 phosphorylates a shared pathway
component, Ste50, and thereby dampens pheromone-induced MAPK activation. These
findings point to two mechanisms of cross-pathway inhibition used by one MAPK to
coordinate the activity of a second, competing MAPK. We also studied the coordination
that occurs between the two MAPKs activated by mating pheromones, Fus3 and Kss1.
growth in response to poor nutrient conditions. Thus coordination of Fus3 and Kss1 is
critical to maintaining proper mating differentiation. We find that Fus3 phosphorylates a
shared pathway component Ste7 to diminish Kss1 activity and prevent aberrant
filamentous growth during the mating response.
The study of mechanisms that determine cell fate in yeast might provide insights
about signal coordination and attenuation in more complex eukaryotic MAPK pathways.
Our analysis reveal that feedback phosphorylation of shared components contribute to
the coordination of MAPK activity. The insights gained from this work could contribute to
discovery of new therapies, specifically for disease where MAPK pathways are
ACKNOWLEDGEMENTS
TABLE OF CONTENTS
LIST OF TABLES...ix
LIST OF FIGURES ...x
LIST OF ABBREVIATIONS AND SYMBOLS ...xi
I. INTRODUCTION... 1
MAPK signaling networks ... 1
Model system for the study of MAPK signal transduction ... 4
The mating pathway... 5
The high osmolarity glycerol response pathway ... 10
Coordinated MAPK signaling during stress adaptation... 18
Coordinated MAPK signaling during the mating response ... 19
Thesis summary... 21
II. CHECKPOINTS IN A YEAST DIFFERENTIATION PATHWAY COORDINATE SIGNALING DURING HYPEROSMOTIC STRESS... 23
Summary... 23
Introduction ... 24
Results ... 26
Discussion... 52
Materials and Methods... 57
III. A COMPUTATIONAL ANALYSIS REVEALS MAP KINASE-MEDIATED FEEDBACK PHOSPHORYLATION AS A MECHANISM FOR SIGNALING SPECIFICITY IN YEAST ... 61
Summary... 61
Results ... 64
Disscussion ... 78
Materials and Methods... 79
IV. SIGNIFICANCE AND PERSPECTIVE... 86
MAPK signal coordination ... 86
Coordinated signaling and disease... 91
Concluding remarks ... 92
LIST OF TABLES
Table 2.1. Wildtype α factor response time course; see Figure 2.2 ... 33
Table 2.2. hog1Δα factor response time course; see Figure 2.2 ... 35
Table 2.3. Hog1K52R α factor response time course; see Figure 2.2 ... 36
Table 2.4. Wildtype α factor dose response log EC50, M; see Figure 2.3 ... 38
Table 2.5. Strains used in this study ... 58
LIST OF FIGURES
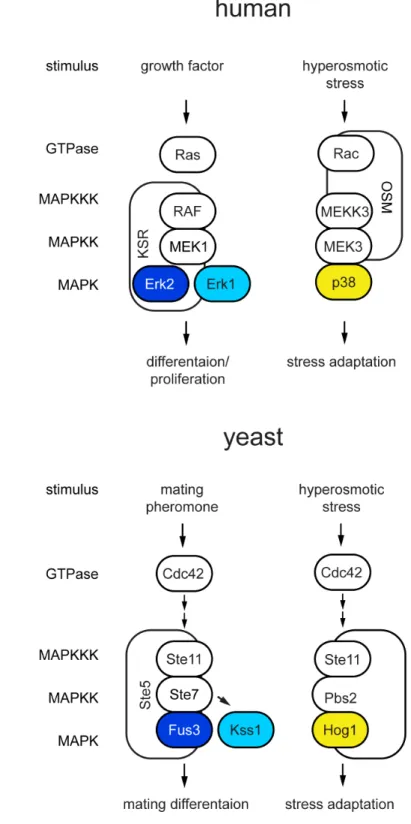
Figure 1.1 MAPK signaling pathways are conserved from yeast to humans... 6
Figure 1.2 The yeast mating response. ... 8
Figure 1.3 The high osmolarity glycerol (HOG) response... 11
Figure 1.4 Yeast MAPK pathways share components... 16
Figure 2.1. Hyperosmotic stress delays mating differentiation. ... 29
Figure 2.2 Hyperosmotic stress delays and dampens mating transcription... 32
Figure 2.3. High osmolarity has minor effects on pheromone sensitivity... 37
Figure 2.4. Hyperosmotic stress dampens mating MAPK activation and induction... 40
Figure 2.5. Hyperosmotic stress dampens Fus3 activation in a Hog1 dependent manner... 41
Figure 2.6. Constitutively active Hog1 dampens Fus3 activation and induction. ... 44
Figure 2.7. Hog1 dampens Fus3 activation by targeting Ste50. ... 47
Figure 2.8. Ste50 is required for full activation of the pheromone pathway. ... 50
Figure 2.9. Rck2 and Ste50 limit mating MAPK activation and induction. ... 51
Figure 2.10. Model of Hog1 cross-pathway inhibition. ... 56
Figure 3.1. Fus3 attenuates Kss1 activity. ... 63
Figure 3.2. Six models of Fus3-mediated attenuation of Kss1 activity. ... 66
Figure 3.3. A comparison of model output with experimental data. ... 70
Figure 3.4. A simple model of cross-inhibition. ... 73
Figure 3.5. Fus3 attenuates Kss1 activity through feedback phosphorylation of Ste7. ... 76
LIST OF ABBREVIATIONS AND SYMBOLS
ADH1 Alcohol DeHydrogenaseArg or R Arginine
CDC Cell Division Cycle CDK Cyclin Dependent Kinase
CTM Carboxy-terminal TransMembrane domain DIC Differential Interference Contrast
DNA Deoxyribonucleic acid
EC50 Half maximal effective concentration EDTA Ethylenediaminetetraacetic acid EF2 Elongation Factor
ERK Extracellular signal-regulated kinase FAR1 Factor ARrest
FRE Filamentation Response Element
FUS3 cell FUSion
G protein Guanine nucleotide-binding protein G6PDH Glucose-6-phosphate dehydrogenase GAL1 GALactose metabolism
GDP Guanosine diphosphate GFP Green fluorescent protein Glu or E Glutamic acid
Gβ G protein beta subunit Gγ G protein gamma subunit HA Human Influenza hemagglutinin HKR1 Hansenula mrakii Killer toxin Resistant HOG High Osmolarity Glycerol response JNK c-Jun N-terminal kinase
KCl Potassium chloride
KSS1 Kinase Suppressor of Sst2 mutations lacZ β-galactosidase gene
Lys or K Lysine
M mol/L
MAPK Mitogen-activated protein kinase
MAPKK Mitogen-activated protein kinase kinase
MAPKKK Mitogen-activated protein kinase kinase kinase
MEK MAPK/Erk kinase
mRNA Messenger ribonucleic acid
MSB2 Multicopy Suppressor of a Budding defect MSG5 Multicopy Suppressor of GPA1
OPY2 Overproduction-induced Pheromone-resistant Yeast p38 p38 mitogen-activated protein kinase
p42 Erk2
p44 Erk1
Pro or P Proline
PTP Protein Tyrosine Phosphatase
RAF Rapidly Accelerated Fibrosarcoma, MAPKKK
RAS RAt Sarcoma
RCK2 Radiation sensitivity Complementing Kinase RGS Regulator of heterotrimeric G protein Signaling SCD Synthetic Complete medium containing Dextrose
SDS-PAGE Sodium dodecyl sulfate polyacrylamide gel electrophoresis SEM Standard Error of the Mean
Ser or S Serine
SHO1 Synthetic High Osmolarity sensitive SLN1 Synthetic Lethal of N-end rule SSD Sum of squared differences SSK Suppressor of Sensor Kinase
STE STErile
t½ max Time at half-maximum response TAP Tandem affinity purification TCA Trichloroacetic acid
TEC1 Transposon Enhancement Control Thr or T Threonine
Tyr or Y Tyrosine Val or V Valine
YPD Yeast Extract Peptone Dextrose growth medium YPD1 tyrosine (Y) Phosphatase Dependent
Δ Deletion
CHAPTER I
INTRODUCTION
All living cells continuously survey their environment for changes that may improve or compromise their chances of survival. Eukaryotic cells use mitogen activated protein kinases (MAPK) to detect changes in their environment and produce appropriate responses. MAPKs regulate vital cell fate decisions including proliferation, differentiation and apoptosis (Johnson and Lapadat 2002). Accordingly, these signaling proteins are often deregulated during the progression of disease, including cell proliferation in developing cancers and neuron apoptosis leading to neurodegenerative disorders (Kim and Choi 2010). Understanding the regulatory mechanisms that govern the activity of these proteins presents an opportunity for the development of new therapies to combat disease.
This thesis focuses on the regulatory mechanisms that coordinate MAPK signaling during cell fate decisions. Much is known about the components of individual MAPK pathways and the mechanisms that regulate their activity, however the mechanisms that coordinate signaling of multiple MAPK pathways are poorly understood. This chapter introduces known mechanism of MAPK regulation, presents challenges associated with the study of MAPK signaling and outlines strategies to study complex signaling networks.
MAPK signaling networks
modulates the activity of the substrate. As a result, protein phosphorylation is a common post-translational modification that mediates intracellular signal transduction. MAPKs are a part of a three-tiered protein kinase cascade that has been conserved among all eukaryotes. The core of this signaling module is comprised of a MAPKKK (MAP kinase kinase kinase), MAPKK (MAP kinase kinase) and the MAPK. This three-tiered design enables signal amplification and allows for multiple levels of regulation (Chen and Thorner 2005). Furthermore, the conservation and prevalence of this design throughout evolution is evidence of its versatility as a signaling mechanism.
MAPKs promote diverse and often opposite cell fates that depend on the environmental context. Numerous environmental signals activate MAPKs including mitogens, hormones, cytokines, toxins, cellular stresses, growth factors, cell-cell and cell-extracellular matrix interactions. Activated MAPKs in turn regulate numerous cell processes including transcription, translation, cytoskeletal rearrangement, motility, cell cycle regulation, proliferation, development, and apoptosis. The diversity of signals MAPKs potentiate provides the cell with the opportunity to integrate a large amount of information about its environment. However, the diversity of responses produced by MAPKs introduces the potential for inappropriate “cross-talk”, for example proliferative signals activating apoptosis. To ensure signal integration while maintaining signal fidelity cells have developed mechanisms to regulate these signaling pathways including: component diversity, localization, signal strength and duration (Schwartz and Madhani 2004; Keshet and Seger 2010).
signal specificity. Human cells have 11 MAPKs, 7 MAPKKs, and at least 20 MAPKKKs (Johnson 2011). This diversity allows for the assembly of unique sets of components to propagate unique signals. Furthermore, the expression of specific pathway components can be restricted to specific cell types (Schwartz and Madhani 2004).
MAPK signal specificity is also achieved by scaffold proteins, which organize the signal relay (Pawson and Scott 2010). These proteins interact with individual components of the MAPK cascade bringing them into proximity with one another to facilitate activation. Scaffold proteins also function to localize the signaling complex to specific cellular compartments, typically the plasma or endo-membranes, where pathway activators are present. Beyond tethering functions recent studies have found that a scaffold regulates signal output by converting the MAPK to a more favorable MAPKK substrate (Bhattacharyya et al. 2006; Good et al. 2009).
MAPK signal strength and duration can also contribute to pathway specificity. In a classic example the activation kinetics of ERK1/2 determines whether neuronal cells grow and divide or form neurite protrusions. Transient ERK1/2 activation results in cell proliferation while sustained activation results in cell differentiation (Cowley et al. 1994; Marshall 1995). This behavior has been recorded in several MAPK systems and is the result of coordinated regulation of upstream inputs and downstream phosphatases (Owens and Keyse 2007). Scaffold proteins also regulate MAPK activation kinetics (Dhanasekaran et al. 2007). A recently identified ERK1/2 scaffold, β-arrestin mediates slow but sustained activation of the MAPK, which is in contrast to the rapid and transient activation mediated by the upstream receptor (Kovacs et al. 2009). Together, the diversity of pathway components, the scaffolds they interact with and the activation kinetics of the MAPK are all interdependent mechanisms that promote substrate specificity and dictate the appropriate cellular response.
signaling is complex. The large diversity of pathway components and their context specific interactions underscore the complexity found in metazoan MAPK signaling systems. The activation and behavior of a particular MAPK depends on the cell type, growth conditions, and metabolic state of the cell. Another level of complexity arises when considering that the four MAPK subfamilies form an integrated signaling network. Pathway integration typically occurs at the level of the MAPKKK and more than half of the 20 MAPKKKs in metazoans have been reported to activate at least two MAPK subfamilies (Cuevas et al. 2007). The high-level of pathway connectivity suggests that common mechanisms exist to regulate signal integration. The identification of these mechanisms will require the study of well-characterized MAPK pathways in well-defined signaling contexts.
Model system for the study of MAPK signal transduction
gene function, protein interactions and protein localization in the cell. More recent system-level studies in yeast have combined computational, proteomic and genomic approaches to characterize cell-signaling networks (Ptacek et al. 2005; Fiedler et al. 2009; Breitkreutz et al. 2010).
Yeast utilize five MAPK pathways that respond to different environmental stimuli (Chen and Thorner 2007). Three of the MAPKs have structural and functional homologs in humans (Figure 1.1). The first two MAPKs identified in yeast, Kss1 and Fus3, regulate cell differentiation and morphogenesis and are homologs of Erk1 and Erk2 (Courchesne et al. 1989; Elion et al. 1990). Another functionally conserved yeast MAPK, Hog1 regulates adaptation to environmental stress and is a homologue of p38 (Brewster et al. 1993). The identification of Kss1, Fus3 and Hog1 led to the identification of mammalian homologues Erk1 and p38 in mammalian cells (Boulton et al. 1990; Han et al. 1994). Furthermore, identification of yeast MAPK scaffold proteins Ste5 and Ste50 contributed to the characterization of mammalian counterparts that perform similar functions (Therrien et al. 1996; Uhlik et al. 2003). My thesis work focuses on how cell fate decisions are coordinated by these three conserved yeast MAPKs. Our understanding of mammalian MAPK signaling networks is often obscured by their complexity thus in our studies we use the MAPK signaling network of yeast as a simplified model. The discoveries made in yeast have already led to a better understanding of signaling systems in human cells and we anticipate that yeast will continue to be an informative model for the study of mechanisms that regulate MAPK networks.
The mating pathway
Figure 1.1 MAPK signaling pathways are conserved from yeast to humans.
1988). Two haploid cells are able to become a diploid through a developmental process known as mating. The mating process is analogous to the fusion of two gametes and the formation of a zygote in multicellular organisms. During mating two haploid cells of opposite mating types, a or α, release gradients of peptide pheromones, a factor or
α factor, respectively (Figure 1.2). The detection of pheromone by a cell of the opposite mating type promotes the formation of a mating projection, termed the shmoo, towards the source of the pheromone gradient. Once two shmoo tips make contact cells undergo fusion and conjugation that results in the formation of an a/α diploid cell.
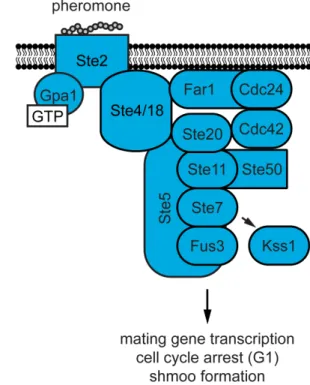
Figure 1.2 The yeast mating response.
1990; Roberts et al. 2000; Yu et al. 2008).
Mating differentiation is driven by the phosphorylation of two Fus3 substrates, the transcription factor, Ste12 and the scaffold protein, Far1 (Elion et al. 1993). Ste12 induces the transcription of genes required for mating, whereas Far1 enables cell-cycle arrest and proper shmoo formation. Upon phosphorylation by Fus3, Far1 acts as a cyclin-dependent kinase (CDK) inhibitor and blocks exit from G1 phase of the cell cycle (Chang and Herskowitz 1990). The arrest of cells in G1 ensures all cells have only one copy of their genetic material prior to conjugation, thereby preventing aneuploidy. During mating differentiation Far1 is exported from the nucleus and binds activated Ste4 (Shimada et al. 2000). Far1 also shuttles the Cdc42 guanine nucleotide exchange factor (GEF), Cdc24 to sites of activated receptor and G protein (Butty et al. 1998; Nern and Arkowitz 1999). Thus, Far1 ensures that Cdc42-mediated membrane polarization occurs at sites where the greatest numbers of receptors are being activated by high concentrations of pheromone.
The role of Kss1 during mating is distinct from that of Fus3 (Breitkreutz and Tyers 2002). Kss1 was first identified as a multicopy suppressor of mating pathway mutants that resulted in constitutive growth arrest by pheromone (Courchesne et al. 1989). This observation suggested that Kss1 has a negative role in the regulation of the pheromone response. However, further studies revealed that Kss1 could partially compensate for the loss of Fus3 during mating (Elion et al. 1991). Shortly thereafter it was discovered that Kss1 regulates the filamentous growth response during nutrient limiting conditions in haploid cells (Liu et al. 1993; Roberts and Fink 1994). When cells are starved they forage for new sources of nutrients by growing invasively into the substratum.
pathways that share components maintain specificity. An early model proposed that the two kinases obstruct each other to prevent unwanted cross-activation (Madhani et al. 1997). The authors concluded that Kss1 is only activated by nutrient deprivation while mating pheromones only activate Fus3. However, several papers soon showed that physiological levels of pheromones could also activate Kss1 (Breitkreutz et al. 2001; Sabbagh et al. 2001). The activation of Kss1 by pheromones raises the possibility that it may be required to achieve a full mating response. Kss1 has been shown to directly bind and inhibit Ste12 in the inactive state (Bardwell et al. 1998a; Bardwell et al. 1998b), suggesting that Kss1 activation may be required to allow for full mating gene transcription. The contribution of Kss1 to the mating response requires further study as do the mechanisms responsible for preventing inappropriate activation of filamentous growth by mating pheromones. Thus, the mating pathway is a model of MAPK coordination during cell fate decisions.
The high osmolarity glycerol response pathway
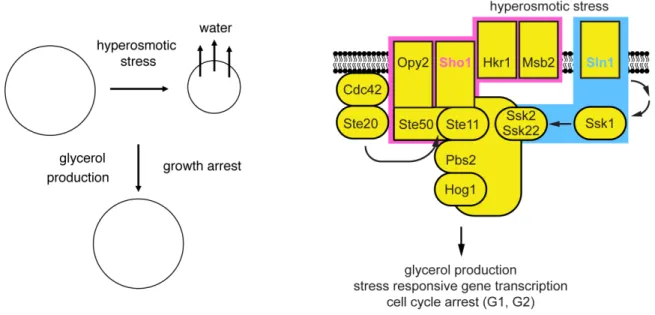
Yeast cells require a positive cell turgor pressure to maintain growth. Sudden increase in external osmolarity results in water leaving the cell (Figure 1.3). The reduction of cell volume results in a drop in turgor pressure. In response to reduced turgor pressure cells activate the high osmolarity glycerol (HOG) MAPK pathway (Hohmann 2002; Hohmann et al. 2007). Activation of the stress MAPK, Hog1, initiates rapid adaptation by the production of an intracellular solute, glycerol (Reed et al. 1987; Nevoigt and Stahl 1997). As glycerol accumulates water flows back into the cell, positive turgor pressure is restored and growth resumes.
Figure 1.3 The high osmolarity glycerol (HOG) response.
the MAPKK, Pbs2, which also serves as a scaffold for the upstream MAPKKKs and the downstream MAPK, Hog1.
The SHO1 branch is activated by two osmosensors, Hkr1 and Msb2, which are thought to detect increases in external osmolarity (Tatebayashi et al. 2007). Sho1 is a transmembrane protein that receives the extracellular stress signal detected by the osmosensors and converts it into an intracellular signal. The mechanism by which Sho1 transmits this signal is not fully understood, but it requires the activation of the PAK kinase Ste20 at the plasma membrane by the activated, GTP-bound, small G protein Cdc42 (Lamson et al. 2006). Activated Cdc42 recruits both Ste20 and the Ste11/Ste50 complex (comprised of the MAPKKK, Ste11, and its adaptor protein Ste50) to the plasma membrane (Wu et al. 1999; Tatebayashi et al. 2006; Truckses et al. 2006). Activated Ste20 phosphorylates and activates Ste11 (Drogen et al. 2000). Ste11/Ste50 also interact with the membrane-anchored scaffolds Opy2 and Sho1 (Wu et al. 2006; Yamamoto et al. 2010). These interactions bring Ste11 in proximity with its substrate the MAPKK, Pbs2, which also forms a scaffold complex with Sho1 (Maeda et al. 1995; Zarrinpar et al. 2004).
targets to promote rapid and continuing adaptation to hyperosmotic stress.
To ensure rapid adaptation to hyperosmotic conditions, Hog1 phosphorylates several targets that restore the osmotic balance. Glycerol accounts for 95% of the solute accumulated during stress recovery (Reed et al. 1987). Hog1 promotes glycerol production by the activation a glycolytic enzyme Pfk26 that is involved in the production of glycerol precursors (Dihazi et al. 2004). Hog1 also ensures rapid protection from stress by stimulating ion export (Proft and Struhl 2004), promoting exit from the cell cycle (Escote et al. 2004; Clotet et al. 2006), and inhibiting protein translation through phosphorylation of the MAPK-activated protein kinase, Rck2 (Bilsland-Marchesan et al. 2000; Teige et al. 2001). These functions of Hog1 protect the process of gene expression and DNA replication from any errors caused by stress that could lead to cell damage. The activation of Hog1 is rapid and transient; the kinase is dually phosphorylated and fully activated within the first minute after stress and returns to basal levels 20 minutes after stimulation (Maeda et al. 1995). The transient kinetics of Hog1 activation correspond to glycerol accumulation in the cell (Klipp et al. 2005; Muzzey et al. 2009). Hog1 is turned off as glycerol accumulation reestablishes positive turgor pressure and cell growth. Hog1 also activates multiple transcription factors that drive a transcriptional response to hyperosmotic stress (de Nadal and Posas 2010). Most products of the transcriptional response are synthesized after cells have adapted to stress and are not essential for survival. This function of Hog1 is thought to protect the cell from further increases in stress conditions and maintain continued growth under sustained hyperosmotic stress. Accordingly, Hog1 has the capacity to mediate adaptation to hyperosmotic stress even when unable to induce transcription (Westfall et al. 2008).
As shown in Figure 1.4, the mating, filamentous growth and HOG, pathways use the same components, but inappropriate cross-talk is prevented. Signal specificity is kept by four putative mechanisms, (i) docking interactions, (ii) kinetic insulation, (iii) scaffolding and (iv) cross-pathway inhibition (Schwartz and Madhani 2004; Saito 2010). A common mechanism of retaining substrate specificity among kinases is to form direct docking interactions (Bardwell 2006). The second mechanism, termed kinetic insulation, occurs when different activation kinetics of pathways with shared components results in unique responses or substrate specificities (Behar et al. 2007). The third mechanism utilizes scaffold proteins to sequester components of only a single pathway thereby insulating the signal by physical means (Good et al. 2011). The last mechanism occurs when a component of one pathway blocks the signal of a parallel pathway, resulting in cross-pathway inhibition. These mechanisms of MAPK regulation have been described from yeast to humans and complement one another in maintenance of signal specificity. This section introduces known mechanisms that maintain signal specificity and provide background for the following research chapters, with focus on regulation of Fus3 and Hog1 during mating or the hyperosmotic stress response (Chapter II) and regulation of Fus3 and Kss1 during mating (Chapter III).
Figure 1.4 Yeast MAPK pathways share components.
MAPK activation kinetics between the two pathways also suggests that Ste11 activation is more sustained in response to mating pheromones and more transient in response to hyperosmotic stress. Scaffold proteins mediate another mechanism of insulation. Ste11 is activated in complexes that form in response to a particular stimulus. During mating the mating scaffold, Ste5 binds Ste11 and directs the activation of Ste7, but not Pbs2. Conversely, during hyperosmotic stress conditions the co-scaffolds Sho1 and Pbs2 interact with Ste11 and direct the activation of Pbs2, but not Ste7 (Zarrinpar et al. 2004; Tatebayashi et al. 2006). Finally, during hyperosmotic conditions Hog1 blocks cross-talk to the mating pathway. Hyperosmotic stress activates the mating response when Hog1 is deleted or its kinase activity is disabled (Hall et al. 1996; O'Rourke and Herskowitz 1998). The stress to mating cross-talk requires the SHO1-branch of the HOG pathway suggesting that the shared component Ste11 activated by stress wrongly phosphorylates Ste7. Despite evidence that Hog1 is required for cross-pathway inhibition, the targets of Hog1 that prevent stress mediated mating have remained elusive.
stimulation (Sabbagh et al. 2001). Fus3 activation is highly increased and sustained, while Kss1 activity is transient. The transient activation of Kss1 might be required for mating gene transcription but does not activate the transcription of filamentous genes (Sabbagh et al. 2001). However, the activation of Kss1 becomes sustained in cells lacking FUS3, and results in aberrant transcription of filamentous genes. This suggests that Fus3 blocks sustained Kss1 activity and prevents cross-talk. The target of Fus3 that prevents cross-talk was found to be downstream of Kss1. Fus3 phosphorylates the filamentous growth specific transcription factor, Tec1. Phosphorylation of Tec1 leads to its ubiquitination and degradation (Bao et al. 2004; Chou et al. 2004). This mechanism ensures that Kss1 activated by pheromone cannot activate the transcription of filamentous genes and disrupt mating differentiation. The regulation of a component downstream of Kss1 does not explain how Fus3 maintains the transient activation kinetics of Kss1. We explore possible mechanisms of this regulation in Chapter III.
Coordinated MAPK signaling during stress adaptation
environmental conditions must exist. A common source of environmental instability to a yeast cell is an increase in external osmolarity, for instance the breaking skin of a ripe fruit. Yeast have evolved the HOG response to survive a major increase in extracellular osmolarity. The regulation of mating signals during stress adaptation provide a unique model for the study of how eukaryotic cells coordinate environmental stress and differentiation signals.
The mating and HOG MAPK pathways produce unique cell fates. The two pathways also share several core components, which provides the potential for aberrant cross-talk. In another view, signaling pathways share components to coordinate responses when both pathways are co-stimulated. Hog1 prevents the activation of the mating signal during hyperosmotic stress conditions (O'Rourke and Herskowitz 1998), suggesting that the stress response takes priority over mating during co-stimulation. Two recent reports investigated the response of cells co-stimulated with mating pheromones and hyperosmotic stress (McClean et al. 2007; Patterson et al. 2010). McClean et al., concluded that the responses activated by the two pathways are mutually exclusive, constraining cells to respond to one signal or the other. Patterson et al., concluded that the two pathways are insulated from one another, allowing cells to respond to both signals at the same time. The two studies measured pathway output downstream of the MAPKs at a single time point after cells have adapted to the hyperosmotic conditions. The work presented in Chapter II describes how the signaling pathways coordinate mating and stress signals, with a specific focus on early signaling events when both Fus3 and Hog1 are activated.
Coordinated MAPK signaling during the mating response
direction of a potential mating partner. Two haploid cells must be in close proximity to one another for conjugation to occur, thus distance between mating partners presents a challenge to a successful mating. Yeast are immotile organisms but are capable of directed growth. Nutrient limitation activates the filamentous growth pathway causing cells to expand in search of new sources of food. At low concentrations of pheromone cells exhibit filamentous-like chemotropic growth toward the source of pheromone (Paliwal et al. 2007; Hao et al. 2008a). The commitment to mating differentiation requires significant energy. Thus cells avoid activation of the mating response if the chance for conjugation is small. The switch-like behavior of the mating response prevents low concentrations of pheromone emitted from distant mating partners from activating shmoo formation and cell cycle arrest. Once dividing cells reach a high pheromone concentration the pathway becomes fully active and cells differentiate. The display of these separate cell behaviors in response to pheromone suggests that Fus3 and Kss1 activation is coordinated to make the proper cell fate decision. Thus a complete understanding of how cell fate decisions are determined will require a grasp of the mechanisms that coordinate the activity of the two MAPKs.
provide an advantage to formulating testable hypothesis. We have used applied mathematics and computational approaches to improve our ability to predict pathway behavior based on known parameters (Hao et al. 2003; Hao et al. 2007; Hao et al. 2008a). In Chapter III we apply computational modeling approaches to predict the mechanisms that regulate coordinated Fus3 and Kss1 signaling in response to pheromone. We follow up the predictions made by modeling with experimental validation.
Thesis summary
The yeast pheromone pathway has served as an archetype for studies of signaling events that promote cell proliferation and differentiation. The unicellular eukaryote uses many of the same components as metazoan cells to drive differentiation. Accordingly, discoveries made in the pheromone pathway have contributed to our understanding of RGS proteins (Chan and Otte 1982; Dohlman et al. 1995; Siderovski et al. 1996), scaffolds (Choi et al. 1994) and MAPKs (Courchesne et al. 1989; Elion et al. 1990). The work described in this thesis aims to expand on the use of this model signal transduction pathway to study how signals are coordinated during cell fate decisions.
CHAPTER II
CHECKPOINTS IN A YEAST DIFFERENTIATION PATHWAY COORDINATE
SIGNALING DURING HYPEROSMOTIC STRESS
Authors of this work include: Michal J. Nagiec and Henrik G. Dohlman
Summary
All eukaryotes have the ability to detect and respond to environmental and hormonal
signals. In many cases these signals evoke cellular changes that are incompatible and must
therefore be orchestrated by the responding cell. In yeast Saccharomyces cerevisiae,
hyperosmotic stress and mating pheromones initiate signaling cascades that each terminate
with a MAPK, Hog1 and Fus3, respectively. Despite sharing components, these pathways are
initiated by distinct inputs and produce distinct cellular behaviors. To understand how these
responses are coordinated, we monitored the pheromone response during hyperosmotic
conditions. We show that hyperosmotic stress limits pheromone signaling in at least three ways.
First, stress delays the expression of pheromone-induced genes. Second, stress promotes the
phosphorylation of a protein kinase, Rck2, and thereby inhibits pheromone-induced protein
translation. Third, stress promotes the phosphorylation of a shared pathway component, Ste50,
and thereby dampens pheromone-induced MAPK activation. Whereas all three mechanisms are
dependent on an increase in osmolarity, only the phosphorylation events require Hog1. These
findings reveal how an environmental stress signal is able to postpone responsiveness to a
competing differentiation signal, by acting on multiple pathway components, in a coordinated
Introduction
Eukaryotic cells commonly employ mitogen activated protein kinases (MAPKs) to
transduce extracellular signals and evoke intracellular responses (Johnson and Lapadat
2002). MAPKs are a part of an evolutionarily-conserved three-tiered signaling cascade
comprised of the MAPK, a MAPK kinase (MAPKK), and a MAPKK kinase (MAPKKK). In
mammalian cells MAPKs respond to diverse stimuli including hormones, stresses, and
cytokines. The regulation of MAPKs in mammalian cells is complex. Multiple inputs can
activate an individual MAPK. Thus understanding how competing signals are integrated
by multiple MAPKs is often obscured by pathway complexity (Qi and Elion 2005).
MAPK pathways are also present in the unicellular eukaryote budding yeast,
Saccharomyces cerevisiae. As in higher eukaryotes, yeast use MAPK pathways to
respond to a variety of environmental signals (Chen and Thorner 2007). The two
best-characterized examples are the mating pathway and the high osmolarity glycerol (HOG)
response pathway (detailed in Figure 2.1A) (Dohlman and Thorner 2001; Hohmann
2002). The mating pathway operates through a cell-surface receptor that activates a
canonical G protein heterotrimer. The activated G protein recruits Ste5, a scaffold protein
that assembles and activates the three component kinases: Ste11, Ste7 and the MAPK
Fus3 (Pryciak and Huntress 1998; Elion 2001). Active Fus3 promotes events leading to
cell fusion including new gene transcription, cell cycle arrest and cytoskeletal
rearrangements (Chang and Herskowitz 1990; Roberts et al. 2000; Yu et al. 2008). High
osmotic stress activates Ste11 as well as Pbs2 and the MAPK Hog1 (Tatebayashi et al.
2006). Active Hog1 promotes events leading to stress adaptation including increased
glycerol production, cell cycle arrest and a pause in protein translation (Belli et al. 2001;
Escote et al. 2011). Individually, the two pathways have well-defined components,
known points of regulation, and established measures of pathway output. Together, the
pathways form a signaling network that is a model for the study of signal integration.
The mating and HOG pathways share several components, yet exhibit
remarkable signal fidelity when stimulated individually (Figure 2.1, highlighted in green).
Hyperosmotic stress does not activate Fus3 or promote mating, and mating pheromones
do not activate Hog1 or the HOG pathway. Such pathway fidelity may be maintained by
two mechanisms: (i) pathway insulation and (ii) cross-pathway inhibition (Schwartz and
Madhani 2004). The pathway insulation model proposes that physical sequestration of
components maintains specificity. For example, Ste11 exists in two scaffolded pools,
one that selectively activates Fus3 and another that selectively activates Hog1 (Harris et
al. 2001). The cross-pathway inhibition model proposes that one pathway inhibits
signaling by the competing pathway. For example, Hog1 is required to prevent the
inadvertent activation of the mating response by hyperosmotic stress. When Hog1 is
absent, or rendered catalytically inactive, hyperosmotic stress promotes mating. Thus it
appears that Hog1 targets a component of the mating pathway to maintain fidelity (Hall
et al. 1996; O'Rourke and Herskowitz 1998; Westfall and Thorner 2006; Patterson et al.
2010). However, previous studies were unsuccessful in identifying the substrate(s) of
Hog1 in the mating pathway.
In this study, we determine how cells prioritize responses when confronted with
two competing stimuli. Towards this end we co-stimulated yeast cells with mating
pheromone and hyperosmotic stress, and then measured the mating response over
time. We observed that the mating response is delayed and dampened by hyperosmotic
stress in a Hog1 dependent manner. We found further that Hog1 dampens mating by
(Ste50) and (ii) feed-forward phosphorylation of a negative regulator of translation
(Rck2). Thus, Hog1 employs cross-pathway inhibition to delay the mating differentiation
response. Mating differentiation resumes once cellular osmotic balance is restored and
cross-pathway inhibition is relieved. These studies provide a model of how a cell
prioritizes competing signals to ensure proper differentiation.
Results
Hyperosmotic stress delays the mating response
A hallmark of the mating response is the appearance of a mating projection
(shmoo formation), which functions as the eventual site of cell-cell fusion (Ydenberg and
Rose 2008). A hallmark of the osmotic stress response is a rapid but transient reduction
in cell volume. This reduction occurs as water leaves the cell in order to equalize internal
and external osmolarity. The cell then ramps up glycerol production to restore osmotic
balance and cell volume (Reed et al. 1987). A shift in the osmotic equilibrium can also
cause severe mating defects, and it was reported previously that efficient cell-cell fusion
requires osmotic balance across the cell membrane (Philips and Herskowitz 1997).
Here we investigated how an increase in extracellular osmolarity impinges on
processes leading to fusion. Recent publications have examined the cell response
following co-stimulation with pheromone and hyperosmotic stress, but these papers
reached opposing conclusions (Johnson and Lapadat 2002; McClean et al. 2007;
Patterson et al. 2010). Both reports relied primarily on transcription-reporter assays
conducted at a single time point. However, as detailed herein, hyperosmotic stress
conditions can have confounding effects on transcription-reporter activity, particularly at
early time points. As an alternative we determined the effect of co-stimulation on multiple
cell differentiation, mating MAPK production, and MAPK activation over a period of
several hours.
We first investigated how hyperosmotic stress affects pheromone-induced shmoo
formation. To determine whether these responses are mutually exclusive, or are
compatible but occur sequentially. We stimulated cells with a saturating concentration of
mating pheromone (α factor), or co-stimulated cells with pheromone and an osmolyte
(KCl) to invoke hyperosmotic stress. We then visualized and quantified shmoo formation
over time by microscopy. As shown in Figure 2.1B, the addition of mating pheromone
resulted in detectable shmoo formation by 60 minutes, with 60% of cells forming shmoos
by 180 minutes. The simultaneous addition of osmolyte resulted in detectable shmoo
formation only after 120 minutes, with just 20% of cells forming shmoos by 180 minutes.
Addition of higher concentrations of osmolyte, 0.75 M (Figure 2.1B) or 1 M KCl (data not
shown), further delayed shmoo formation. These results demonstrate that hyperosmotic
stress delays the mating response and that the duration of delay is dependent on the
severity of stress.
The data presented above reveal that salt stress delays shmoo formation. We
then considered whether there was a delay in other aspects of the pheromone response.
To this end we monitored Far1. Far1 is induced by pheromone only during the G1 phase
of the cell cycle, is required for cell polarization during mating, and is quickly degraded
as cells exit G1 (McKinney et al. 1993; Valtz et al. 1995; Oehlen et al. 1996; Henchoz et
al. 1997). Thus, Far1 is a broad indicator of cellular events leading up to mating. Addition
of mating pheromone alone resulted in detectable Far1 by 60 minutes, while
co-stimulation with 0.75 M KCl delayed Far1 induction to 120 minutes (Figure 2.1C). These
findings indicate that the delay in shmoo formation corresponds with a delay in Far1
Figure 2.1. Hyperosmotic stress delays mating differentiation.
evident at the molecular level as well as at the level of cellular morphogenesis.
Hyperosmotic stress dampens and delays transcriptional reporter activity
Hyperosmotic stress activates Hog1 and induces genes required for adaptation
(Rep et al. 2000). During the immediate response to stress however, there is transient
repression (< 5 min) of overall gene transcription (Proft and Struhl 2004). Moreover the
duration of the delay correlates with the concentration of osmolyte and is prolonged in
cells that lack Hog1 (Rep et al. 1999; Proft and Struhl 2004). Thus, transcription is
regulated by Hog1-dependent and Hog1-independent mechanisms. We postulated that
hyperosmotic stress might delay mating in part through a transient repression of
transcription. Indeed, we have already shown that Far1 expression is delayed by salt
stress; however Far1 abundance is also subject to stimulus-dependent ubiquitination
and degradation (Henchoz et al. 1997). To focus specifically on mating gene induction
we used a reporter comprised of the β-galactosidase gene fused to the FUS1 promoter
(FUS1-lacZ). The FUS1 gene is among the most strongly induced genes during the
mating response (Roberts et al. 2000). As shown in Figure 2.2, cells stimulated with
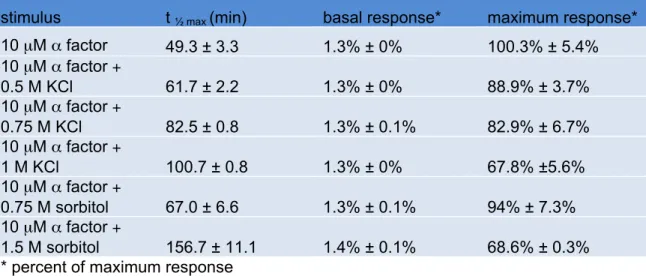
mating pheromone reached half maximum (t½ max) β-galactosidase activity at roughly 50
minutes (Figure 2.2A and Table 2.1). The addition of 0.75 M KCl increased the t½ max by
~ 67% and dampened the maximum response by ~ 17%. The effects of salt were
dose-dependent; with increasing concentrations the delay and dampening became
progressively more pronounced.
To distinguish Hog1-dependent and Hog1-independent effects on the
transcription response, we measured FUS1 induction in cells lacking HOG1 (hog1Δ) as
well as in cells expressing a catalytically inactive mutant, Hog1K52R. These cells were
Figure 2.2 Hyperosmotic stress delays and dampens mating transcription.
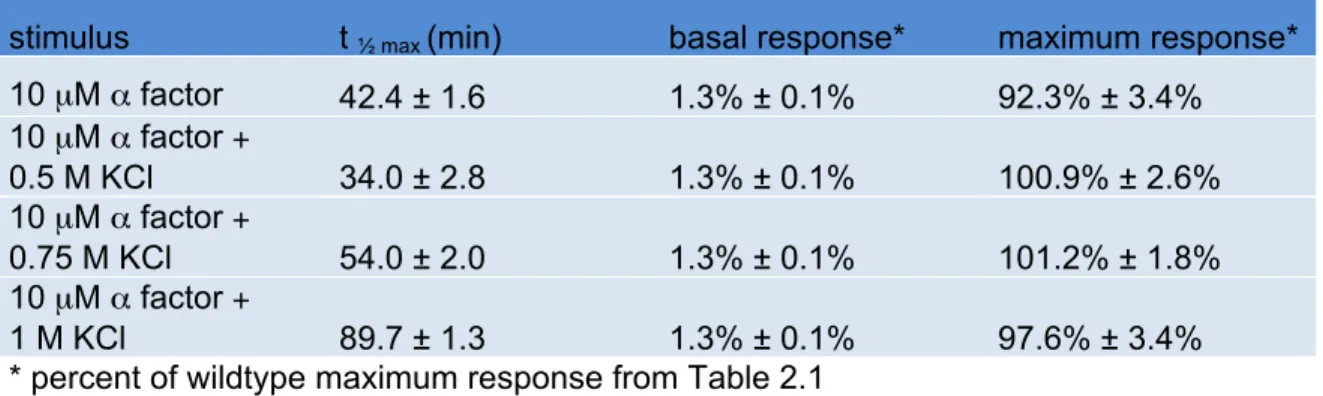
Table 2.1. Wildtype α factor response time course; see Figure 2.2
stimulus t ½ max (min) basal response* maximum response* 10 µM α factor 49.3 ± 3.3 1.3% ± 0% 100.3% ± 5.4% 10 µM α factor +
0.5 M KCl 61.7 ± 2.2 1.3% ± 0% 88.9% ± 3.7% 10 µM α factor +
0.75 M KCl 82.5 ± 0.8 1.3% ± 0.1% 82.9% ± 6.7% 10 µM α factor +
1 M KCl 100.7 ± 0.8 1.3% ± 0% 67.8% ±5.6% 10 µM α factor +
0.75 M sorbitol 67.0 ± 6.6 1.3% ± 0.1% 94% ± 7.3% 10 µM α factor +
wildtype cells, co-stimulation of hog1Δ cells increased the t½ max for FUS1 induction
(Figure 2.2B and Table 2.2). However, unlike wildtype cells, co-stimulation of hog1Δ cells
did not dampen the maximum response. Thus Hog1 contributes to the reduction in
transcription response. Also, the change in t½ max was less pronounced in hog1Δ cells
compared to wildtype cells, suggesting that Hog1 is at least partly responsible for the
delay in mating transcription (Table 2.2). Similar results were seen in Hog1K52R cells
(Figure 2.2C and Table 2.3). The non-ionic osmolyte sorbitol acted much like KCl (Figure
2.2D and Table 2.1). Taken together these results support the view that osmotic stress
attenuates mating transcription, and does so by Hog1-dependent and Hog1-independent
mechanisms.
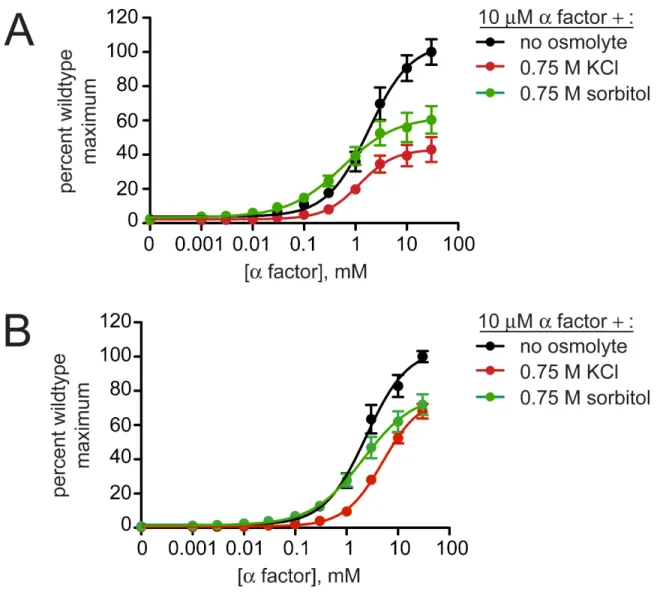
Hyperosmotic conditions do not disrupt pheromone-receptor interactions
High concentrations of any osmolyte could disrupt protein-protein interactions
raising the concern that salt conditions might disrupt binding of a peptide pheromone to
its receptor. Binding can be assessed by determining the effective pheromone
concentrations that give half-maximum response (EC50). We determined the EC50 of
pheromone with the addition of KCl or sorbitol by measuring FUS1-lacZ activity (Figure
2.3 and Table 2.4). To distinguish between cells undergoing stress-adaptation from
those that are fully adapted, we determined the EC50 near the t½ max (90 min) and also
after 180 minutes (Figure 2.2A). In this comparison we found no significant differences in
EC50. Thus hyperosmotic stress does not diminish sensitivity to pheromone.
Hyperosmotic stress dampens mating MAPK activation
Mating pheromones activate Fus3 and induce the transcription of genes required
for haploid cell fusion. We have observed that Hog1 dampens mating transcriptional
Table 2.2. hog1Δ α factor response time course; see Figure 2.2
stimulus t ½ max (min) basal response* maximum response* 10 µM α factor 42.4 ± 1.6 1.3% ± 0.1% 92.3% ± 3.4% 10 µM α factor +
0.5 M KCl 34.0 ± 2.8 1.3% ± 0.1% 100.9% ± 2.6% 10 µM α factor +
0.75 M KCl 54.0 ± 2.0 1.3% ± 0.1% 101.2% ± 1.8% 10 µM α factor +
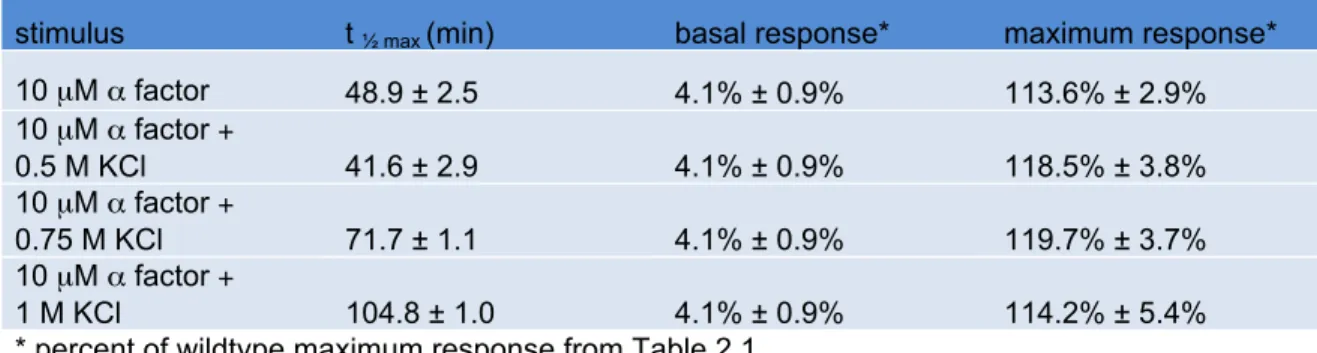
Table 2.3. Hog1K52R
α factor response time course; see Figure 2.2
stimulus t ½ max (min) basal response* maximum response*
10 µM α factor 48.9 ± 2.5 4.1% ± 0.9% 113.6% ± 2.9% 10 µM α factor +
0.5 M KCl 41.6 ± 2.9 4.1% ± 0.9% 118.5% ± 3.8% 10 µM α factor +
0.75 M KCl 71.7 ± 1.1 4.1% ± 0.9% 119.7% ± 3.7% 10 µM α factor +
Figure 2.3. High osmolarity has minor effects on pheromone sensitivity.
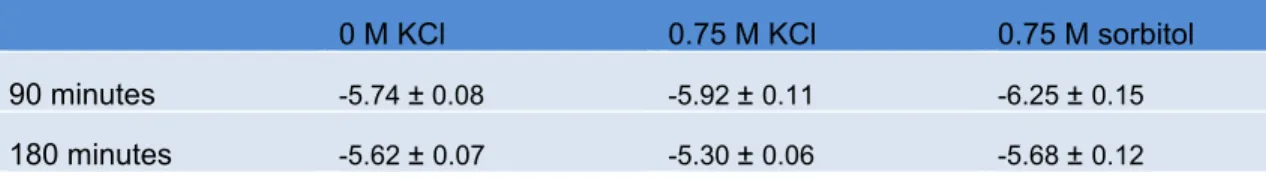
Table 2.4. Wildtype α factor dose response log EC50, M; see Figure 2.3
0 M KCl 0.75 M KCl 0.75 M sorbitol
90 minutes -5.74 ± 0.08 -5.92 ± 0.11 -6.25 ± 0.15
directly, by immunoblotting with an antibody that recognizes the dually-phosphorylated,
fully-active form of the kinase (phospho-Fus3) (Sabbagh et al. 2001). As shown in Figure
2.4, co-stimulation with KCl reduced phospho-Fus3 by one-third compared to cells
treated with pheromone alone. Pheromone also induces the expression of the FUS3
gene (Roberts et al. 2000; Hilioti et al. 2008). To determine the effect of KCl on Fus3
production we quantified Fus3 protein levels with a Fus3-specific antibody. As with
phospho-Fus3, total Fus3 was reduced by one third in co-stimulated cells. Thus
hyperosmotic stress leads to dampened induction of Fus3 and a concomitant reduction
in phospho-Fus3. We then conducted the same experiment in cells lacking Hog1 (Figure
2.4B). In this case, we found no effect of salt co-stimulation on phospho-Fus3 or Fus3.
These data indicate that Hog1 regulates mating by dampening Fus3 production and,
consequently, Fus3 activity. Thus Hog1 has a role in limiting gene induction and mating,
and may do so by targeting a component downstream of Fus3.
Fus3 is part of a positive feedback loop: the activation of Fus3 by mating
pheromone leads to induction of more Fus3, which is subsequently activated by
pheromone. Hog1 may regulate mating at two points in the pathway; downstream of the
MAPK by limiting Fus3 induction or upstream by limiting Fus3 activation. To exclude any
effect of hyperosmotic stress on Fus3 induction we replaced the native
(pheromone-inducible) promoter with the galactose-regulated GAL1 promoter. As expected, we found
that cells grown in galactose stably express Fus3, with no induction in the presence of
pheromone. Unexpectedly however, co-stimulation with salt reduced phospho-Fus3 to
nearly one-half of that in cells treated with pheromone alone, even as Fus3 abundance
remained unchanged (Figure 2.5A). In contrast, co-stimulation did not alter
phospho-Fus3 in the absence of Hog1 (Figure 2.5B), except for a reduction at the earliest (5 min)
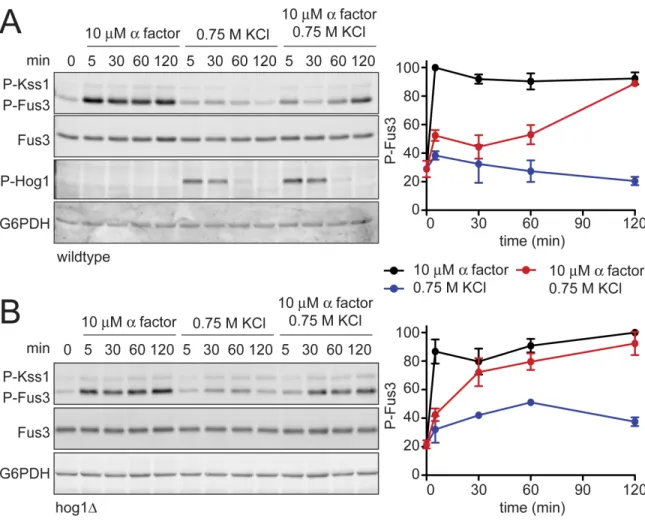
Figure 2.5. Hyperosmotic stress dampens Fus3 activation in a Hog1 dependent manner.
(A) Activation kinetics of Fus3 and Hog1; wildtype cells transformed with plasmid-borne GAL1-FUS3 were grown in SC and 2% galactose followed by stimulation with 10 mM α factor, 0.75 M KCl, or co-stimulation with 10 mM α factor + 0.75 M KCl. Cell lysates were resolved by 12.5% SDS-PAGE. P-Fus3 and P-Kss1 were detected with phospho-p44/p42 antibodies. P-Hog1 was detected with phospho-p38 antibodies. Total Fus3 and Hog1 were detected with Fus3 and Hog1 antibodies. G6PDH served as a loading control. All primary antibodies were recognized by fluorescently labeled secondary antibody, detected by fluorescence scanner (Typhoon Trio) and quantified by scanning densitometry (ImageJ). The panel to the right shows averaged scanning densitometry of four individual experiments. Error bars represent ± SEM. Co-stimulation dampened P-Fus3 by 47.6% ± 2.2% at 5 minutes and 47.5% ± 6.6% at 30 minutes. (B)
The reduction at early time points is evident with or without Hog1, while the reduction at
later time points (30 and 60 minutes) is Hog1-dependent (Figures 2.2 and 2.5). These
results establish that active Hog1 is responsible for disrupting the activation of Fus3, that
the disruption is transient, and that full Fus3 activation resumes once cells have adapted
to hyperosmotic conditions. Moreover, these data indicate a role for Hog1 in limiting
events leading to mating, and may do so by targeting a component upstream of Fus3.
Constitutively active Hog1 dampens mating MAPK activation
Together our results show that cells utilize dependent and
Hog1-independent mechanisms to adapt to hyperosmotic stress. To focus exclusively on
Hog1-dependent mechanisms we activated the kinase directly, without an osmolyte. To
this end we introduced a constitutively active MAPKKK, Ssk2ΔN (Maeda et al. 1995;
Wurgler-Murphy et al. 1997). Ssk2 is a component of the SLN1-branch of the HOG
pathway and is not shared with the mating pathway. Thus expression of Ssk2ΔN
activates Hog1 but does not affect Fus3 directly. First, we measured the effect of
constitutively-activated Hog1 on pheromone-activated Fus3 over time (Figure 2.6A).
Under these conditions Fus3 activation was reduced by up to 50%, comparable to the
reduction observed with KCl (Figure 2.4A). Hog1 also limited expression of total Fus3
protein. As an additional control we tested mutants lacking Hog1 expression or Hog1
catalytic activity. In this case we observed no change in phospho-Fus3 or Fus3
abundance (Figure 2.6B). Thus Fus3 can be regulated by Hog1 even in the absence of
hyperosmotic stress. Together these results reveal that Hog1 activation is necessary
and sufficient to dampen Fus3 activation.
As noted above, induction of Fus3 can confound any analysis of Fus3 activation.
Figure 2.6. Constitutively active Hog1 dampens Fus3 activation and induction. (A) Activation kinetics of Fus3 with constitutively active Hog1; wildtype cells transformed with vector control or plasmid-borne GAL1-SSK2ΔN were grown in SC media
with 2% raffinose (Raf). Ssk2ΔN expression was induced by addition of 2% galactose for 60 min followed by addition of 3 mM α factor for 30 minutes. Cell lysates were resolved by 12.5% SDS-PAGE. P-Fus3 and P-Kss1 were detected with phospho-p44/p42 antibodies. P-Hog1 was detected with phospho-p38 antibodies. Total Fus3 and Hog1 were detected with Fus3 and Hog1 antibodies. G6PDH served as a loading control. All primary antibodies were recognized by fluorescently labeled secondary antibody and quantified, detected by fluorescence scanner (Typhoon Trio) and quantified by scanning densitometry (ImageJ). The panels to the right show averaged scanning densitometry of four individual experiments. Error bars represent ± SEM. P-Hog1 reduced P-Fus3 by 49.4% ± 6.7% at 120 minutes. (B) Wildtype, hog1D,and, hog1K52R cells transformed with
GAL1-SSK2ΔN or parent vector control were grown in SC and 2% galactose for 60 min
followed by addition of 3 mM α factor or left untreated for 30 min. (C) fus3D cells transformed with ADH1-FUS3 and GAL1-SSK2ΔN or vector were grown and stimulated
as in B. P-Hog1 reduced P-Fus3 by 30.7% ± 3.2%. (D) rck2D cells transformed with
we replaced the native promoter with the strong constitutive promoter from ADH1
(ADH1-Fus3). Under these conditions, constitutively active Hog1 reduced phospho-Fus3
by about one-third, somewhat less than the one-half reduction obtained in cells with the
native FUS3 promoter (Figure 2.6C). Thus Hog1 dampens Fus3 activation, even when
expression is permanently elevated. When Fus3 is expressed from the native promoter,
activation is dampened even further. These findings confirm that Fus3 induction and
Fus3 phosphorylation are diminished by at least two distinct mechanisms that require
Hog1. One mechanism acts upstream and modulates Fus3 activation, while another
mechanism acts downstream and dictates Fus3 induction. Together these processes
lead to cross-inhibition of mating upon an increase in osmolarity.
Rck2 is phosphorylated by Hog1 to limit mating signal during co-stimulation
We then sought to establish the mechanisms of cross-pathway inhibition, and
began with the target of Hog1 that limits Fus3 production. The induction of Fus3 requires
transcription of the FUS3 gene and translation of the corresponding mRNA. Hog1
phosphorylates and activates the protein kinase, Rck2 (Bilsland-Marchesan et al. 2000).
Activated Rck2 phosphorylates the yeast elongation factor, EF2, and thereby transiently
represses translation (Teige et al. 2001). Thus we considered whether Rck2 regulates
the production of Fus3 under osmotic stress conditions. To test the hypothesis, we
constitutively activated Hog1 in the absence of RCK2, and in the presence or absence of
pheromone (Figure 2.6D). Under these conditions, constitutively active Hog1 reduced
phospho-Fus3 by about one-third, somewhat less than the one-half reduction obtained in
cells that express Rck2 (compare Figures 2.6B and 2.6D). Thus Rck2 is partially
responsible for the diminished Fus3 response. Taken together these results suggest that
Figure 2.7. Hog1 dampens Fus3 activation by targeting Ste50.
Constitutive activators of mating pathway highlighted in black: (A) Ste5CTM, a C-terminal transmembrane domain (CTM) tethers Ste5 to the plasma membrane allowing MAPK activation without receptor or G-protein. (B) Wildtype cells transformed with
GAL1-STE5CTM, GAL1-SSK2ΔN or parent vector controls were grown in 2% galactose for
60 min followed by addition of 3 mM α factor or left untreated for 30 min. Cell lysates were resolved by 12.5% SDS-PAGE. Statistical significance was calculated using two-way ANOVA. ***, p < 0.001. (C) Ste11ΔN, constitutively active amino-terminus truncation mutant of Ste11, allowing activation without binding the upstream activator Ste20 or adaptor Ste50. (D) Wildtype cells transformed with GAL1-STE11ΔN, GAL1-SSK2ΔN or
vector were grown in 2% galactose for 2.5 hrs followed by addition of 3 mM α factor or left untreated for 30 min. Statistical significance was calculated using two-way ANOVA, ns – not significant, p > 0.05. (E) Wildtype and ste505A cells grown and treated as in B.
broadly these results provide evidence that translational repression of Fus3 contributes
to decreased pheromone responsiveness following hyperosmotic stress.
Ste50 is phosphorylated by Hog1 to limit mating signal during co-stimulation
The data presented above indicate that Hog1 limits Fus3 activity in two ways.
First, Hog1 phosphorylates Rck2 and suspends translation of one or more mating
pathway components. We have also presented evidence that Hog1 inhibits an upstream
activator of the mating MAPK. To identify the second target of Hog1 we employed a
genetic epistasis approach. First we determined if constitutively active Hog1 dampens
the mating pathway at the level of the three-tiered MAPK cascade. The mating signal is
typically initiated by the recruitment of the MAPK scaffold Ste5 to the plasma membrane.
Ste5 can be tethered permanently to the plasma membrane via fusion to a
carboxy-terminal transmembrane domain (CTM), thus bypassing the need for pheromone,
receptor, and G protein in pathway activation (Figure 2.7A) (Pryciak and Huntress 1998).
In cells that co-express GAL1-STE5CTM and GAL1-SSK2ΔN, phospho-Fus3 was
dampened, similar to that seen with pheromone and GAL1-SSK2ΔN(Figure 2.7B). These
data indicate that Hog1 acts on a component downstream of the G protein. We likewise
observed dampening of phospho-Kss1, which is also activated by pheromone. These
data suggest that the putative Hog1 target is upstream of both Fus3 and Kss1. Taken
together these results narrowed the likely target to a handful of components associated
with Ste5: the MAPKKK Ste11, its adaptor protein Ste50, its activators Cdc42 and Ste20,
and its substrate Ste7 (Figure 2.1A).
Ste50 is required for full activation of Hog1, Fus3, and Kss1. We and others have
demonstrated that Hog1 phosphorylates Ste50 during hyperosmotic conditions.
et al. 2008b; Yamamoto et al. 2010). Given this precedent, we hypothesized that
phosphorylation of Ste50 leads to the downregulation of Fus3 and Kss1. To test the role
of Ste50, we activated the mating pathway using a truncated form of Ste11; Ste11ΔN
lacks the kinase auto-inhibitory domain (Cairns et al. 1992), and also lacks the Ste50
binding domain (Figure 2.7C) (Xu et al. 1996). Thus Ste11ΔN is both constitutively active
and refractory to Ste50. As shown in Figure 2.8, Ste50 is not required for pathway
activation by Ste11ΔN even while it is required for full activation by Ste5CTM. We had
postulated that Fus3 activity is dampened when Ste50 is phosphorylated. Accordingly,
Fus3 should not be affected by Hog1 or Ste50 when the pathway is activated through
Ste11ΔN (Figure 2.7D). Under these conditions, Fus3 is fully activated, consistent with
our prediction. Taken together these data suggest that Hog1 limits the mating signal at
the level of Ste50. The mating and hyperosmotic stress signals are integrated by Ste50,
which in turn regulates the shared MAPKKK, Ste11.
Finally we sought to establish whether phosphorylation of Ste50 by Hog1 was
responsible for cross-pathway inhibition. To this end we used a mutant of Ste50
(Ste505A) where five MAPK sites have been changed to alanine, thereby abrogating
phosphorylation by Hog1 (Hao et al. 2008b; Yamamoto et al. 2010). Consistent with our
prediction Ste505A restored the ability of pheromone to activate Fus3, even under
conditions of constitutive Hog1 activation (Figure 2.7E). Fus3 was not fully activated
however, presumably because Hog1 could still target Rck2. When we deleted RCK2
from the Ste505A strain we were able to attain full activation of Fus3 (Figure 2.7F and
Figure 2.9). Thus Hog1 limits mating through the phosphorylation of at least two
proteins. We have identified these targets as Ste50 and Rck2. More generally, these
results reveal that cross-inhibition occurs through a combination of feedback and
Figure 2.8. Ste50 is required for full activation of the pheromone pathway.
Wildtype or ste50Δ cells transformed with either GAL1-STE5CTM or GAL1
Figure 2.9. Rck2 and Ste50 limit mating MAPK activation and induction.
Discussion
All cells have the ability to detect changes in their environment and to produce
responses appropriate to that stimulus. Our focus here was on two signals that may
produce incompatible responses; one that triggers mating differentiation and a second
that promotes adaptation to hyperosmotic stress. More specifically, we investigated the
ability of yeast cells to coordinate responses to mating pheromones and high salt. We
found that in co-stimulated cells, adaptation to hyperosmotic stress takes precedence.
Stress adaptation suspends mating.
Prior to our investigations, it was established that Hog1 activation is proportional
to the severity of the hyperosmotic stress (Macia et al. 2009). Furthermore, the duration
of Hog1 activation is tightly correlated with glycerol production and a return to osmotic
equilibrium (Muzzey et al. 2009). Thus, adaptation to hyperosmotic stress dictates the
duration and level of Hog1 activity. Our results support a model where Hog1 suspends
the mating response until cells are fully adapted. Consistent with this model we found
that Hog1 dampens and delays Fus3 activation, and that the duration of delay is
proportional to the severity of the hyperosmotic stress. Just as transient activation of
Hog1 leads to transient inhibition of Fus3, persistent activation of Hog1 leads to
persistent inhibition of Fus3 (Figure 2.6A).
Hog1 regulates Fus3 activation and induction.
It was established previously that osmotic stress results in global inhibition of
transcription. In cells that lack Hog1, transcription initiation is delayed further (Proft and
Struhl 2004). These results point to a Hog1-independent mechanism of transcription
regulation. Paradoxically, cells that lack Hog1 exhibit a stress-mediated increase in the
limiting the mating pathway. However the Hog1-independent effects of hyperosmotic
stress confounded the interpretation of data. Thus we sought to understand how Hog1
regulates Fus3, apart from any processes that might affect Fus3 induction. This was
achieved by (i) constitutive expression of Fus3 (via promoter replacement) and (ii) direct
activation of Hog1 (via Ssk2ΔN). Ultimately these approaches led us to identify Ste50 and
Rck2 as principal targets of Hog1.
Hog1 phosphorylates Ste50 to limit Fus3 activation.
Ste50 is a shared component, required for activation of Ste11, that acts early in
the mating and osmotic stress pathways. Thus Ste50 is well positioned to coordinate the
activity of both Fus3 and Hog1. Moreover, Ste50 is phosphorylated by Hog1 and as a
consequence of this phosphorylation there is an attenuated response to hyperosmotic
stress (Hao et al. 2008b; Yamamoto et al. 2010). Here we show that as an additional
consequence of Ste50 phosphorylation there is an attenuated response to pheromone.
These effects are most evident at the level of the mating MAPKs, Fus3 and Kss1. In
cells co-stimulated with salt, Ste50 phosphorylation dampens pheromone-dependent
activation of both Fus3 and Kss1. Whereas the phosphorylation of Ste50 fully accounts
for cross-inhibition of Kss1, it is only partially responsible for cross-inhibition of Fus3.
Consequently we searched for additional mechanisms of signal integration that act on
Fus3 but not Kss1. Given that Fus3 is induced by pheromone - whereas Kss1 is not - we
considered whether salt stress inhibits Fus3 at the level of its transcription or translation.
Hog1 phosphorylates Rck2 to limit Fus3 production.
It was established previously that Hog1 directly phosphorylates and activates a
repressor of translation elongation, Rck2 (Bilsland-Marchesan et al. 2000). When Rck2
is absent, translation repression is abrogated (Teige et al. 2001). Accordingly, we found