Advance Access publication 2017 June 17
A study of high-redshift AGN feedback in SZ cluster samples
L. Bˆırzan,
1‹D. A. Rafferty,
1M. Br¨uggen
1and H. T. Intema
21Hamburger Sternwarte, Universit¨at Hamburg, Gojenbergsweg 112, D-21029 Hamburg, Germany
2Leiden Observatory, Leiden University, Oort Gebouw, PO Box 9513, NL-2300 RA Leiden, the Netherlands
Accepted 2017 June 13. Received 2017 June 8; in original form 2017 March 27
A B S T R A C T
We present a study of active galactic nucleus (AGN) feedback at higher redshifts (0.3<z< 1.2) using Sunyaev–Zel’dovich selected samples of clusters from the South Pole Telescope and Atacama Cosmology Telescope surveys. In contrast to studies of nearby systems, we do not find a separation between cooling flow (CF) clusters and non-CF clusters based on the radio luminosity of the central radio source (cRS). This lack may be due to the increased incidence of galaxy–galaxy mergers at higher redshift that triggers AGN activity. In support of this scenario, we find evidence for evolution in the radio-luminosity function of the cRS, while the lower luminosity sources do not evolve much, the higher luminosity sources show a strong increase in the frequency of their occurrence at higher redshifts. We interpret this evolution as an increase in high-excitation radio galaxies (HERGs) in massive clusters at z>0.6, implying a transition from HERG-mode accretion to lower power low-excitation radio galaxy (LERG)-mode accretion at intermediate redshifts. Additionally, we use local radio-to-jet power scaling relations to estimate feedback power and find that half of the CF systems in our sample probably have enough heating to balance cooling. However, we postulate that the local relations are likely not well suited to predict feedback power in high-luminosity HERGs, as they are derived from samples composed mainly of lower luminosity LERGs.
Key words: galaxies: active – galaxies: clusters: general – galaxies: clusters: intracluster medium – galaxies: elliptical and lenticular, cD – radio continuum: general – X-rays: galax-ies: clusters.
1 I N T R O D U C T I O N
The co-evolution of galaxies and their supermassive black holes (SMBH) is a key ingredient in our understanding of how the
present-day universe came to be. SMBHs interact with (orfeedbackon) their
host galaxies via the energetic emission from an active galactic nu-cleus (AGN), powered by accretion of matter on to the SMBH. A breakthrough in this topic occurred with the discovery that the masses of SMBHs correlate with the properties of their host galax-ies, specifically those of the bulge (see the review of Kormendy &
Ho2013). Luminous AGN feedback, in which AGN quench the star
formation (SF) in post-starburst galaxies through energetic winds, and the averaging of SMBH masses (inherited in galaxy and SMBH mergers) are natural candidates for the underlying cause of these
correlations (Silk & Rees 1998; Fabian, Celotti & Erlund2006;
Fabian2012; Kormendy & Ho2013). It is thought that luminous
AGN feedback might help to establish these correlations during the wet major-merger stage in galaxy evolution, which makes the classical bulges in low- to moderate-luminosity elliptical galaxies. However, another mode of AGN feedback, in which the AGN output
E-mail:[email protected]
is dominated by mechanical energy, is likely one of the processes
that maintains these correlations (Fabian2012).
In the nearby universe, direct observational evidence for me-chanical AGN feedback comes from observations of giant elliptical galaxies, groups and clusters which contain large amounts of hot gas. This discovery was made possible by a new generation of X-ray instruments with high sensitivity and spatial and spectral
resolution, namely theChandraandXMM–Newtonobservatories.
Data from these instruments showed X-ray cavities or bubbles filled with radio emission, which include notable examples as Perseus
(Fabian et al. 2000), Hydra A (McNamara et al.2000), A2052
(Blanton et al. 2001), M87 (Forman et al. 2005), MS0735+74
(McNamara et al.2005) among many others (Bˆırzan et al.2004;
Dunn & Fabian2004; Rafferty et al.2006; Bˆırzan et al.2012).
Ad-ditionally, these data show a lack of spectroscopic evidence for gas
cooling below 2 keV (Peterson et al.2001).
The existence of such feedback alleviates a long-standing prob-lem in cluster studies known as the cooling flow (CF) probprob-lem
(Fabian1994). In the initially proposed scenario by Fabian (1994),
the gas is heated up to 107K by the initial gravitational collapse
when clusters form. In the centre of clusters, where the density is high and the temperature is low, the cooling time can be less
that a ‘CF’ should form, in which gas cools and flows inward in quasi-hydrostatic equilibrium. However, searches for the high-mass deposition rates predicted by this model have found that cooling seems to be proceeding at much lower rates than predicted (e.g.
Peterson et al.2001). Instead of steady cooling throughout the core,
it appears that cooling occurs primarily as a result of local cooling
instabilities, regulated by feedback (e.g. Voit et al.2016).
Studies of samples of systems with X-ray cavities found a strong correlation between the mechanical power injected into the
hot gas by the AGN through cavities (i.e. the 4pV enthalpy of
the buoyantly rising cavities) and the cooling rates of this gas
(Bˆırzan et al.2004; Dunn & Fabian2004; Rafferty et al. 2006).
From this evidence, it was postulated that the AGN are heat-ing the gas and regulatheat-ing coolheat-ing through a feedback loop. This
process is known as thejet-mode, maintenance-mode, or
radio-mode AGN feedback and is commonly observed in the nearby
universe, where no significant brightest cluster galaxy (BCG) growth typically occurs. In jet-mode AGN feedback, the accre-tion rate is thought to be well below the Eddington limit, with the bulk of the energy released in kinetic form by two-sided radio-bright jets. Galaxies with such AGN tend to be low-excitation radio galaxies (LERGs), based on the presence of weak, narrow,
low-ionization emission lines (Hine & Longair1979; Hardcastle,
Evans & Croston2006,2007; Best & Heckman2012). LERGs may
be powered by hot-mode accretion, when the material falls directly on to the SMBH through accretion of clumps of gas (known as the
cold feedback mechanism, Pizzolato & Soker2005; Soker2006;
Pizzolato & Soker2010; Gaspari, Ruszkowski & Sharma2012;
Gaspari, Brighenti & Temi2015; McCourt et al. 2012; Sharma
et al.2012; Li et al.2015; Prasad, Sharma & Babul2015; Voit et al.
2015,2016), with no accretion disc to ionize (see also observational
support from Rafferty, McNamara & Nulsen2008; Cavagnolo et al.
2011; Farage, McGregor & Dopita2012; McNamara et al.2014).
SF is an important ingredient in the feedback process because, as the gas cools down, some of it should to go to fuel SF (through residual cooling). There are several pieces of evidence for this residual cooling, such as the observed correlation between the ob-served star formation rates (SFRs) and the residual cooling rates
(McNamara & O’Connell1989; Koekemoer et al.1999; McNamara,
Wise & Murray 2004; Rafferty et al.2008; O’Dea et al. 2008;
Donahue et al. 2010; Hicks, Mushotzky & Donahue 2010;
McDonald et al.2011; Oonk et al. 2011; Donahue et al. 2015;
Fogarty et al.2015; Mittal, Whelan & Combes2015; Tremblay
et al.2015,2016). Cooling should occur when the central cooling
time (or entropy, or the ratio of cooling to dynamical time) becomes low enough that thermally unstable condensing clouds form from
the hot atmosphere (Rafferty et al.2008; Voit et al.2008; Sharma
et al.2012; Gaspari et al.2012; Voit & Donahue2015; Voit et al.
2015; Guo & Mathews2014; Brighenti, Mathews & Temi2015;
Valentini & Brighenti2015; Prasad et al. 2015). X-ray cavities
likely have an important role in uplifting some of the cooling gas
from the cluster centre (Simionescu et al.2008; Werner et al.2010,
2011; Kirkpatrick, McNamara & Cavagnolo2011; Vantyghem et al.
2016; Russell et al.2016), and there is evidence that the soft X-ray
gas cools and forms Hαemission and cold molecular clouds in a
filamentary structure (McDonald et al.2010; Werner et al.2014;
Tremblay et al.2015; McNamara et al.2014,2016; Fabian et al.
2016).
The feedback process is expected to operate in CFs. The cooling time in the core is a basic selection criterion for the cooling systems: if the central cooling time of a system is smaller than its age,
which is typically a significant fraction of theHubbletime, then
one expects that this system needs heating to prevent cooling (see
Bˆırzan et al.2012; Panagoulia, Fabian & Sanders2014a; Panagoulia
et al.2014b). Additionally, as mentioned above, the ratio of cooling
time to free-fall time has proved to be a sensitive indicator of the presence of cooling, both in observations and simulations (e.g. Voit
et al.2008; Bˆırzan et al.2012; Sharma et al.2012; Li et al.2015).
However, many of the details of AGN feedback are missing from this picture or are poorly understood (e.g. how the energy is trans-ported to cluster scales, either through weak shocks, turbulence,
mixing, sound waves or cosmic rays; Zhuravleva et al.2014,2016;
Banerjee & Sharma2014; Wagh, Sharma & McCourt2014; Hillel
& Soker2014,2017; Yang & Reynolds2016; Fabian et al.2017;
Tang & Churazov 2017; Pfrommer 2013; Ruszkowski, Yang &
Reynolds2017). Additionally, there are few direct studies of
feed-back in clusters at high redshifts (z>0.5).
1.1 AGN feedback at higher redshifts
The question of how much heating is produced by AGN at higher redshifts is important since it is at these redshifts that the bulk of galaxy and cluster formation occurred and, consequently, that the effects of AGN feedback were likely most instrumental in shaping them. On the cooling side, there is evidence of evolution in the
cuspiness of the density profile (Donahue, Stocke & Gioia1992;
Vikhlinin et al. 2007; Santos et al. 2010; Samuele et al.2011;
McDonald et al.2011,2013b) sincez∼1. However, recent results
from the SPT–SZ survey (Carlstrom et al.2011; Bleem et al.2015)
do not find evidence of evolution in the cooling properties of the
intracluster medium (ICM) in the redshift range 0.3<z<1.2, only
in the cuspiness (McDonald et al.2017).
On the heating side, there is little evidence for evolution in jet-mode AGN feedback in the general population of radio-loud (RL)
AGN using deep-field surveys up toz∼1.3, suggesting that
jet-mode feedback starts to operate as early as 7 Gyr after big bang
and does not change since (e.g. Simpson et al.2013), thus
main-taining the same approximate balance between AGN heating and
radiative cooling as in the local universe (Best et al.2006). The
only direct study of jet-mode feedback in higher redshift systems was done by Hlavacek-Larrondo et al. (2012) using the MAssive
Cluster Survey (MACS) sample and reached only to redshifts ofz∼
0.5. Other studies of AGN feedback at high redshift (Lehmer et al.
2007; Smolˇci´c et al.2009; Danielson et al.2012; Ma, McNamara &
Nulsen2013; Best et al.2014) rely on indirect methods of inferring
AGN feedback powers, such as scaling relations between the jet
(mechanical) power and the radio luminosity (Bˆırzan et al.2004,
2008; Cavagnolo et al.2010; O’Sullivan et al.2011; Daly et al.
2012; Antognini, Bird & Martini2012; Godfrey & Shabala2013).
Until recently, the majority of complete cluster samples were
X-ray flux-limited samples, e.g. the B55 (Edge et al.1990),
HI-FLUGCS (Reiprich & B¨ohringer2002), and REFLEX (B¨ohringer
et al. 2004) samples. However, recently a number of Sunyaev–
Zel’dovich (SZ) surveys have been undertaken, such as the
Ata-cama Cosmology Telescope (ACT; Fowler et al.2007; Marriage
et al.2011; Hasselfield et al.2013), South Pole Telescope (SPT;
Carlstrom et al.2011; Reichardt et al.2013; Bleem et al.2015),
andPlanck(Planck Collaboration XXIX2014) surveys. The main advantages of SZ surveys is that the SZ signal is independent of
redshift (Song et al.2012; Reichardt et al.2013) and is closely
re-lated to the cluster mass with very little scatter (Motl et al.2005).
Consequently, these surveys have identified the most massive
clus-ters up to and beyond redshifts of∼1, and thus are important for
understanding the high-redshift universe.
criteria (i.e. mass versus X-ray flux), allowing us to identify poten-tial biases. For example, it is known that at higher redshift (above
0.5)∼50 per cent of radio-loud quasars (RLQs), and other powerful
radio galaxies, are located in rich clusters of galaxies (Yee & Green
1987; Yates, Miller & Peacock1989; Hall & Green1998; Hill &
Lilly1991). These powerful sources may obscure the thermal
signa-ture of the ICM and result in incomplete X-ray flux-limited cluster samples.
In this paper, we use the SPT and ACT SZ cluster samples to
study AGN feedback atz>0.3. These samples are well studied at
a variety of wavelengths and have extensive archivalChandradata,
making them ideally suited to our purposes. In addition to archival
Chandradata, we use radio data from Sydney University Molonglo Sky Survey (SUMSS) and NRAO VLA Sky Survey (NVSS, plus targeted GMRT observations for a small subsample) and SFRs from
McDonald et al. (2016). We assumeH0=70 km s−1Mpc−1,=
0.7, andM=0.3 throughout.
2 S A M P L E
Our sample consists of 99 systems with archivalChandradata from
the SZ surveys of the southern and equatorial sky (SPT and ACT;
Carlstrom et al.2011; Fowler et al.2007). The SPT survey covers
an area of 2500 deg2, with 677 cluster candidates above a
signal-to-noise threshold of 4.5 (Ruel et al.2014; Bleem et al.2015), which
represents a mass-limited sample (∼80 per cent complete atM>
5×10¹⁴M
) to arbitrarily large distances. From this sample, the
80 cluster candidates with the highest SZ-effect detection
signifi-cance have been observed withChandra, through aChandraX-ray
Visionary Project (PI: Benson) or other GO/GTO programmes (e.g.
PI: Mohr, Romer), resulting in∼2000 counts per system. To this
sample of 80 clusters, we added a number of other SPT systems
which have archivalChandradata (e.g. RDCS J0542−4100, PI:
Ebeling; RXC J0232.2−4420, PI: B¨ohringer). We did not include
SPT-CL J0330−5228 (z=0.44), since the clusters A3125/A3128
(z=0.06) are in the foreground, and SPT-CL J0037−5047 (z=
1.026) because of insufficient counts in the X-ray data.
The ACT SZ survey is a sample of 91 systems (∼90 per cent
complete atM>5×10¹⁴ M
) from within a nearly 1000 deg2
area (Hasselfield et al.2013), identified during the 2008 (southern
survey; Marriage et al.2011), 2009 and 2010 (equatorial survey;
Hasselfield et al.2013) campaigns. Of these, 18 clusters with the
most significant SZ-effect detections were observed withChandra
(PI: Hughes). As with the SPT clusters, the exposure times were
such as to obtain∼2000 counts per system (or a minimum of 20–30
ks). In addition to these systems, we added four extra ACT
clus-ters that hadChandraobservations: ACT-CL J0326−0043 (MACS
J0326−0043; PI: Ebeling), ACT-CL J0152−0100 (A267; PI:
Vanspeybroeck), ACT-CL J2337−0016 (A2631; PI: Bonamente),
and ACT-CL J2129−0005 (RXC J2129.6+0005; PI: Allen).
We note that recent simulations (Lin et al.2015) have shown that
SZ observations can be biased by the presence of a cool core and a RL AGN, in the sense that a cool core increases the SZ signal and an RL AGN decreases it. However, such biases are expected to be
small overall in SZ samples (Lin et al.2015; Gupta et al.2016).
In summary, we have constructed a sample of 99 massive
south-ern and equatorial clusters with∼2000 X-ray counts per system.
These data allow us to obtain reliable temperature and pressure
profiles (see also McDonald et al.2013b) to achieve our goal of
understanding the state of the system, such as its cooling time (see Section 3), and, along with complementary radio data, the impact of AGN feedback.
3 DATA A N A LY S I S
3.1 X-ray analysis
All systems were observed with the ChandraACIS detector in
imaging mode, and the X-ray data were obtained from theChandra
Data Archive. Details of the observations are given in Table1.
TheChandradata were reprocessed withCIAO4.8 using CALDB 4.7.2 and were corrected for known time-dependent gain and charge transfer inefficiency problems. Blank-sky background files, normal-ized to the count rate of the source image in the 10–12 keV band,
were used for background subtraction.1
Analysis of the X-ray data closely followed that of Rafferty et al. (2008) and Bˆırzan et al. (2012). However, in contrast to these works, where 2000 counts per spectrum were commonly used, in this sam-ple we have only 2000 counts in total for a majority of the systems. As a result, to obtain spectra at least two radii, the X-ray spectra
were extracted in circular annuli with as low as∼750 counts
cen-tred on the centroid of the cluster emission. The lower number of counts results in larger errors on the derived quantities, but not so large that they are not useful in assessing the state of the system. A majority of the systems have at least three radial bins, except for
10 systems, marked in Table1(in thekTcolumn), which have two
bins only. In some systems, due to the diffuse nature of the cluster emission or to substructure, the centroid of the X-ray emission was
difficult to identify precisely. These systems are noted in Table1
(in the X-ray-core column). Spectra and their associated weighted
responses were made for the annuli usingCIAOand were fit inXSPEC
version 12.5.1.
Gas temperatures and densities (listed in Table1) were found by
deprojecting the spectra with a single-temperature plasma model
(MEKAL) with a foreground absorption model (WABS) using the
PROJECT mixing model. In this fit, we fixed the redshift to those
listed in Table 2, the hydrogen column density to the value of
Dickey & Lockman (1990) at the cluster position, and the
abun-dance of theMEKALcomponent to be at least 0.3 times the solar
abundance (see Mernier et al.2017). Our central values are typically
within a factor of two of the central values reported by McDonald et al. (2013b), with larger discrepancies attributable to differences in the annuli and deprojection techniques between our study and theirs.
We derived the cooling times using the deprojected densities and temperatures found above and the cooling curves of Smith et al.
(2001). The pressure in each annulus was calculated asp=nkT,
where we have assumed an ideal gas andn=2ne. To derive densities
as close to the core as possible, we used the onion-peel deprojection method described in Rafferty et al. (2008). This method assumes that changes in the surface brightness (SB) within this region are dominated by changes in the density. Therefore, the temperature and abundance of the gas are assumed to be constant in the inner region used in spectral deprojection. We then extrapolated the den-sity profile inward using the SB profile, accounting for projection effects under the assumption of spherical symmetry. The SB
pro-files were derived in annuli with a width of 10 pixels (≈4.9), with
typical annulus containing∼100 counts.
Within the cooling radius, radiative energy losses must be re-placed to prevent the deposition of large quantities of cool gas. Therefore, to assess whether a system has enough energy to bal-ance cooling, ones needs the luminosity of the cooling gas in-side the cooling radius. To be consistent with previous works (e.g.
Ta b le 1 . X-ray p roperties. Obs. ID b t c X-ray core (J2000) d kT e ne f r g ( kT ) h tcool i tcool (10 kpc) j
tcool tff
Ta b le 1 – continued Obs. ID b t c X-ray core (J2000) d kT e ne f r g ( kT ) h tcool i tcool (10 kpc) j
tcool tff
Ta b le 1 – continued Obs. ID b t c X-ray core (J2000) d kT e ne f r g ( kT ) h tcool i tcool (10 kpc) j
tcool tff
Ta b le 1 – continued Obs. ID b t c X-ray core (J2000) d kT e ne f r g ( kT ) h tcool i tcool (10 kpc) j
tcool tff
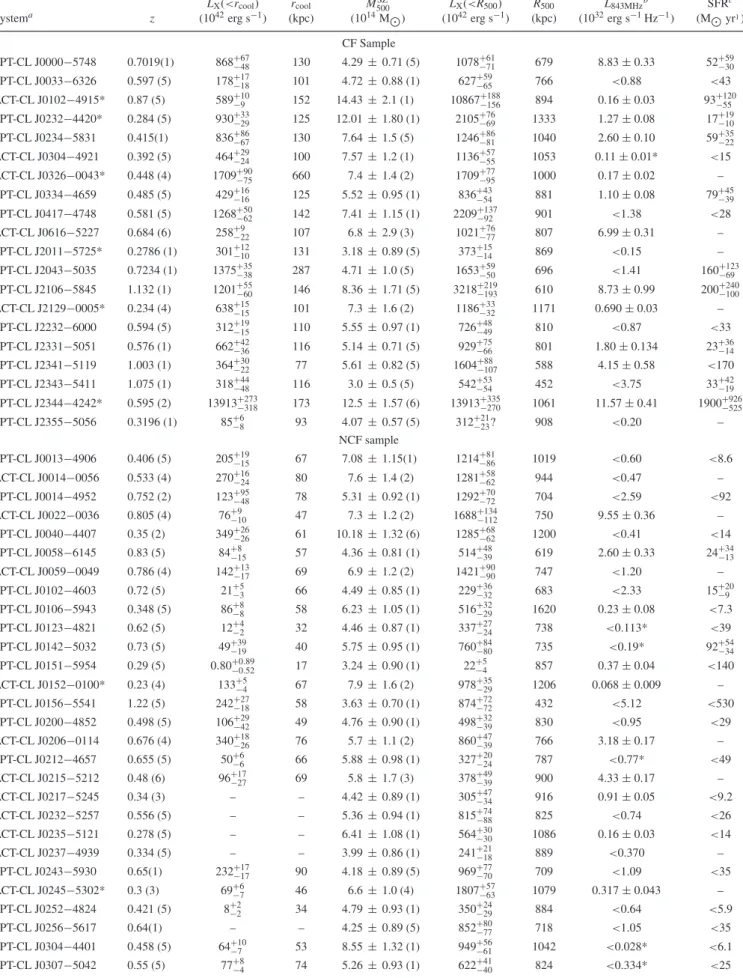
Table 2. Cluster and cRS properties.
LX(<rcool) rcool MSZ
500 LX(<R500) R500 L843MHzb SFRc
Systema z (1042erg s−1) (kpc) (1014M
) (1042erg s−1) (kpc) (1032erg s−1Hz−1) (M
yr1) CF Sample
SPT-CL J0000−5748 0.7019(1) 868+−6748 130 4.29±0.71 (5) 1078+−6171 679 8.83±0.33 52+−5930 SPT-CL J0033−6326 0.597 (5) 178+−1718 101 4.72±0.88 (1) 627+−5965 766 <0.88 <43 ACT-CL J0102−4915* 0.87 (5) 589+−109 152 14.43±2.1 (1) 10867+−188156 894 0.16±0.03 93+−12055 SPT-CL J0232−4420* 0.284 (5) 930+−3329 125 12.01±1.80 (1) 2105+−7669 1333 1.27±0.08 17+−1910 SPT-CL J0234−5831 0.415(1) 836+−8667 130 7.64±1.5 (5) 1246+−8681 1040 2.60±0.10 59+−3522 ACT-CL J0304−4921 0.392 (5) 464+−2924 100 7.57±1.2 (1) 1136+−5755 1053 0.11±0.01* <15 ACT-CL J0326−0043* 0.448 (4) 1709+−9075 660 7.4±1.4 (2) 1709+−7795 1000 0.17±0.02 – SPT-CL J0334−4659 0.485 (5) 429+−1616 125 5.52±0.95 (1) 836+−4354 881 1.10±0.08 79+−4539 SPT-CL J0417−4748 0.581 (5) 1268+−5062 142 7.41±1.15 (1) 2209+−13792 901 <1.38 <28 ACT-CL J0616−5227 0.684 (6) 258+−922 107 6.8±2.9 (3) 1021+−7677 807 6.99±0.31 – SPT-CL J2011−5725* 0.2786 (1) 301+−1210 131 3.18±0.89 (5) 373+−1514 869 <0.15 – SPT-CL J2043−5035 0.7234 (1) 1375+−3538 287 4.71±1.0 (5) 1653+−5950 696 <1.41 160+
123
−69
SPT-CL J2106−5845 1.132 (1) 1201+−5560 146 8.36±1.71 (5) 3218+−219193 610 8.73±0.99 200+−240100 ACT-CL J2129−0005* 0.234 (4) 638+−1515 101 7.3±1.6 (2) 1186+−3332 1171 0.690±0.03 – SPT-CL J2232−6000 0.594 (5) 312+−1915 110 5.55±0.97 (1) 726+−4849 810 <0.87 <33 SPT-CL J2331−5051 0.576 (1) 662+−4236 116 5.14±0.71 (5) 929+−7566 801 1.80±0.134 23+−3614 SPT-CL J2341−5119 1.003 (1) 364+−3022 77 5.61±0.82 (5) 1604+
88
−107 588 4.15±0.58 <170
SPT-CL J2343−5411 1.075 (1) 318+−4448 116 3.0±0.5 (5) 542+−5354 452 <3.75 33+−4219 SPT-CL J2344−4242* 0.595 (2) 13913+−273318 173 12.5±1.57 (6) 13913+−335270 1061 11.57±0.41 1900+−926525 SPT-CL J2355−5056 0.3196 (1) 85+−68 93 4.07±0.57 (5) 312+−2123? 908 <0.20 –
NCF sample
SPT-CL J0013−4906 0.406 (5) 205+−1915 67 7.08±1.15(1) 1214+−8186 1019 <0.60 <8.6 ACT-CL J0014−0056 0.533 (4) 270+−1624 80 7.6±1.4 (2) 1281+−5862 944 <0.47 – SPT-CL J0014−4952 0.752 (2) 123+−9548 78 5.31±0.92 (1) 1292+−7072 704 <2.59 <92 ACT-CL J0022−0036 0.805 (4) 76+−910 47 7.3±1.2 (2) 1688+−134112 750 9.55±0.36 – SPT-CL J0040−4407 0.35 (2) 349+−2626 61 10.18±1.32 (6) 1285+−6862 1200 <0.41 <14 SPT-CL J0058−6145 0.83 (5) 84+−815 57 4.36±0.81 (1) 514+−4839 619 2.60±0.33 24+−3413 ACT-CL J0059−0049 0.786 (4) 142+−1317 69 6.9±1.2 (2) 1421+−9090 747 <1.20 – SPT-CL J0102−4603 0.72 (5) 21+−53 66 4.49±0.85 (1) 229+−3632 683 <2.33 15+−209 SPT-CL J0106−5943 0.348 (5) 86+−88 58 6.23±1.05 (1) 516+−3229 1620 0.23±0.08 <7.3 SPT-CL J0123−4821 0.62 (5) 12+−42 32 4.46±0.87 (1) 337+−2724 738 <0.113* <39 SPT-CL J0142−5032 0.73 (5) 49+−3919 40 5.75±0.95 (1) 760+−8480 735 <0.19* 92+−5434
SPT-CL J0151−5954 0.29 (5) 0.80+−00..8952 17 3.24±0.90 (1) 22+−54 857 0.37±0.04 <140
ACT-CL J0152−0100* 0.23 (4) 133+−54 67 7.9±1.6 (2) 978+−3529 1206 0.068±0.009 – SPT-CL J0156−5541 1.22 (5) 242+−2718 58 3.63±0.70 (1) 874+−7272 432 <5.12 <530 SPT-CL J0200−4852 0.498 (5) 106+−2942 49 4.76±0.90 (1) 498+−3239 830 <0.95 <29 ACT-CL J0206−0114 0.676 (4) 340+−1826 76 5.7±1.1 (2) 860+−4739 766 3.18±0.17 – SPT-CL J0212−4657 0.655 (5) 50+−66 66 5.88±0.98 (1) 327+−2024 787 <0.77* <49 ACT-CL J0215−5212 0.48 (6) 96+−1727 69 5.8±1.7 (3) 378+−4939 900 4.33±0.17 –
ACT-CL J0217−5245 0.34 (3) – – 4.42±0.89 (1) 305−+4734 916 0.91±0.05 <9.2
ACT-CL J0232−5257 0.556 (5) – – 5.36±0.94 (1) 815+−7488 825 <0.74 <26
ACT-CL J0235−5121 0.278 (5) – – 6.41±1.08 (1) 564−+3030 1086 0.16±0.03 <14
ACT-CL J0237−4939 0.334 (5) – – 3.99±0.86 (1) 241+−2118 889 <0.370 –
SPT-CL J0243−5930 0.65(1) 232+−1717 90 4.18±0.89 (5) 969+−7770 709 <1.09 <35 ACT-CL J0245−5302* 0.3 (3) 69+−67 46 6.6±1.0 (4) 1807+−5763 1079 0.317±0.043 – SPT-CL J0252−4824 0.421 (5) 8+−22 34 4.79±0.93 (1) 350+−2429 884 <0.64 <5.9
SPT-CL J0256−5617 0.64(1) – – 4.25±0.89 (5) 852+−8077 718 <1.05 <35
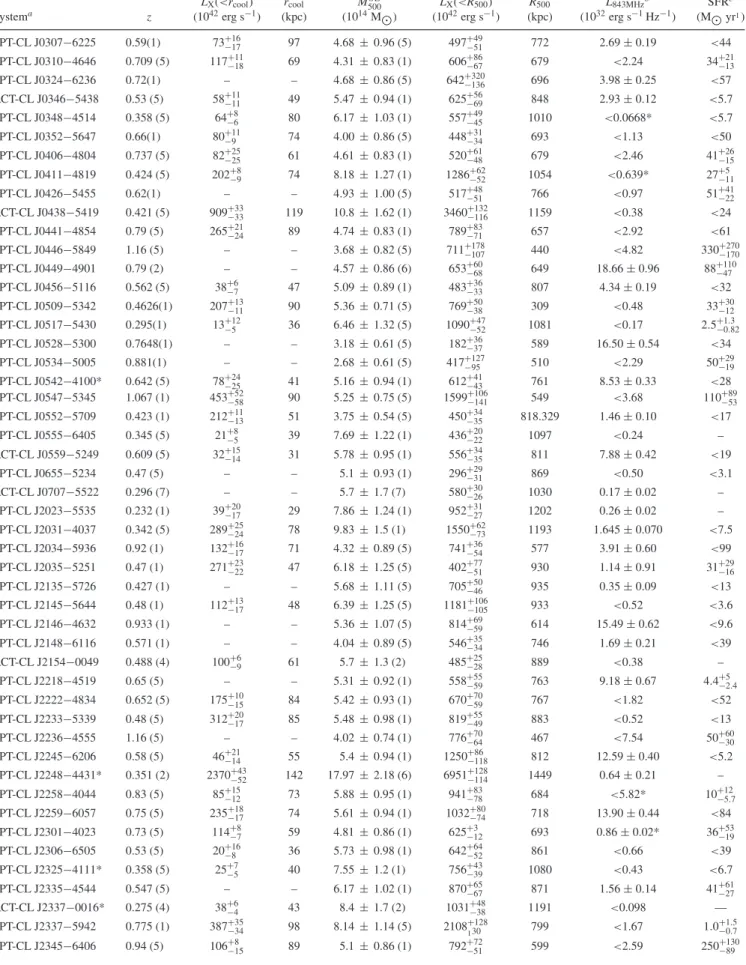
Table 2 –continued
LX(<rcool) rcool M500SZ LX(<R500) R500 L843MHzb SFRc
Systema z (1042erg s−1) (kpc) (1014M
) (1042erg s−1) (kpc) (1032erg s−1Hz−1) (M
yr1) SPT-CL J0307−6225 0.59(1) 73+−1617 97 4.68±0.96 (5) 497+−4951 772 2.69±0.19 <44 SPT-CL J0310−4646 0.709 (5) 117+−1118 69 4.31±0.83 (1) 606+−8667 679 <2.24 34+−2113
SPT-CL J0324−6236 0.72(1) – – 4.68±0.86 (5) 642−+320136 696 3.98±0.25 <57
ACT-CL J0346−5438 0.53 (5) 58+−1111 49 5.47±0.94 (1) 625+−5669 848 2.93±0.12 <5.7 SPT-CL J0348−4514 0.358 (5) 64+−86 80 6.17±1.03 (1) 557+−4945 1010 <0.0668* <5.7 SPT-CL J0352−5647 0.66(1) 80+−119 74 4.00±0.86 (5) 448+−3134 693 <1.13 <50 SPT-CL J0406−4804 0.737 (5) 82+−2525 61 4.61±0.83 (1) 520+−6148 679 <2.46 41+−2615 SPT-CL J0411−4819 0.424 (5) 202+−89 74 8.18±1.27 (1) 1286+−6252 1054 <0.639* 27+−511 SPT-CL J0426−5455 0.62(1) – – 4.93±1.00 (5) 517−+4851 766 <0.97 51+−4122 ACT-CL J0438−5419 0.421 (5) 909+−3333 119 10.8±1.62 (1) 3460+−132116 1159 <0.38 <24 SPT-CL J0441−4854 0.79 (5) 265+−2124 89 4.74±0.83 (1) 789+−8371 657 <2.92 <61 SPT-CL J0446−5849 1.16 (5) – – 3.68±0.82 (5) 711−+178107 440 <4.82 330+−270170 SPT-CL J0449−4901 0.79 (2) – – 4.57±0.86 (6) 653−+6068 649 18.66±0.96 88+−11047 SPT-CL J0456−5116 0.562 (5) 38+−67 47 5.09±0.89 (1) 483+−3633 807 4.34±0.19 <32 SPT-CL J0509−5342 0.4626(1) 207+−1311 90 5.36±0.71 (5) 769+−5038 309 <0.48 33+−3012 SPT-CL J0517−5430 0.295(1) 13+−125 36 6.46±1.32 (5) 1090−+4752 1081 <0.17 2.5+−10..382
SPT-CL J0528−5300 0.7648(1) – – 3.18±0.61 (5) 182−+3637 589 16.50±0.54 <34 SPT-CL J0534−5005 0.881(1) – – 2.68±0.61 (5) 417−+12795 510 <2.29 50+−2919 SPT-CL J0542−4100* 0.642 (5) 78+−2425 41 5.16±0.94 (1) 612+−4143 761 8.53±0.33 <28 SPT-CL J0547−5345 1.067 (1) 453+−5258 90 5.25±0.75 (5) 1599+−106141 549 <3.68 110+−8953 SPT-CL J0552−5709 0.423 (1) 212+−1113 51 3.75±0.54 (5) 450+−3435 818.329 1.46±0.10 <17 SPT-CL J0555−6405 0.345 (5) 21+−85 39 7.69±1.22 (1) 436+−2022 1097 <0.24 – ACT-CL J0559−5249 0.609 (5) 32+−1514 31 5.78±0.95 (1) 556+−3435 811 7.88±0.42 <19
SPT-CL J0655−5234 0.47 (5) – – 5.1±0.93 (1) 296+−2931 869 <0.50 <3.1
ACT-CL J0707−5522 0.296 (7) – – 5.7±1.7 (7) 580+−3026 1030 0.17±0.02 –
SPT-CL J2023−5535 0.232 (1) 39+−2017 29 7.86±1.24 (1) 952+−3127 1202 0.26±0.02 – SPT-CL J2031−4037 0.342 (5) 289+−2524 78 9.83±1.5 (1) 1550+−6273 1193 1.645±0.070 <7.5
SPT-CL J2034−5936 0.92 (1) 132+−1617 71 4.32±0.89 (5) 741+−3654 577 3.91±0.60 <99 SPT-CL J2035−5251 0.47 (1) 271+−2322 47 6.18±1.25 (5) 402+−7751 930 1.14±0.91 31+−2916
SPT-CL J2135−5726 0.427 (1) – – 5.68±1.11 (5) 705−+5046 935 0.35±0.09 <13
SPT-CL J2145−5644 0.48 (1) 112+−1317 48 6.39±1.25 (5) 1181+−106105 933 <0.52 <3.6 SPT-CL J2146−4632 0.933 (1) – – 5.36±1.07 (5) 814−+6959 614 15.49±0.62 <9.6
SPT-CL J2148−6116 0.571 (1) – – 4.04±0.89 (5) 546−+3534 746 1.69±0.21 <39
ACT-CL J2154−0049 0.488 (4) 100+−69 61 5.7±1.3 (2) 485+−2528 889 <0.38 – SPT-CL J2218−4519 0.65 (5) – – 5.31±0.92 (1) 558−+5955 763 9.18±0.67 4.4+−52.4 SPT-CL J2222−4834 0.652 (5) 175+−1015 84 5.42±0.93 (1) 670+−7059 767 <1.82 <52 SPT-CL J2233−5339 0.48 (5) 312+−2017 85 5.48±0.98 (1) 819+−5549 883 <0.52 <13 SPT-CL J2236−4555 1.16 (5) – – 4.02±0.74 (1) 776−+7064 467 <7.54 50+−6030 SPT-CL J2245−6206 0.58 (5) 46+−2114 55 5.4±0.94 (1) 1250+−86118 812 12.59±0.40 <5.2
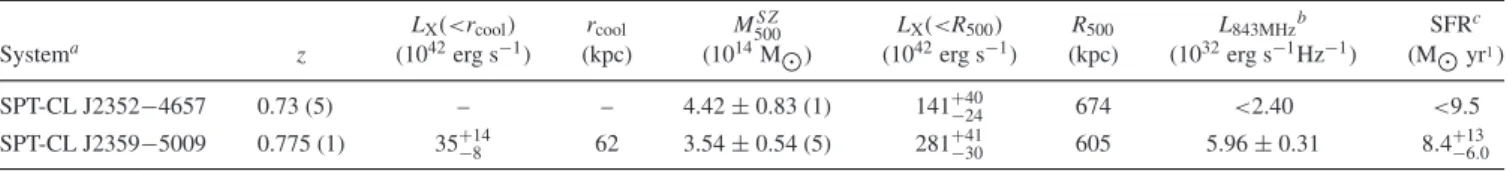
Table 2 –continued
LX(<rcool) rcool M500SZ LX(<R500) R500 L843MHzb SFRc
Systema z (1042erg s−1) (kpc) (1014M
) (1042erg s−1) (kpc) (1032erg s−1Hz−1) (M
yr1)
SPT-CL J2352−4657 0.73 (5) – – 4.42±0.83 (1) 141+−4024 674 <2.40 <9.5
SPT-CL J2359−5009 0.775 (1) 35+−148 62 3.54±0.54 (5) 281−+4130 605 5.96±0.31 8.4+−136.0
References: (1) Bleem et al. (2015); (2) Hasselfield et al. (2013); (3) Hilton et al. (2013); (4) Marriage et al. (2011); (5) Reichardt et al. (2013); (6) Ruel et al. (2014); and (7) Sif´on et al. (2013).
aAlternative names for ACT-CL J0102−4915 (El Gordo); ACT-CL J0152−0100 (A267); SPT-CL J0232−4420 (RXCJ0232.2−4420); ACT-CL J0245−5302
(AS0295); ACT-CL J0326−0043 (MACS J0326−0043); SPT-CL J0542−4100 (RDCS J0542−4100); SPT-CL J2011−5725 (RXCJ2011.3−5725); ACT-CL J2129−0005 (RXJ2129.6+0005); SPT-CL J2248−4431 (AS1063); SPT-CL J2325−4111 (ACOS1121); ACT-CL J2337−0016 (A2631); and SPT-CL J2344−4242 (Phoenix). The asterisk marks systems with uncertain core positions.
bRest-frame monochromatic radio luminosity at 843 MHz using the flux densities from SUMSS (Bock et al.1999), except ACT-CL J0014−0056, ACT-CL
J0022−0036, ACT-CL J0059−0049, ACT-CL J0152−0100, ACT-CL J0206−0114, ACT-CL J2129−0005, ACT-CL J2154−0049, and ACT-CL J2337−0016 where NVSS flux densities were used (Condon et al.1998); ACT-CL J0326−0043 where the FIRST flux density was used (Helfand et al.2015); and for ACT-CL J0102−4915 and ACT-CL J0152−0100 where the GMRT flux density at 610 MHz from Lindner et al. (2014) and Kale et al. (2013), respectively, was used. The systems marked with asterisk are the ones for which we have GMRT data at 325 MHz (Intema et al. in preparation). For SPT-CL J0106−5943, SPT-CL J2135−5726, and SPT-CL J2248−4431, we measured the flux densities from SUMSS images (5.7±1.9 mJy, 5.3±2.5 mJy, and 15.4±4.9 mJy, respectively). The numbers without errors are the upper limit using the noise in the SUMSS or NVSS image: 6–10 mJy beam−1(depending on the declination)
for SUMSS (Mauch et al.2003) and 2.5 mJy beam−1for NVSS (Condon et al.1998). cSFRs from McDonald et al. (2016).
Rafferty et al.2008; Bˆırzan et al.2012), we define the cooling
ra-dius as the rara-dius within which the gas has a cooling time less than
7.7×10⁹yr. To find the total luminosity inside the cooling radius,
we performed the deprojection using a single-temperature model, extracting the spectra in annuli matched to this cooling radius (i.e.
the outer radius of one annulus falls on the cooling radius). Table1
gives the values oftcooland Table2gives the values ofrcool and
LX(<rcool). However, in some cases, it was not possible to measure
a cooling region and an X-ray luminosity (e.g. for faint, diffuse clusters that are likely non-cooling flow(NCF) clusters).
Furthermore, we also fit the bolometric luminosity inside the
R500region,LX(<R500), and these values are listed in Table2.R500
is defined as the region at which the mean mass density is 500 times
the critical density at that cluster redshift (see Pratt et al.2009). We
calculatedR500using the masses,M500, derived from the SZ signal
YSZ(Reichardt et al.2013; Hasselfield et al.2013; Hilton et al.2013;
Bleem et al.2015).2
3.2 Cooling flow clusters
We investigated three different diagnostics to identify the CF sys-tems in our sample: central cooling time, the minimum thermal instability and the ratio of cooling time to free-fall time. Each of these diagnostics should be sensitive to the presence of gas that is unstable to cooling.
To calculate the central cooling times, we used the deprojection technique described in Section 3.1. The minimum radius at which we could derive reliable cooling times depends on the central SB
(see Table1for the radius of the inner annulus used in the
deprojec-tion). Since we want to compare the cooling times for all the systems at a single physical radius, as close as possible to the nucleus, we computed the cooling time at 10 kpc using the SB profiles to ex-trapolate the densities inward (see Section 3.1). For some systems, the extrapolation did not work well, as the SB profile is too noisy or drops towards the centre or there is significant substructure that is inconsistent with the deprojection method (i.e. systems with large
2R
500=(500ρcM500(z)4π/3)1/3, withρ(z)=h (z)23H2
0
8πG andh(z)2=M(1+z)3+
.
SB errors, see Section 3.6). For these systems, we did not calculate a cooling time at 10 kpc, and these are the ones with missing values
fortcool(10 kpc) in Table1.
Additionally, we calculated the central temperature drop for each system, since the temperature is expected to drop towards the centre in a CF cluster. We calculated the drop as the ratio between the high-est temperature in the profile and the temperature of the innermost
annulus. Table1lists the temperature drop values for all systems.
Some systems have no entry since the temperature profile increases towards the centre, or the profile was too noisy and the temperature drop value was insignificant within errors. Generally, the calculated temperature drop depends on the size of the innermost annulus. However, the temperature typically varies slowly with radius, so variations in the size of the annuli should not affect our estimates significantly. We note that the temperature drop is not used in this paper as a criterion to separate the CF systems from NCF systems. An alternative way to select CFs is based on the thermal stability
of the gas (Voit et al.2008,2016; Sharma et al.2012).Voit et al.
(2008) found that SF and Hαemissions (and hence cooling) seem to
occur only if, at some location in the cluster, the following condition is met:
ηmin=min
κT
(T)nenHr2
∼ f1 c
5, (1)
where (T) is the cooling function calculated using the APEC
spectral model (Smith et al.2001), andfcis the factor by which the
magnetic field suppresses the conductivity below theSpitzervalue.
Assuming that the effective thermal conductivity can be expressed
as a multiple,fc, of theSpitzervalue, this parameter provides a
mea-sure of the stability of the gas to local cooling. For large values of
ηmin, thermal conduction overwhelms radiative cooling, preventing
local cooling throughout the ICM. For small values of this param-eter, local cooling can run away, so that some regions of the ICM may cool to low temperatures, resulting in a multiphase medium and the deposition of the cooled gas.
If the AGN are fuelled by the cooled ICM, a process known in
literature as the cold feedback mechanism (Pizzolato & Soker2005,
2010), chaotic feedback (Gaspari, Ruszkowski & Oh2013; Gaspari
et al. 2015) or precipitation (Voit & Donahue 2015; Voit et al.
occur. Voit et al. (2008) found that values ofηmin 5 correspond
approximately to an inner cooling time of 5×10⁸yr.
Recently, the multiphase threshold has been interpreted as result-ing from the couplresult-ing between conduction and thermal instability
(for a review, see Voit et al.2016), since simulations have shown
that thermal instability can produce a multiphase medium when the
ratio of cooling time to free-fall time is10 (McCourt et al.2012;
Sharma et al.2012; Gaspari et al.2012). There are 22 systems in our
sample which meet this multiphase threshold. Additionally, we find
that a multiphase threshold oftcool/tff10 corresponds to a central
cooling time oftcool(10 kpc) 2×10⁹ yr andηmin 10, with
two exceptions: SPT-CL J2248−4431 and ACT-CL J0438−5419,
wheretcool(10 kpc)>2×10⁹yr. These two systems show
elon-gated X-ray morphologies, with higher central temperatures, and therefore may have gone through a merger recently. The 20 systems
withtcool/tff10,tcool(10 kpc)2×10⁹yr andηmin10 are our
sample of CF systems (see Section 4.3). Furthermore, there are eight
intermediate systems withtcool(10 kpc)2×10⁹yr, buttcool/tff>
10, and four systems withtcool(10 kpc)>2×10⁹yr,tcool/tff>10,
butηmin∼10.
Our sample of 20 CF systems is smaller than that of McDonald et al. (2013b), who identified 29 CF systems through their short
central cooling times (a cooling time of the inner bin109yr) from
a similar parent sample. Our CF sample and the McDonald et al. (2013b) CF sample have 13 systems in common. Among the seven systems that are only in our CF sample, four systems were not analysed in the McDonald et al. (2013b) sample (e.g. some ACT systems); for the remaining three, McDonald et al. (2013b) did not find a short cooling time (e.g. El Gordo). For eight of the 16 CF systems that appear in the McDonald et al. (2013b) CF sample but not in ours, we obtain higher inner temperatures than those from the extrapolation used in McDonald et al. (2013b) The remaining eight systems are either borderline CFs or have large errors in their X-ray profiles.
3.3 Radio properties
The SPT and ACT southern sources are covered at 843 MHZ by the
SUMSS (Bock, Large & Sadler1999). The ACT galactic sources
are covered by the NVSS at 1.4 GHz (Condon et al.1998). For
ACT-CL J0326−0043, we use the flux density at 1.4 GHz from the Faint
Images of the Radio Sky at Twenty-cm (FIRST) survey (Helfand,
White & Becker2015), as the central source and an unrelated source
at∼80 kpc separation are blended together in the NVSS image
(see Fig.1). For ACT-CL J0102−4915 (El Gordo) and ACT-CL
J0152−0100, we use the flux density from deep GMRT images at
610 MHz (Lindner et al.2014; Kale et al.2013). Additionally, for the
following systems, we have obtained targeted GMRT observations at 325 MHz with integration times of 5.5 h per target (Intema et al. in
preparation): SPT-CL J0123−4821, SPT-CL J0142−5032, SPT-CL
J0212−4657, CL J0304−4401, ACT-CL J0304−4514,
SPT-CL J0307−5042, SPT-CL J0348−4514, SPT-CL J0411−4819,
SPT-CL J2031−4037, SPT-CL J2258−4044, and SPT-CL
J2301−4023. These observations were made between 2014 May
and November, and were reduced with theSPAMpackage (Intema
et al.2009; Intema2014).
We searched the radio images for evidence of a central radio source (cRS). We consider a source to be a cRS if the peak of the
emission lies within a radius of 2of the BCG optical core (when
more than one BCG is present, we use the BCG that lies closest to the
cluster X-ray core). The 2radius corresponds to the approximate
positional accuracy of NVSS and SUMMS for sources with flux
densities typical of those in our sample (15 mJy at the frequency
of the survey Condon et al.1998; Bock et al.1999), and equates to
uncertainties of∼8–20 kpc for our sample, depending on the
red-shift of the source. Since this radius is typically within the envelope of the BCG and chance superposition of an unassociated source
within this radius is unlikely (<0.001, Cavagnolo et al.2008), we
do not expect significant contamination by non-cRSs. In total, 46 sources in our sample have a detected cRS (two of which were found in our targeted GMRT observations: SPT-CL J2301−4023
and ACT-CL J0304−4921; see Figs1and2).
Table2lists the rest-frame 843 MHz monochromatic radio
lumi-nosities for the cRSs, calculated as follows:
L843MHz=4πDL2S843GHz(1+z)α−1, (2)
whereαis the spectral index assumingSν∼ν−αandS843MHzis the
(observed-frame) flux density at 843 MHz. Since no spectral index information was available for the sources in our sample, a value of 1.0 was adopted.
For the systems with no detected cRS, Table2lists the upper
lim-its from the SUMSS, NVSS, and GMRT images. The 5σsensitivity
limits of the SUMSS images are 6–10 mJy beam−1, depending on
the declination (Mauch et al.2003). For the NVSS catalogue, the
5σsensitivity limit is 2.5 mJy beam−1at 1400 MHz (Condon et al.
1998), which implies a limit of 4.5 mJy beam−1at our reference
fre-quency of 843 MHz for a source withα=1. For our GMRT images
at 325 MHz, we obtained 5σsensitivities of 1–40 mJy beam−1
(In-tema et al. in preparation), giving limits as low as 0.4 mJy beam−1
at 843 MHz.
We note that some sources may have a radio mini-halo in addition
to the cRS (e.g. Mittal et al.2009), and recently it was found that
radio mini-haloes are common in massive CF clusters up toz<0.35
(Giacintucci et al.2017). For example, in SPT-CL J2344−4242 (the
Phoenix cluster), van Weeren et al. (2014) found a probable radio mini-halo. Other systems also have diffuse relic emission at the periphery of the cluster (e.g. ACT-CL J0102−4915, also known as
El Gordo, has a double radio relic, Lindner et al.2014; Botteon
et al.2016), and based on the SUMSS images, there might be other
sources with possible relic emission (see Section 3.5).
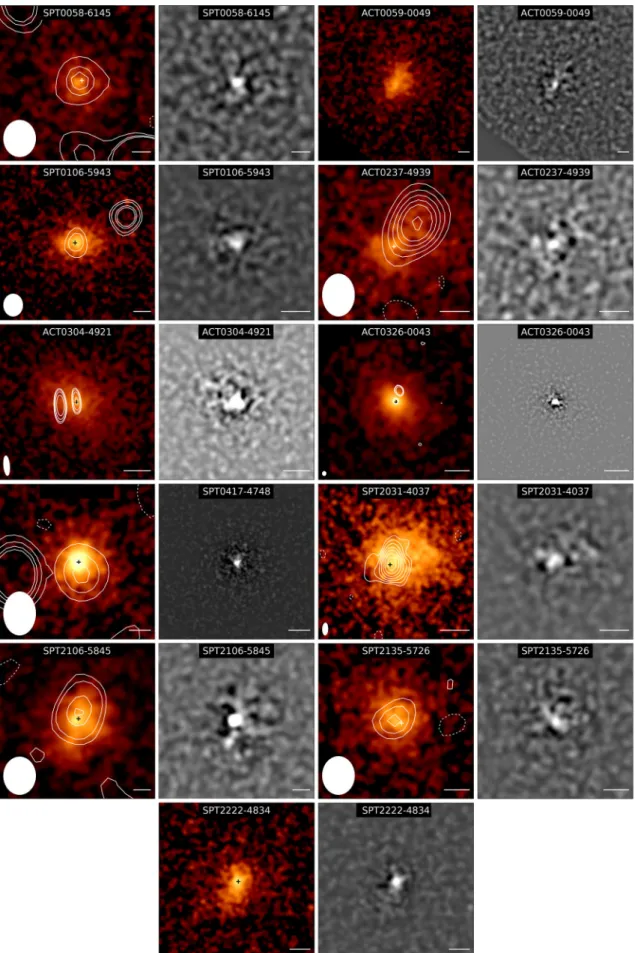
3.4 Systems with possible cavities
McDonald et al. (2013a) have shown that there are cavities in the Phoenix cluster, and Hlavacek-Larrondo et al. (2015) used unsharp-masking techniques to identify possible cavities in seven other SPT clusters. Through visual inspection of the X-ray images, we found
evidence for significant structure in 11 systems (see Fig.1). For
these systems, we made unsharp-masked images to make any such structure more evident. Among the CF sample, there are possible
cavities in SPT-CL J2106−5845 atz=1.132,3which has an
S-like enhancement of X-ray emission, possibly due to X-ray cavities which lie along an axis with a small angle to the line of sight
(see also NGC4636, Baldi et al.2009). Alternatively, such an
arm-like structure could arise from turbulence driven by core sloshing
(Ahoranta et al.2016). The BCG and X-ray centre are displaced
by about 55 kpc (see Fig.1and McDonald et al. 2016), and an
interesting question is how AGN feedback operates in this case (see
3SPT-CL J2106−5845 is one of the most X-ray luminous systems in the
sample, the fifth most luminous after the Phoenix cluster (z=0.595), El Gordo (z=0.87), AS1063 (z=0.351), and ACT-CL J0438−5444 (z=
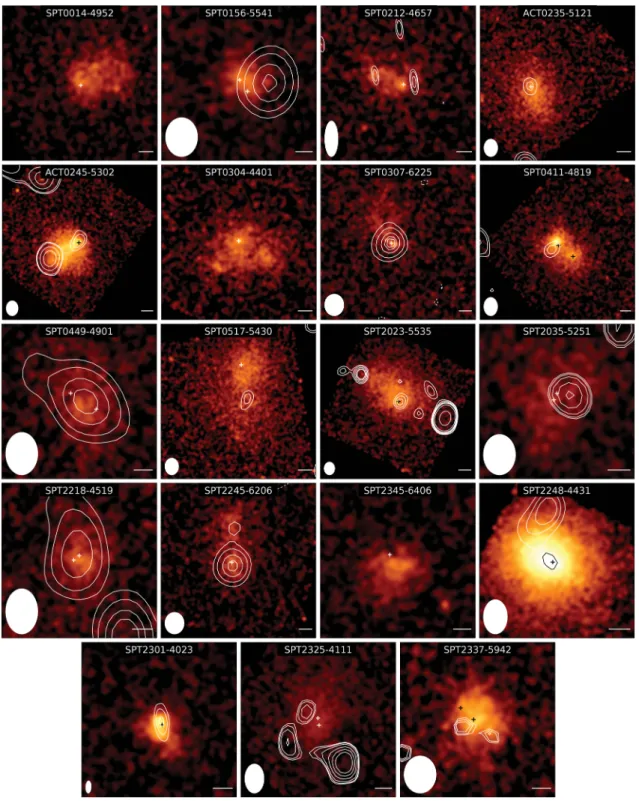
Figure 2. SmoothedChandraimages of systems with signs of interactions (see Section 3.5). The radio contours from GMRT (SPT-CL J0212−4657 and SPT-CL J2301−4023) and SUMSS (all others) images are overlaid, and the symbols are the same as in Fig.1.
Section 4.5).4 Additionally, there is some evidence for structure
in ACT-CL J0304−4921 and SPT-CL J0417−4748. In the case
of ACT-CL J0304−4921, we found a lower power cRS in our
GMRT image (below the SUMSS detection limit; see Fig.1). Both
4In the case of SPT-CL J2106−5845, there may also be a separation between
the BCG location and radio-source position; however, high-resolution radio observations are needed to verify this.
ACT-CL J0304−4921 and SPT-CL J0417−4748 have a radio source
displaced from the BCG. However, in these cases, the unsharp-masked images are not consistent with cavities, and as a result the structure we see in the X-ray images might be due to merger activity. There are also two cavity candidates among the eight
interme-diate CF systems, SPT-CL J2222−4834 at z= 0.652 and
SPT-CL J0058−6145 at z= 0.83 (see Fig. 1). Additionally, as with
SPT-CL J2106−5844, SPT-CL J0058−6145 shows a separation
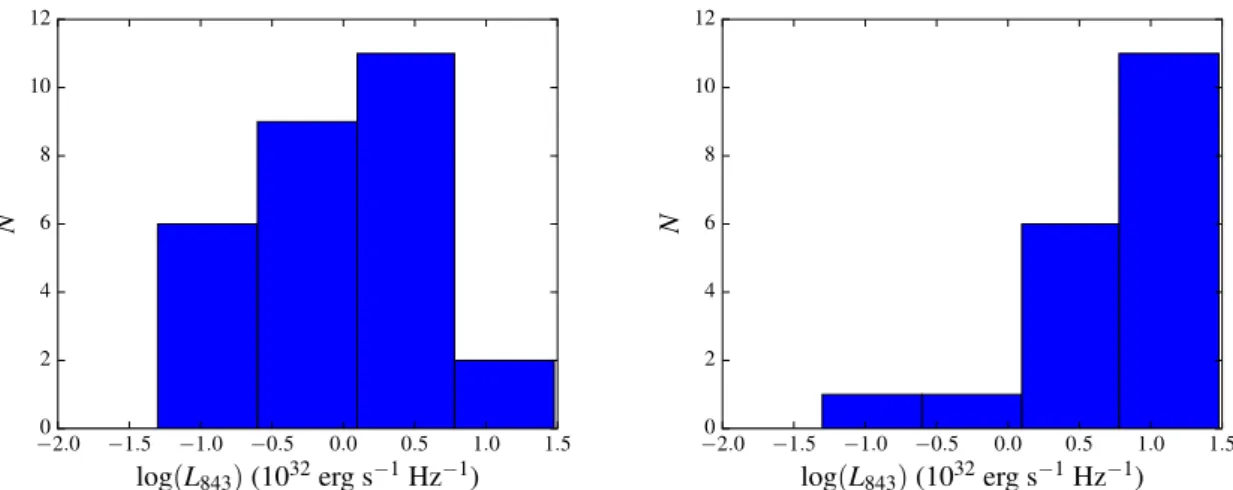
SPT-Figure 3. The number of sources with a cRS of a given radio luminosity at 843 MHz forz<0.6 (left-hand panel) andz>0.6 (right-hand panel).
CL J2222−4834 and SPT-CL J0058−6145, the unsharp-masked
images support the presence of cavities to the east and west. In the
case of SPT-CL J0058−6145, a cRS is also present. There are also
cases of possible cavity systems among the NCF systems, e.g.
SPT-CL J2135−57225atz=0.427, ACT-CL J0237−4939 atz=0.334,
SPT-CL J0106−5943 atz= 0.348, and SPT-CL J2031−4037 at
z=0.342.
The best cavity system candidate from our sample is SPT-CL
J2031−4037, which is one of the NCF systems. In this case, there
is also evidence in the GMRT image that the radio emission extends
towards the cavity (see Fig.1). We measure a cavity in this system
as an ellipsoid with semimajor and semiminor axes of 9.3×4.9,
situated at a projected distance of 18.3 from the cluster centre.
By assuming that the cavity rose buoyantly from the cluster centre
to the current location, we estimate an age of 1.6×10⁸yr and a
mechanical power (considering onlypVwork) of 2.9×1044erg s−1
(Bˆırzan et al.2004), enough to balance the X-ray luminosity inside
the cooling region (see Table2). However, the cooling region in the
system is small, as only in the very centre does the cooling time drop below 7.7 Gyr.
In summary, there are possible cavities in both CF and NCF systems in our sample. Although we do not expect cavities in NCFs, many of the NCFs might harbour small cool cores (e.g. Sun et al.
2007) that would only be visible in deeperChandraobservations
(see Section 3.6 for more possible CF candidates).
3.5 Merging activity
Signs of merging activity or interactions are often apparent in X-rays images (e.g. a distorted morphology), radio images (e.g. relic emission), and optical images (e.g. a separation between X-ray and BCG centres). We briefly outline below such evidence in our sample.
In some systems in our sample, the X-ray images show direct evidence of interactions, such as a tail-like structure (e.g. SPT-CL
J0307−6225) or the presence of multiple subclusters (see Fig.2).
For example, SPT-CL J0304−4401 shows at least three
interact-ing systems; SPT-CL J0411−4819 shows two interacting systems;
SPT-CL J0212−4657 shows an excess of diffuse X-ray emission
5In the case of SPT-CL J2135−5726, the radio source is displaced from the
BCG location, and there is also a separation between the X-ray core and BCG position of 50 kpc.
at the end of an X-ray tail, perhaps a subgroup, which has its own cRS (there is also radio emission just a little ahead of the cluster core).
Another indicator of merging activity is the relic radio emis-sion, which is thought to be due to cluster–cluster mergers (see
the review of Brunetti & Jones 2014). Based on the SUMSS
images of our sample, besides the already known relics in El
Gordo (Lindner et al.2014; Botteon et al.2016), there are
pos-sible relics in some other systems (e.g. SPT-CL J2023−5535, which shows evidence of a subcluster on the cluster periphery,
see Fig.2). However, one cannot exclude the possibility that in
some of these systems the radio emission may be associated with AGN activity (even if there are no apparent optical counterparts to the radio emission). Deeper optical images and radio images at different frequencies are needed to confirm the putative radio relic emission.
Further evidence of cluster-scale merging activity is the
pres-ence of two or more cD galaxies (McDonald et al. 2016). This
is the case for SPT-CL J0156−5541 and SPT-CL J0411−4819
(with displaced radio emission, see Fig. 2), among others.
Ad-ditionally, a large offset between the X-ray core and the BCG
location, as seen in El Gordo (for images see Figs 1and 2), is
evidence of significant sloshing, thought to be often triggered by a merger. Evidence of other (e.g. galaxy–galaxy) merging activ-ity is the presence of a nearby companion galaxy to the BCG
(McDonald et al.2016, e.g. SPT-CL J0000−5748) or of
asymmet-ric emission at ultraviolet (UV) wavelengths with a minimum of two peaks.
3.6 X-ray morphology and the central radio source
In Fig. 3, we show the number of detected cRSs as a function
of the radio luminosity at 843 MHz. Generally, systems atz <
0.6 have lower luminosities than those at z > 0.6. This
differ-ence is partly due to the flux-limited nature of the radio surveys that we have used (which means that lower luminosity sources cannot be detected at high redshifts), but it is also due to an increased incidence of powerful sources at higher redshifts (see Section 4.2).
For the 20 CF systems with tcool(10 kpc) 2 ×10⁹ yr and
tcool/tff10, 13 of which have a cRS, the X-ray morphology can be
described as small, round, and compact, with a peaked core (with a few exceptions: e.g. the Phoenix cluster, SPT-CL J2106−5845,
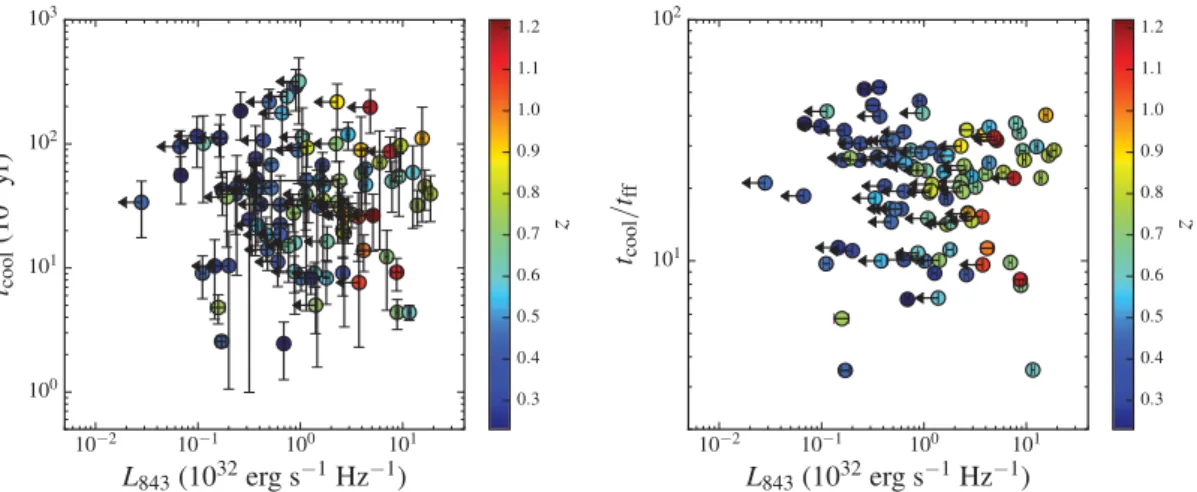
Figure 4. Total bolometric X-ray luminosity inside theR500region,LX(<R500), versus the rest-frame 843 MHz monochromatic radio luminosity for the cRS,
L843. The colour denotes the redshift in the left-hand panel andM500in the right-hand panel.
J2129−0005*, SPT-CL J2011−5725*6). Only a couple of these
systems show evidence for cavities, e.g. the Phoenix cluster (see
McDonald et al. 2015). The two systems with tcool/tff 10, but
tcool(10 kpc)> 2×10⁹ yr are large, bright, and elongated, e.g.
SPT-CL J2248−4431 (see Fig.2).
The four systems withtcool(10 kpc)>2×10⁹yr, butηmin10
(see Section 3.2) do not have a cRS above the detection limit (see
Ta-ble2). For the eight intermediate systems, withtcool(10 kpc)2×
109yr andt
cool/tff>10, only two have a cRS, and both have a
sig-nificant separation between the X-ray peak and BCG location (see Section 3.5). However, some of these have low central temperatures and peaked SB profiles and hence might be classified as CF systems
in deeperChandraobservations (e.g. SPT-CL J2352−4657).
Of the remaining 65 NCF systems, 32 have a cRS. The NCF systems have a variety of X-ray morphologies, but mostly they can be described as disturbed and often show evidence of merging activity, such as two BCGs (e.g. SPT-CL J2035−5251 and SPT-CL
J2337−5942, see Fig.2), sharp edges (e.g. SPT-CL J2258−4044
and SPT-CL J2233−5339), or an elongated tail-like appearance
(e.g. ACT-CL J0235−5121, see Fig.2).
Notably, in contrast to local samples (e.g. the B55 sample), some
of the NCFs in our sample host powerful cRSs (up toL843∼1.9×
1033erg s−1Hz−1). Presumably, this radio activity is unrelated to
feedback but is instead triggered by other factors. Additionally, this difference points to evolution in the cRSs in NCFs, and we discuss this possibility further in Section 4.2.
3.7 Star formation rates
We use the SFRs of McDonald et al. (2016), who computed SFRs
from UV, OII, and infrared (IR) data. The data used in McDonald
et al. (2016) to calculate the SFRs comes from photometric-redshift
follow-up campaigns (Song et al.2012; Bleem et al.2015) plusU
-band imaging from McLeod et al. (2015). Of the three SFRs listed in McDonald et al. (2016), we use the IR-derived SFR, unless one of the other values was a detection and the IR-derived SFR was only an upper limit or when there was no IR-derived SFR listed for that system. If a system had two or more detections, we use the average of the detected rates as the SFR for that system. The SFRs are given
in Table2.
6The systems with an asterisk were detected in one or more X-ray surveys
and are atz≈0.3 (see Table2).
4 R E S U LT S A N D D I S C U S S I O N S
4.1 X-ray versus radio luminosity
In Fig.4, we plot the bolometric X-ray luminosity inside theR500
region,LX(<R500), versus the rest-frame 843 MHz monochromatic
radio luminosity for the cRS,L843. The highest monochromatic
ra-dio luminosity in our sample isL843 ∼1.9×1033 erg s−1Hz−1
for SPT-CL J0449−4901 at a redshift of z = 0.79, one of the
systems with two BCGs (see Table2and Fig.2). Based on the
X-ray data, this system was classified as an NCF (see Table1).
Overall, the range in radio luminosity at 1400 MHz
(extrapo-lated from 843 MHz assuming α = 1.0) isL1400 ∼ 0.04–10×
1032erg s−1Hz−1. This range is considerably smaller than that of
the B55 and HIFLUGCS samples, where the 1400 MHz
luminos-ity ranges from 1028 to 1035 erg s−1 Hz−1(Bˆırzan et al. 2012).
Additionally, the lower limit of this range is above the threshold
that separates CFs and NCFs in local samples ofL1400 ∼2.5×
1030 erg s−1 Hz−1 (see Bˆırzan et al. 2012). However, since we
mainly used shallow survey data (e.g. SUMSS, Mauch et al.2003),
the sensitivity of our radio data is generally insufficient to detect the low-luminosity sources.
Furthermore, in our sample, there are no cRSs with L843 >
1034 erg s−1Hz−1, such as those that appear in local X-ray
flux-limited cluster samples (e.g. Cygnus A). This lack can be partly explained by the radio-luminosity bias of SZ surveys (Lin et al. 2015), which tends to select against such sources, and by the fact that such luminous sources are rarely found in massive clusters (of which the SZ samples are predominantly comprised).
However, our sample does have a number of powerful radio sources, with luminosities above the canonical FRI–FRII dividing line. The commonly used luminosity separation between FRI and
FRII sources (Fanaroff & Riley1974) corresponds toL178∼2×
1032 erg s−1Hz−1Sr−1at the rest-frame frequency of 178 MHz,
or L1400 ∼ 1031.5 erg s−1 Hz−1 Sr−1 at 1.4 GHz (which
corre-sponds to a monochromatic luminosity at 843 MHz of L843 ∼
5×1032 erg s−1 Hz−1, assuming a spectral index of α= 1.0).
The more powerful FRII sources are found to preferentially avoid
clusters at lower redshifts (Owen & White1991) and be present
in rich clusters around z = 0.5 or higher (Yee & Green 1987;
Hill & Lilly 1991; Belsole et al. 2007). Morphologically, FRI
emission with collimated jets on kpc scale that terminate in
hotspots.7
There is a large overlap between sources classified as FRI/FRII
and those classified as LERG/HERG (Evans et al.2006; Hardcastle
et al.2007; Best & Heckman2012; Heckman & Best2014; Mingo
et al.2014), although some FRIs are high-excitation radio galaxies
(HERGs; e.g. Perseus, M87) and some FRIIs are LERGs (Gendre
et al.2013). Recently, Turner & Shabala (2015) developed a model
which incorporated both FRII (Kaiser & Alexander1997) and FRI
models (Luo & Sadler2010) and supports the conclusion that
dif-ferences between LERGs and HERGs is due to difdif-ferences in the accretion mechanism.
Using a monochromatic luminosity of L843 ∼ 5 ×
1032erg s−1Hz−1to classify our sources as FRI or FRII, we find
that in our sample there are 15 sources with FRII-like radio power
(see Table2and Fig.4). Because of the large beam size of SUMSS
images of≈40(Mauch et al.2003), the cRSs in our sample are
mostly unresolved and we cannot therefore distinguish between FRI or FRII sources based on their radio morphology. The only clear case when the cRS is resolved is in SPT-CL J0542−4100 (or RDCS
J0542−4100 atz= 0.64), where the central source is∼600 kpc
across, but the image is inconclusive.
All of the high-power sources are also higher redshift sources
(z 0.6). Four of them are hosted by clusters classified as CFs
(the Phoenix cluster, SPT-CL J2106−5845, SPT-CL J0000−5748,
and ACT-CL J0616−5227), all of which have possible
cavi-ties (this paper and Hlavacek-Larrondo et al. 2015; McDonald
et al. 2015). The remaining 11 high-power sources are in
clus-ters classified as NCFs, some of which show signs of merging
activity (e.g. SPT-CL J2245−6206, SPT-CL J0449−4901, and
SPT-CL J2218−4519, see Fig. 2). We will discuss the relation
be-tween the cluster state and the radio properties in more detail in Section 4.3.
Fig.4(left) shows that the higher redshift sources (z>0.6) have
on average higher radio luminosity than lower redshift sources.
As we noted above, all the FRII-like cRSs are at z 0.6, and
there are only few sources with high radio luminosity, L843 >
2.7 × 1032 erg s−1 Hz−1, at lower redshift, z < 0.6. This is
the case for SPT-CL J2344−4242 (the Phoenix cluster) at z =
0.595 and SPT-CL J2245−6207 at z = 0.58 (with a radio
lu-minosity above 1033 erg s−1 Hz−1, they are part of the 15 most
powerful radio sources discussed above), ACT-CL J0215−5212 at
z=0.48, SPT-CL J0456−5116 atz =0.562 with a radio
lumi-nosity above 4×1032 erg s−1 Hz−1, and ACT-CL J0346−5438
at z = 0.53, SPT-CL J0307−6225 at z = 0.59, and SPT-CL
J0234−5831 atz=0.415 with a radio luminosity above 2.7×1033
erg s−1Hz−1.
An explanation for the higher radio luminosity in the higher redshift systems might be that, due to the fact that these systems tend to be younger and less relaxed than similar systems at lower redshift, there is more merging activity that contributes to the triggering of
the radio activity (see Section 4.2 and Branchesi et al.2006). This
increase of the merging activity with redshift is also supported by the commensurate increase in the SFRs at higher redshift (see
Section 4.4 and McDonald et al.2016).
7Recently, a new class was introduced to describe the radio sources which
lack extended emission (FR0, Sadler et al.2014; Baldi, Capetti & Giovannini 2015).
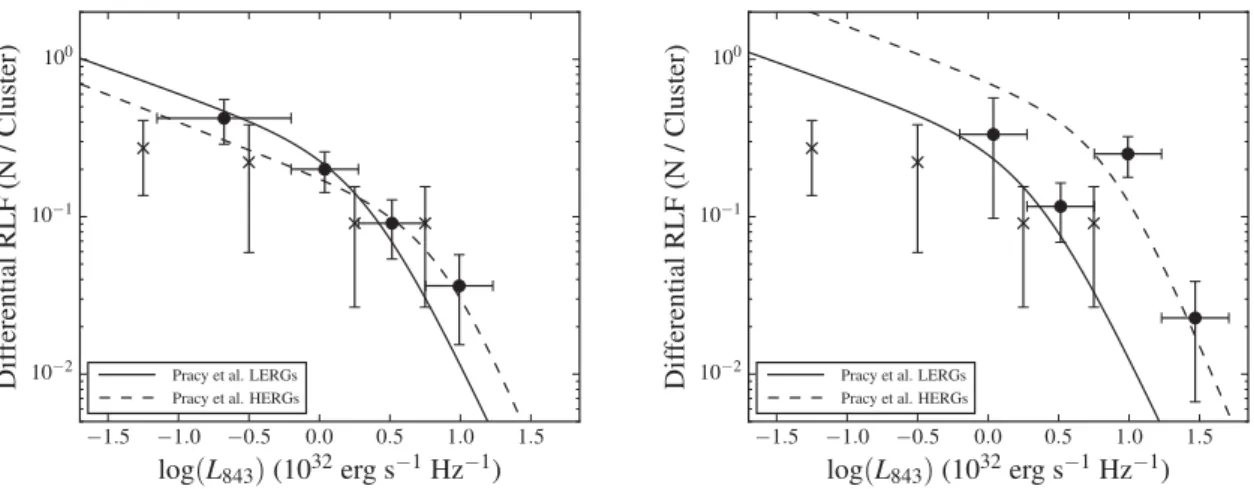
Figure 5. The differential RLF at 843 MHz for our SPT sample (filled circles) and the sample of Branchesi et al. (2006) of 0.3<z<0.8 X-ray-selected NEP clusters (crosses), adjusted for our method of calculating the RLF.
4.2 Radio-luminosity functions
The radio-luminosity function (RLF) encapsulates the fraction of sources in a sample that possess a radio source of a given luminosity, and as such is a sensitive tool for detecting evolutionary effects in
the radio properties (e.g. Branchesi et al.2006; Pracy et al.2016).
In this work, as we are interested only in the central source (that responsible for feedback), we calculate the differential RLF for only the radio source associated with the BCG that lies at the X-ray core, in contrast to, e.g. Ledlow & Owen (1996) and Branchesi et al.
(2006) who calculate it for all radio sources within a distanceR<
0.2RA, whereRAis the Abell radius. Therefore, our RLF may be
interpreted as being the number of cRSs per cluster per luminosity bin.
We calculate the RLF following the approach of Branchesi et al. (2006). For each of the 44 clusters with a detected cRS, we calculate its contribution to the RLF as:
WRLF,i=1/Ncl,i, (3)
whereWRLF,iis the contribution of sourceiandNcl,iis the number
of clusters in which sourceicould have been detected, given its
peak flux density and the sensitivity limit of the radio observations (see Section 3.3 for details of the radio data). As in Branchesi et al. (2006), we adjust the bin size of the lowest luminosity bin so that all bins contain at least two sources, and we scale the normalization of this bin so that it matches the other bins (which have a size of 0.5 dex). Furthermore, to allow a direct comparison between the results of Branchesi et al. (2006) and our results, we recalculated the RLF of Branchesi et al. (2006) using our method of considering only the
cRS, rather than all sources withinR/RA<0.2.
In Fig.5, we plot the RLF at 843 MHz for our sample and that
of Branchesi et al. (2006). The Branchesi et al. (2006) sample of
18 clusters was constructed by selecting all clusters withz>0.3
from theROSATNorth Ecliptic Pole (NEP) catalogue of Gioia et al.
(2003). Our results agree fairly well with those of Branchesi et al. (2006) over the range of luminosities for which there is overlap. Branchesi et al. (2006) found that their RLF did not possess the high-luminosity break seen in local RLFs (e.g. Ledlow & Owen
1996; Sadler et al.2002; Best et al.2005; Mauch & Sadler2007).
In contrast, we do see evidence for a break around a luminosity
ofL843≈1033erg s−1Hz−1, considerably above the highest