THE ASSOCIATION BETWEEN REDUCTION IN PM2.5 AND IMPROVEMENT IN CARDIOVASCULAR MORTALITY RATES
Anne E. Corrigan
A thesis submitted to the faculty at the University of North Carolina at Chapel Hill in partial fulfillment of the requirements for the degree of Master of Science in the Department of Environmental Sciences and Engineering in the Gillings School of Global Public Health.
Chapel Hill 2017
ABSTRACT
Anne E. Corrigan: The Association between Reduction in PM2.5 and Improvement in Cardiovascular Mortality Rates
(Under the direction of J. Jason West and Ana G. Rappold)
We examined the association between county-level change in PM2.5 and change in cardiovascular mortality rate before and after implementation of the 1997 annual PM2.5 National Ambient Air Quality Standards. We examined how the association varied between counties stratified by attainment designation and by design values used in the designation process to characterize air quality. We used linear regression and difference-in-difference models, adjusted for sociodemographic confounders.
Across 619 counties in the study, there were 1.10 (95% CI 0.37, 1.82) fewer deaths per year per 100,000 people per 1 µg/m3 PM
ACKNOWLEDGEMENTS
This work would not have been possible without the financial support of Oak Ridge Institute for Science and Education. I am especially indebted to Ana G. Rappold, my mentor, who has dedicated her time and expertise since January of 2016 to teach me how to apply my analytical skills, ask meaningful questions, and persevere through all challenges in my research. I also recognize the support from Lucas Neas and Michelle Becker, who spent long hours giving assistance and guidance as I strove to achieve a high quality of work.
TABLE OF CONTENTS
LIST OF TABLES ... vi
LIST OF FIGURES ... vii
LIST OF ABBREVIATIONS ... ix
CHAPTER 1: INTRODUCTION ...1
CHAPTER 2: METHODS ...4
Data ...4
Statistical Analysis ...7
CHAPTER 3: RESULTS ... 11
CHAPTER 4: CONCLUSION ... 16
CHAPTER 5: DISCUSSION ... 18
APPENDIX A ... 22
LIST OF TABLES Table
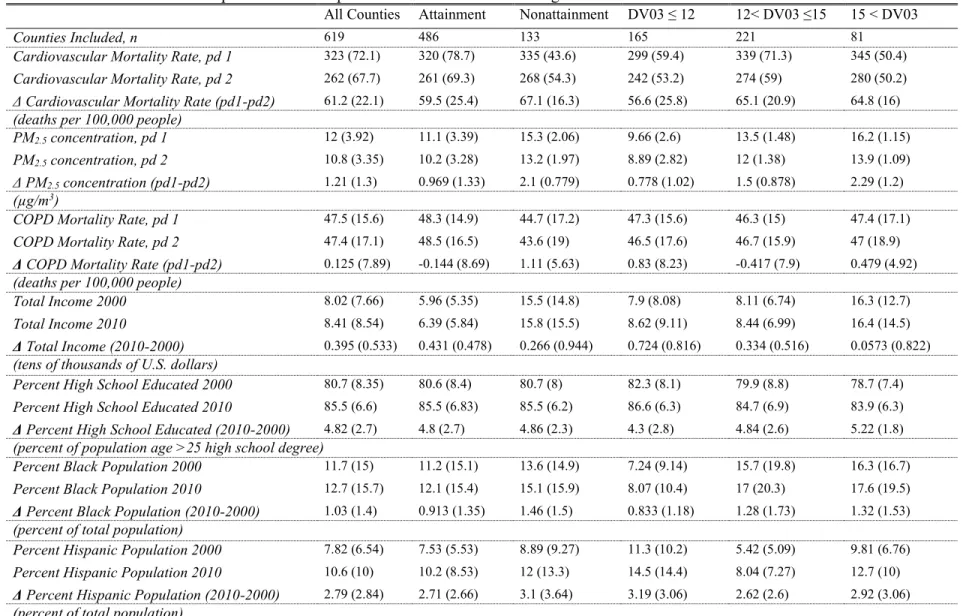
1. Summary statistics, means and interquartile ranges, for exposure, outcome, and covariates for all counties and counties in strata used to assess effect modification. Deltas for PM2.5, cardiovascular mortality, and COPD mortality were calculated as period 1 (2000-2004) minus period 2 (2005-2010) so positive values represent improvement in air quality or health. Deltas for covariates were calculated as 2010 minus
2000 so positive values represent increase in value for the given variable ... 10 2. Results of Selected Regression Models for County-Level Analysis; The
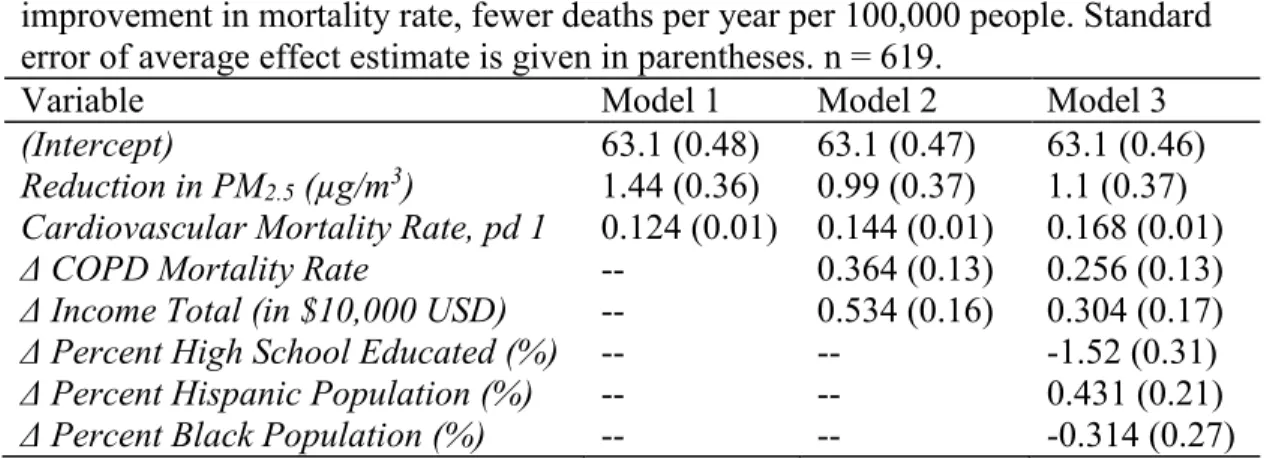
reported values are the estimated changes in age-adjusted cardiovascular mortality rate associated with each variable listed on the left. Positive coefficients indicate improvement in mortality rate, fewer deaths per year per 100,000 people. Standard error of average effect estimate is
LIST OF FIGURES
Figure 1: Directed Acyclic Graph indicating association between change in PM2.5 (ΔPM) and change in age-adjusted cardiovascular mortality rate (ΔAMR) from period 1 (2000-2004) to period 2 (2005-2010) as adjusted for
confounding variables ... 8 Figure 2a: Point estimate and 95% confidence intervals for a decrease in
cardiovascular mortality rate for all counties, nonattainment counties, and attainment counties—adjusted for confounders included in Model 3 but not
PM2.5 ... 14 Figure 2b: Point estimate and 95% confidence intervals for effect of a per unit
decrease in PM2.5 on decrease in cardiovascular mortality rate for all counties, nonattainment counties, and attainment counties—adjusted for
confounders included in Model 3 ... 14 Figure 3a: Point estimate and 95% confidence intervals for decrease in
cardiovascular mortality rate for all counties and counties with 2003 Design Value (DV03) greater than 15 µg/m3, between 12 and 15 µg/m3, and under 12 µg/m3—adjusted for confounders included in Model 3 but not PM
2.5 ... 15 Figure 3b: Point estimate and 95% confidence intervals for decrease in
cardiovascular mortality rate for all counties and counties with 2003 DV greater than 15 µg/m3, between 12 and 15 µg/m3, and under 12 µg/m3–
adjusted for confounders included in Model 3 ... 15 Figure A.1: Reduction in PM2.5 (period 1 minus period 2) in attainment versus
nonattainment counties. Each point represents the observed average drop in PM2.5 in a county with size given by the inverse variance for change in
cardiovascular mortality rate, also proportional to population size of county ... 22 Figure A.2: Reduction in PM2.5 (period 1 minus period 2) in counties with 2003
design value (DV) less than or equal to 12 µg/m3, 2003 DV between 12 µg/m3 and 15 µg/m3, and DV 2003 greater than 15 µg/m3. Each point represents the observed average change in PM2.5 in a county with size given by the inverse variance for change in cardiovascular mortality rate, also
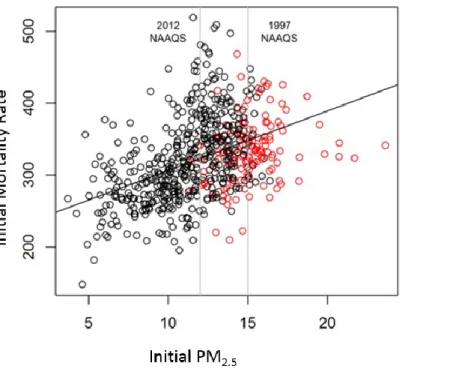
proportional to population size of county. ... 22 Figure A.3: Linear fit to the association between average initial cardiovascular
mortality rate, period 1 (2000-2004), and the decrease in cardiovascular mortality rate from period 1 (2000-2004) to period 2 (2005-2010) with
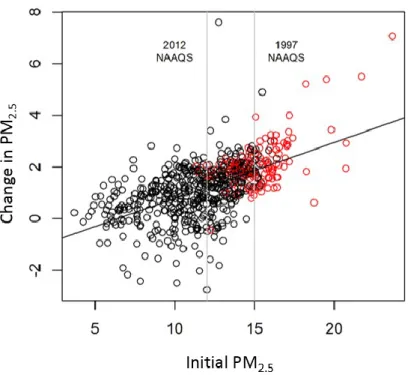
Figure A.4: Linear fit to the association between initial PM2.5, the average in period 1 (2000-2004), and the decrease in PM2.5 from period 1 (2000-2004)
to period 2 (2005-2010) with nonattainment counties given in red ... 23 Figure A.5. Linear fit to the association between initial PM2.5, the average in
period 1 (2000-2004), and the decrease in PM2.5 from period 1 (2000-2004)
LIST OF ABBREVIATIONS
AMR Age-adjusted Mortality Rate
CAA Clean Air Act
COPD Chronic obstructive pulmonary disease
C-R Concentration-Response
DV Design Value
EPA Environmental Protection Agency
FIPS Federal Information Processing Standard
IQR Interquartile range
MSA Metropolitan Statistical Area
NAAQS National Ambient Air Quality Standards
NCHS National Center for Health Statistics
CHAPTER 1: INTRODUCTION
Various provisions of the Clean Air Act (CAA) have driven the improvement of air quality across U.S. communities since its enactment in 1970 (EPA 2015; U.S. Code 1970). Among these are National Ambient Air Quality Standards (NAAQS) which were established by U.S. Environmental Protection Agency (EPA) for six criteria air pollutants to protect public health and the environment. The implication of the NAAQS is that states with areas in
exceedance bear the burden of becoming compliant. Namely, when NAAQS are exceeded, states must develop permanent and enforceable air pollution control measures and demonstrate that the area will meet the standard as a result of the measures which imposes costs on public and private sectors. Since 1990, average concentrations of fine particulate matter (PM2.5) have decreased by over 37% (EPA 2015). Nationwide reductions in PM2.5 are responsible for the largest benefits tied to the CAA due to documented improvements to health (EPA 2009; OMB 2015). However, studies have not yet demonstrated if expected public health benefits from improving air quality are comparable in nonattainment counties for PM2.5 NAAQS and counties in compliance.
Numerous epidemiologic studies have demonstrated that mortality and other health endpoints are associated with both short-term (Laden et al. 2000; Schwartz et al. 1996) and long-term (Dockery et al. 1993; Krewski et al. 2005) exposures to PM2.5. Studies have also
abruptly shut down or controlled (Breitner et al. 2009; Clancy et al. 2002; Peel et al. 2008; Pope et al. 1992; Su et al. 2015; Wang et al. 2009). Combined with toxicology studies, this body of research formed the scientific basis for a weight-of-evidence determination of a causal
relationship between fine particulate matter (PM2.5) and cardiovascular mortality (EPA 2009). Few studies have focused on specifically NAAQS-induced reductions in particle pollution and consequent benefits on public health. Previously, Chay et al. (2003) concluded that counties in nonattainment of the standard for total solid particulates (TSP), showed a larger reduction in TSP in the year following the CAA, but this improvement in air quality had little association with declines in either adult or elderly mortality. Zigler et al. (2012) estimated that the 1991 nonattainment designations for PM10 causally reduced mortality but found that the effect estimates were similar in areas where regulations decreased and where they did not decrease PM10 concentrations. Studies on the effectiveness of regulation, "accountability studies," have not yet focused on improvements in health due to annual PM2.5 NAAQS regulatory actions.
With this study, we focused on the impact of the 1997 NAAQS designations on the association between the changes in cardiovascular mortality rates and in annual PM2.5. The first standard for annual PM2.5 was set in 1997, but the attainment designations were not promulgated until 2005. We compared age-adjusted standardized cardiovascular mortality rates in 619 counties before and after the NAAQS were promulgated (2000-2004 vs 2005-2010).
CHAPTER 2: METHODS
Data
Mortality Rates
Annual mean cardiovascular standardized age-adjusted mortality rates (annual deaths per year per 100,000 people) were calculated for years between 2000 and 2010. With individual level data from U.S. National Center for Health Statistics (NCHS) we calculated crude cardiovascular mortality rates by dividing the number of cardiovascular deaths [International Classification of Diseases, 10th Revision (ICD 10) codes 0.0-79.9] in an age group, county, and
year by the total population of that age group in the corresponding county and year. The crude mortality rates were then age-adjusted by averaging across all age groups and weighting to the national population age distribution. The standard errors for the mortality rates were calculated using NCHS standard formulas which assume population is known and the number of deaths has a Poisson distribution. Uncertainty in the mortality rates arises from short-term fluctuation in the number of deaths from random factors (e.g. extreme weather or changes to available medical care) and short-term fluctuation in population estimates (e.g. transient or seasonal moves) for years between decennial census counts, regardless of a constant long-term mortality rate and population. Annual data was averaged before and after promulgation of the NAAQS: period 1 (2000-2004) (pd1) and period 2 (2005-2010) (pd2).
PM2.5 annual data
Annual average PM2.5 data was calculated for years 2000 to 2010 using data from EPA’s Air Quality System (AQS) which documents air quality measured at environmental monitors across the U.S. whose locations are based on population density. For counties with multiple PM2.5 monitors, the annual means of all monitors within the county were averaged. Monitors were included if they reported for at least 45 days of the year to coincide with monitoring regulations which require 75% of days per reporting quarter collected assuming a minimum recording frequency of one in six days (365/6*0.75).
Annual PM2.5 data were also averaged to period 1 (2000-2004) (pd1) and period 2 (2005-2010) (pd2), before and after attainment designations. The complete annual PM2.5 monitoring data included 775 counties. However, 69 counties did not have PM2.5 records for any years 2000-2004, and 87 counties did not have records in 2005-2010. The loss of data may be
attributed to several different factors, including location change of monitor within a metropolitan statistical area (MSA), monitor shut down, or population changes in an MSA. Thus, analysis considered 619 counties with monitored annual mean PM2.5 in both period 1 and period 2. Sociodemographic characteristics
Mortality rates, air monitoring data, and Census data were matched by five-digit county FIPS (federal information processing standard) codes, providing complete data for 619
counties.
Modification of the effect by NAAQS
The EPA designates NAAQS attainment status based on a number of factors including ambient monitor values, meteorology, weather, geography, contributions to neighboring areas, etc. The first factor considered in designation is the highest recorded design value (DV) of any monitor in the county. For annual PM2.5, the DV is defined as the three year rolling average concentration, calculated at each monitor based on annual weighted means based on quarterly means (40 C.F.R. §1.50 App. N 2013). Counties without monitors or counties with DVs below the NAAQS may still be declared in nonattainment due to the other factors in the designation analysis as mentioned above. Design values may be accessed in the AQS while
attainment/nonattainment status is identified in the EPA Green Book, which houses designations for all criteria pollutants (EPA 2016).
Statistical Analysis
Linear regression models were used to capture the association between the change in cardiovascular mortality rate, period 1 (2000-2004) minus period 2 (2005-2010), and the change in PM2.5 levels, period 1 minus period 2, in U.S. counties. The association was evaluated by three different covariate models—models 1, 2, and 3 (Table 2). Model 1 adjusted for initial cardiovascular mortality rate. Model 2 adjusted for strong confounders of the PM2.5-mortality relationship—initial cardiovascular mortality rate, change in COPD rate, and change in total income. Model 3 was adjusted by (a) initial period 1 cardiovascular mortality rate, (b) change in COPD, (c) change in total income, (d) change in percent with high school degree, (e) change in percent Hispanic, and (f) change in percent black. Bayesian Information Criteria (BIC) was used to determine which covariate model best fit the data. A model with a lower value of BIC is preferred.
All models in the statistical analysis were weighted by the inverse variances (
ω
2) of the estimated rate. The weights were also proportional to the total population (correlation = 0.96), giving more weight to counties with greater populations. The general multiple regression equation can be summarized by:Δy
i= β
0+ β
1ΔPM
i+ β
2x
2i+ … + β
px
pi+ ε
i, ε
i~N(0, σ
2/ω
2)
The model expresses the relationship between the dependent variable (
ΔY
)—reduction in cardiovascular mortality rate—and p independent variables (X
s)—change in PM
2.5 (ΔPM
) and change in aforementioned covariates. Regression coefficients (β
j) express the estimatedexpected change in Δ
y
and per unit increase inx
j(j from 1 to p). The independent variablesweighted mean change in mortality rate. Our results focus on the resultant
β
1 which captures theexpected change in annual mortality rates (
Δy
i) for each unit decrease in PM2.5.A directed acyclic graph was used to visually represent the association between change in PM2.5 and change in cardiovascular mortality rate with consideration of confounders to the association based off prior knowledge (Figure 1). By adding to the linear regression model certain variables – those boxed in the diagram – we controlled for the effects of confounding from all identified variables as no pathway between exposure and outcome was left unblocked.
Next, we compared the change in age-adjusted cardiovascular mortality rates for nonattainment versus attainment counties. We additionally examined the change in
cardiovascular mortality rate in counties stratified on the 2003 design value (DV). We stratified
Figure 1. Directed Acyclic Graph indicating association between change in PM2.5 (ΔPM) and change in age-adjusted cardiovascular mortality rate (ΔAMR) from period 1 (2000-2004) to period 2 (2005-2010) as adjusted for confounding variables. Abbreviations—PM: average PM2.5; AMR: average
10
TABLE 1. Summary statistics, means (with parenthetical interquartile ranges), for exposure, outcome, and covariates for all counties and counties in strata used to assess effect modification. Deltas for PM2.5, cardiovascular mortality, and COPD mortality were calculated period 1
(2000-2004) minus period 2 (2005-2010) so positive values represent improvement in air quality or health. Deltas for covariates were calculated 2010 minus 2000 so positive values represent increase in value for the given variable.
All Counties Attainment Nonattainment DV03 ≤ 12 12< DV03 ≤15 15 < DV03
Counties Included, n 619 486 133 165 221 81
Cardiovascular Mortality Rate, pd 1 323 (72.1) 320 (78.7) 335 (43.6) 299 (59.4) 339 (71.3) 345 (50.4)
Cardiovascular Mortality Rate, pd 2 262 (67.7) 261 (69.3) 268 (54.3) 242 (53.2) 274 (59) 280 (50.2)
Δ Cardiovascular Mortality Rate (pd1-pd2) 61.2 (22.1) 59.5 (25.4) 67.1 (16.3) 56.6 (25.8) 65.1 (20.9) 64.8 (16)
(deaths per 100,000 people)
PM2.5 concentration, pd 1 12 (3.92) 11.1 (3.39) 15.3 (2.06) 9.66 (2.6) 13.5 (1.48) 16.2 (1.15)
PM2.5 concentration, pd 2 10.8 (3.35) 10.2 (3.28) 13.2 (1.97) 8.89 (2.82) 12 (1.38) 13.9 (1.09)
Δ PM2.5 concentration (pd1-pd2) 1.21 (1.3) 0.969 (1.33) 2.1 (0.779) 0.778 (1.02) 1.5 (0.878) 2.29 (1.2)
(µg/m3)
COPD Mortality Rate, pd 1 47.5 (15.6) 48.3 (14.9) 44.7 (17.2) 47.3 (15.6) 46.3 (15) 47.4 (17.1)
COPD Mortality Rate, pd 2 47.4 (17.1) 48.5 (16.5) 43.6 (19) 46.5 (17.6) 46.7 (15.9) 47 (18.9)
Δ COPD Mortality Rate (pd1-pd2) 0.125 (7.89) -0.144 (8.69) 1.11 (5.63) 0.83 (8.23) -0.417 (7.9) 0.479 (4.92)
(deaths per 100,000 people)
Total Income 2000 8.02 (7.66) 5.96 (5.35) 15.5 (14.8) 7.9 (8.08) 8.11 (6.74) 16.3 (12.7)
Total Income 2010 8.41 (8.54) 6.39 (5.84) 15.8 (15.5) 8.62 (9.11) 8.44 (6.99) 16.4 (14.5)
Δ Total Income (2010-2000) 0.395 (0.533) 0.431 (0.478) 0.266 (0.944) 0.724 (0.816) 0.334 (0.516) 0.0573 (0.822)
(tens of thousands of U.S. dollars)
Percent High School Educated 2000 80.7 (8.35) 80.6 (8.4) 80.7 (8) 82.3 (8.1) 79.9 (8.8) 78.7 (7.4)
Percent High School Educated 2010 85.5 (6.6) 85.5 (6.83) 85.5 (6.2) 86.6 (6.3) 84.7 (6.9) 83.9 (6.3)
Δ Percent High School Educated (2010-2000) 4.82 (2.7) 4.8 (2.7) 4.86 (2.3) 4.3 (2.8) 4.84 (2.6) 5.22 (1.8)
(percent of population age >25 high school degree)
Percent Black Population 2000 11.7 (15) 11.2 (15.1) 13.6 (14.9) 7.24 (9.14) 15.7 (19.8) 16.3 (16.7)
Percent Black Population 2010 12.7 (15.7) 12.1 (15.4) 15.1 (15.9) 8.07 (10.4) 17 (20.3) 17.6 (19.5)
Δ Percent Black Population (2010-2000) 1.03 (1.4) 0.913 (1.35) 1.46 (1.5) 0.833 (1.18) 1.28 (1.73) 1.32 (1.53)
(percent of total population)
CHAPTER 3: RESULTS
Population Characteristics
The association between change in cardiovascular mortality rate and the change in PM2.5 as well as modification of that association by attainment status was analyzed for 619 counties, capturing 70% of the U.S. population (2010). Modification of the association by design value was analyzed in 467 counties, capturing 61% of the U.S. population.
From period 1 (2000-2004) to period 2 (2005-2010), overall cardiovascular mortality rate, decreased on average by 61.2 deaths per year per 100,000 people annually with an interquartile range (IQR) of 22.1 deaths per year per 100,000 people (Table 1). Annual PM2.5 decreased on average by 1.21 µg/m3 with an IQR of 1.3 µg/m3. COPD mortality rates also decreased on average from period 1 to period 2 by 0.125 deaths per year per 100,000 people. From 2000 to 2010, total household income increased by $3,950 and there was a 4.82% increase in the population with at least a high school degree of age 25 or older. Hispanic and black populations also increased over the study period by 2.79% and 1.03%, respectively.
Main Result
The estimated impact of reductions in PM2.5 on reductions in cardiovascular mortality was consistent across the three models, ranging from 0.99 (95% CI 0.27, 1.71) deaths per year per 100,000 people to 1.44 (95% CI 0.73, 2.14) fewer deaths per year per 100,00 people per unit (1 µg/m3) decrease in PM
2.5 (Table 2). Added variables altered the estimate of the mean effect and improved the model fit (BIC analysis), suggesting confounding effects of additional predictors on the association between of the decrease in PM2.5 and decrease in cardiovascular mortality rate. Model 3 fit the data best (BIC), estimating a drop in mortality rate of 1.10 (95% CI 0.37, 1.82) fewer deaths per year per 100,000 people was associated with 1 µg/m3 reduction in PM2.5 across U.S. counties.
Model 3 also estimated 0.168 fewer deaths per year per 100,000 people were associated with each unit increase (1 death per year per 100,000 people) in initial (period 1) cardiovascular mortality rate (Table 2). Each unit decrease in the COPD morality rate (1 fewer COPD death per year per 100,000 people) was associated with 0.256 fewer cardiovascular deaths per year per 100,000 people. Model 3 coefficients also estimate 0.304 fewer cardiovascular deaths per year per 100,000 people were associated with each ten thousand dollar-increase in total household income and 0.431 fewer deaths per year per 100,000 people were associated with each 1% increase in Hispanic population (percent of total population). Finally, 1.52 more cardiovascular deaths per year per 100,000 people were associated with each 1% increase in percent of
TABLE 2. Results of Selected Regression Models for County-Level Analysis; The reported values are the estimated changes in age-adjusted cardiovascular mortality rate associated with each variable listed on the left. Positive coefficients indicate improvement in mortality rate, fewer deaths per year per 100,000 people. Standard error of average effect estimate is given in parentheses. n = 619.
Variable Model 1 Model 2 Model 3
(Intercept) 63.1 (0.48) 63.1 (0.47) 63.1 (0.46) Reduction in PM2.5 (µg/m3) 1.44 (0.36) 0.99 (0.37) 1.1 (0.37)
Cardiovascular Mortality Rate, pd 1 0.124 (0.01) 0.144 (0.01) 0.168 (0.01) Δ COPD Mortality Rate -- 0.364 (0.13) 0.256 (0.13) Δ Income Total (in $10,000 USD) -- 0.534 (0.16) 0.304 (0.17) Δ Percent High School Educated (%) -- -- -1.52 (0.31) Δ Percent Hispanic Population (%) -- -- 0.431 (0.21) Δ Percent Black Population (%) -- -- -0.314 (0.27)
First, we examined effect modification by counties designated nonattainment versus attainment of the 1997 standard. Second, we examined effect modification by counties stratified based off the first factor in the designation analysis—the 2003 design value, an indicator for initial PM and the first of five criteria used to determine attainment status for the 1997 standard. Association Modified by Attainment Status
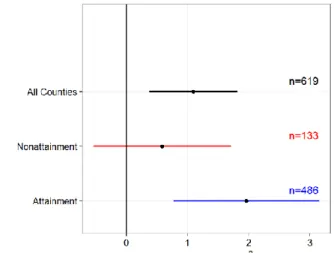
The average decrease in PM2.5 in nonattainment counties from period 1 to period 2, 2.10 µg/m3, was roughly twice that in attainment counties 0.97 µg/m3 (Table 1; Figure A.1).
Association Modified by Design Value
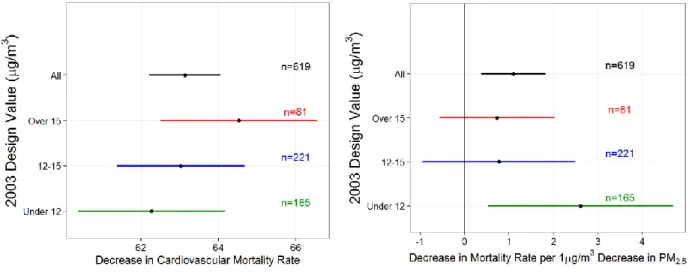
Counties with a 2003 DV greater than 15 µg/m3 experienced the greatest decrease in mean annual PM2.5 (2.29 µg/m3) from period 1 to period 2 (Table 1; Figure A.2). County-level observed changes in PM in each group are given by Figure A.2. Similarly, the mean decline in cardiovascular mortality rate for these same counties (64.5 (95% CI 62.5, 66.6) deaths per year per 100,000), adjusted for confounders but not changes in PM2.5, exceeds the mean decline in mortality rate in counties with the lowest 2003 DVs (62.3 (95% CI 60.4, 64.2) deaths per year per 100,00), though the difference is not statistically significant (Figure 3a). Per unit PM2.5, however, counties with the highest 2003 DVs had an incremental decline in cardiovascular mortality rate (0.73 (95% CI -0.57, 2.02) fewer deaths per year per 100,000 per 1 µg/m3 drop) that was three times less than that of counties with 2003 DV below 12 µg/m3 (2.6 (95% CI 0.52,
Figure 2. (a) Point estimate and 95% confidence intervals for a decrease in cardiovascular mortality rate for all counties, nonattainment counties, and attainment counties—adjusted for confounders included in Model 3 but not PM2.5(b) Point estimate and 95% confidence intervals for effect of a per
unit decrease in PM2.5 on decrease in cardiovascular mortality rate for all counties, nonattainment
statistically significant (Figure 3b). For all estimates of PM2.5 and mortality change from period 1 to period 2, the estimates for counties with 2003 DV greater than 12 µg/m3 and less than or equal to 15 µg/m3 fell between those of the other two groups and were not statistically different.
Figure 3. (a) Point estimate and 95% confidence intervals for decrease in cardiovascular mortality rate for all counties and counties with 2003 Design Value (DV03) greater than 15 µg/m3, between 12
and 15 µg/m3, and under 12 µg/m3—adjusted for confounders included in Model 3 but not PM 2.5.(b)
Point estimate and 95% confidence intervals for effect of a per unit decrease in PM2.5 on decrease in
cardiovascular mortality rate for all counties and counties with 2003 DV greater than 15 µg/m3,
CHAPTER 4: CONCLUSIONS
We estimate the association between the change in cardiovascular mortality rate and the change in annual PM2.5 across 619 US counties and examine how the association varied by counties’ attainment status for 1997 annual PM2.5 NAAQs. A decrease in 1 µg/m3 of PM2.5 was associated with 1.10 (95% CI 0.37, 1.82) fewer deaths per year per 100,000 people. When we examined the same association by attainment status and by initial DV, we found that
nonattainment counties as well as those with the greatest initial levels of PM2.5, experienced greater average declines in PM2.5 (2.1 µg/m3 and 0.97 µg/m3, respectively) but smaller
improvements to health per unit drop in PM2.5 (respectively, 0.59 (95% CI -0.54, 1.71) and 0.73 (95% CI -0.57, 2.02) fewer deaths per year per 100,000 people), although these were not
statistically different. Meanwhile, attainment counties with cleaner air experienced smaller declines in PM2.5 (0.97 µg/m3) but greater improvement to health per unit drop in PM2.5 (1.96 (95% CI 0.77, 3.15) fewer deaths per year per 100,000). However, the differences in health improvement were not statistically significant. The initial PM2.5 was higher among
nonattainment counties and the change in PM2.5 was highly correlated with initial PM2.5 (Figure A.1).
decrease in cardiovascular mortality rate is attributed to the decline in PM2.5 in nonattainment and attainment counties, respectively. In counties with 2003 DV greater than 15 µg/m3, 1.67 fewer deaths per year per 100,000 people were attributed to reductions in PM2.5 (3.2% of total health improvement) while, in counties with 2003 DV less than 12 µg/m3, 2.03 fewer deaths per year per 100,000 people were attributed to PM2.5 reductions (2.6%).
Our results also suggest that health benefit per unit drop in PM2.5 persists in the counties with PM2.5 levels at and below 12 µg/m3, our current national standard for annual PM2.5. At lower levels of PM2.5, a unit decrement in PM2.5 is associated with greater expected health improvement in a county. Taken together, these findings suggest that the concentration response function between PM2.5 and cardiovascular mortality rate is nonlinear with a concave down shape, having a steeper slope at lower values of PM2.5 and a less steep slope higher
CHAPTER 5: DISCUSSION
The main result is supported by studies which find a significant association between health improvements and the decline in annual PM2.5. Pope et al. (2009) estimated an increase in mean life expectancy of 0.61±0.2 years was associated with a 10 µg/m3 decrease in PM
2.5 in the 1980s and 1990s, and Correia et al. (2013) reported a 10 µg/m3 decrease was associated with an increase in mean life expectancy of 0.35 years from 2000 to 2007. “Quasi-experimental” studies, have reported significant absolute improvements to health when abrupt, dramatic improvements to air quality have occurred as a result of a local event or source-control action (Breitner et al. 2009; Clancy et al. 2002; Peel et al. 2008; Pope et al. 1992; Su et al. 2015; Wang et al. 2009). Pope et al. (1992) first demonstrated a significant reduction in daily mortality after PM10 concentrations dropped dramatically due to the temporary closure of a steel mill in the Utah Valley. After a 1990 ban on bituminous coal in Dublin, Ireland, Clancy et al. (2002) reported a sharp reduction in black smoke and sulfur dioxide along with a 10.3% reduction in cardiovascular deaths or about 243 fewer cardiovascular deaths per year. Examining a more recent sudden change in air pollution, Su et al. (2015) reported unique air pollution controls for the Beijing 2008 Summer Olympics successfully led to reduction of air pollution—measured by PM10, PM2.5, particle number concentration (PNC), and NO2—and a decreased risk of
On the other hand, previous studies which examined impacts of broader, as opposed to localized and immediate, air pollution requirements were unable to conclude that national regulations were associated with changes in both air quality and health. In evaluating the changes in total suspended particles (TSPs) induced by the Clean Air Act Amendments in 1970, Chay et al. (2003) found that TSP concentrations declined significantly more in nonattainment counties compared to attainment counties. However, he reported that nonattainment status had little association with changes in adult or elderly mortality rates. Further, the authors
demonstrated that attainment and nonattainment counties very near to the 1970 TSP standard at the time of legislation had similar characteristics—an element that may have reduced omitted variable bias. This strength, unfortunately, may have been undermined by the difference in initial health status between attainment and nonattainment counties (Chay et al. 2003).
Considering attainment status for the annual PM10 NAAQS, Zigler (2016) reported that the 1991 designations overall caused 1.76 fewer deaths per 1,000 Medicare beneficiaries. However, using principal stratification, the authors indicated that the magnitude of negative dissociative effects was similar to the negative associative effects, meaning that the regulation causally reduced morality regardless of whether the regulation causally reduced average concentrations of PM10.
Our study considers 1997 NAAQS designations for PM2.5 and reports a strong improvement to health per unit drop in PM2.5 for counties in attainment. Relative to
Daniels 2004; Marshall et al. 2015; CA Pope et al. 2015; Schwartz et al. 2002; Schwartz et al. 2008).
Moreover, the analyses of Marshall et al. (2015), CA Pope et al. (2015), and others also propose a supralinear (concave downward) PM2.5-mortality concentration response (C-R) function, in agreement with conclusions presented here (Crouse et al. 2012; Lu et al. 2017; Marshall et al. 2015; CA Pope, 3rd et al. 2015). CA Pope et al. (2015) reported that there are health benefits from reducing air pollution in more polluted areas and even greater health benefits per unit drop in PM2.5 from continuing to reduce air pollution in cleaner areas. Putting emphasis on U.S. conditions, Marshall et al. (2015) concluded that a supralinear C-R for cardiopulmonary mortality and PM2.5 implies we should achieve greater health benefit and economic efficiency by making “blue skies bluer”, although this optimal policy might conflict with traditional environmental equity goals.
Our study faces a number of challenges common to long-term accountability studies. First, nonattainment counties are clustered in or nearby urban areas and have different socio-economic, demographic (SES) characteristics compared to attainment counties. Despite controlling for changes in SES variables in our statistical model, it is possible that we did not totally remove confounding.
differentially impact all counties—not simply the attainment versus nonattainment groups used for this study—it is difficult to identify the change to PM2.5 and subsequent change to health attributed to a particular program in a particular county. Finally, the annual PM2.5 NAAQS as well as most other regulations target a single air pollutant, but they may influence concentrations of multiple pollutants which interact to affect health through more complex and unaccounted for pathways.
This study has affirmed that reductions in PM2.5 are significantly associated with reductions in age-adjusted cardiovascular mortality rates. Further, we report that the health benefits per unit drop in PM2.5 varied but were not statistically different between the counties grouped by designation status or initial level of PM2.5. We hypothesize that the PM2.5-mortality concentration response function is nonlinear with cleaner counties experiencing greater
APPENDIX A
Figure A.1. Reduction in PM2.5 (period 1 minus period 2) in attainment versus nonattainment counties. Each point represents the observed average drop in PM2.5 in a county with size given by the inverse variance for change in cardiovascular mortality rate, also proportional to population size of county.
Figure A.3. Linear fit to the association between average initial cardiovascular mortality rate, period 1 2004), and the decrease in cardiovascular morality rate from period 1 (2000-2004) to period 2 (2005-2010) with nonattainment counties given in red.
REFERENCES
Breitner S, Stolzel M, Cyrys J, Pitz M, Wolke G, Kreyling W, et al. 2009. Short-term mortality rates during a decade of improved air quality in erfurt, germany. Environ Health Persp 117:448-454.
Chay K, Dobkin C, Greenstone M. 2003. The clean air act of 1970 and adult mortality. J Risk Uncertainty 27:279-300.
Clancy L, Goodman P, Sinclair H, Dockery DW. 2002. Effect of air-pollution control on death rates in dublin, ireland: An intervention study. Lancet 360:1210-1214.
Correia AW, Pope CA, 3rd, Dockery DW, Wang Y, Ezzati M, Dominici F. 2013. Effect of air pollution control on life expectancy in the united states: An analysis of 545 u.S. Counties for the period from 2000 to 2007. Epidemiology 24:23-31.
Crouse DL, Peters PA, van Donkelaar A, Goldberg MS, Villeneuve PJ, Brion O, et al. 2012. Risk of non accidental and cardiovascular mortality in relation to long-term exposure to low concentrations of fine particulate matter: A canadian national-level cohort study. Environ Health Persp 120:708-714.
Daniels MJD, Francesca; Zeger, Scott L.; Samet, Jonathan M. 2004. The national morbidity, mortality, and air pollution study part iii: Pm10 concentration–response curves and thresholds for the 20 largest us cities.Health Effects Institute.
Dockery DW, Pope CA, 3rd, Xu X, Spengler JD, Ware JH, Fay ME, et al. 1993. An association between air pollution and mortality in six u.S. Cities. The New England journal of medicine 329:1753-1759.
EPA. 2015. Airtrends.
EPA. 2016. Green book pm-2.5 (1997) area information. Available: https://www.epa.gov/green-book/green-book-pm-25-1997-area-information 2017].
EPA US. 2009. Final report: Integrated science assessment for particulate matter. Washington, D.C.
Krewski D, Burnett R, Jerrett M, Pope CA, Rainham D, Calle E, et al. 2005. Mortality and long-term exposure to ambient air pollution: Ongoing analyses based on the american cancer society cohort. Journal of toxicology and environmental health Part A 68:1093-1109. Laden F, Neas LM, Dockery DW, Schwartz J. 2000. Association of fine particulate matter from
different sources with daily mortality in six us cities. Environ Health Persp 108:941-947. Lu XC, Lin CQ, Li Y, Yao T, Fung JCH, Lau AKH. 2017. Assessment of health burden caused
Marshall JD, Apte JS, Coggins JS, Goodkind AL. 2015. Blue skies bluer? Environ Sci Technol 49:13929-13936.
OMB. 2015. 2015 report to congress on the benefits and costs of federal regulations and agency compliance with the unfunded mandates reform act.Executive Office of the President of the United States.
Peel JL, Klein M, Flanders WD, Mulholland JA, Tolbert PE. 2008. Impact of improved air quality during the 1996 atlanta summer olympic games on cardiovascular and respiratory outcomes. Epidemiology 19:S318-S318.
Pope CA, Cropper M, Coggins J, Cohen A. 2015. Health benefits of air pollution abatement policy: Role of the shape of the concentration-response function. J Air Waste Manage 65:516-522.
Pope CA, 3rd, Schwartz J, Ransom MR. 1992. Daily mortality and pm10 pollution in utah valley. Archives of environmental health 47:211-217.
Pope CA, 3rd, Ezzati M, Dockery DW. 2009. Fine-particulate air pollution and life expectancy in the united states. The New England journal of medicine 360:376-386.
Pope CA, 3rd, Cropper M, Coggins J, Cohen A. 2015. Health benefits of air pollution abatement policy: Role of the shape of the concentration-response function. J Air Waste Manag Assoc 65:516-522.
Schwartz J, Dockery DW, Neas LM. 1996. Is daily mortality associated specifically with fine particles? J Air Waste Manage 46:927-939.
Schwartz J, Laden F, Zanobetti A. 2002. The concentration-response relation between pm2.5 and daily deaths. Environ Health Persp 110:1025-1029.
Schwartz J, Coull B, Laden F, Ryan L. 2008. The effect of dose and timing of dose on the association between airborne particles and survival. Environ Health Persp 116:64-69. Schwartz J, Austin E, Bind MA, Zanobetti A, Koutrakis P. 2015. Estimating causal associations
of fine particles with daily deaths in boston. Am J Epidemiol 182:644-650.
Su C, Hampel R, Franck U, Wiedensohler A, Cyrys J, Pan XC, et al. 2015. Assessing responses of cardiovascular mortality to particulate matter air pollution for pre-, during- and post-2008 olympics periods. Environmental research 142:112-122.
U.S. Code. 1970. Air pollution prevention and control. Section 7401.
Wang Y, Kloog I, Coull BA, Kosheleva A, Zanobetti A, Schwartz JD. 2016. Estimating causal effects of long-term pm2.5 exposure on mortality in new jersey. Environ Health Persp 124:1182-1188.
Zeger SL, Dominici F, McDermott A, Samet JM. 2008. Mortality in the medicare population and chronic exposure to fine particulate air pollution in urban centers (2000-2005). Environ Health Perspect 116:1614-1619.
Zigler CM, Dominici F, Wang Y. 2012. Estimating causal effects of air quality regulations using principal stratification for spatially correlated multivariate intermediate outcomes.
Biostatistics 13:289-302.