This may be the author’s version of a work that was submitted/accepted
for publication in the following source:
Petoe, Matt,
Bradley, Andrew
, & Wilson, Wayne
(2007)
A system to generate patient-specific stimuli for use with the auditory
brain-stem response test.
In Lovell, N & McAdams, E (Eds.)
Proceedings of the 29th Annual
In-ternational Conference of the IEEE Engineering in Medicine and Biology
Society (EMBS).
IEEE, United States of America, pp. 2452-2455.
This file was downloaded from:
https://eprints.qut.edu.au/114225/
c
Consult author(s) regarding copyright matters
This work is covered by copyright. Unless the document is being made available under a Creative Commons Licence, you must assume that re-use is limited to personal use and that permission from the copyright owner must be obtained for all other uses. If the docu-ment is available under a Creative Commons License (or other specified license) then refer to the Licence for details of permitted re-use. It is a condition of access that users recog-nise and abide by the legal requirements associated with these rights. If you believe that this work infringes copyright please provide details by email to [email protected]
Notice
:
Please note that this document may not be the Version of Record
(i.e. published version) of the work. Author manuscript versions (as
Sub-mitted for peer review or as Accepted for publication after peer review) can
be identified by an absence of publisher branding and/or typeset
appear-ance. If there is any doubt, please refer to the published source.
Abstract— The short-pulsed “click” stimuli most commonly used to evoke an Auditory Brainstem Response (ABR) do not account for temporal shifts along the basilar membrane and do not produce ABRs of maximal amplitude. This paper describes a system that maps these temporal shifts and generates patient-specific stimuli to compensate. This is of interest both to enhance the ABR and as a potential way to map the physiology of the basilar membrane.
I. INTRODUCTION
HE auditory brainstem response (ABR) is a scalp-recorded electrical response elicited from the brain by acoustic stimuli. It consists of several waves (peaks), each representing synchronous neural activity elicited from the auditory nerve and/or auditory nuclei within the brainstem [1]. The ABR is most commonly used for neonatal hearing screening, hearing threshold estimation, long term monitoring of intensive care unit patients with traumatic brain injury (TBI), and intra-operative monitoring (IOM) for any skull base surgery.
The ABR is usually elicited using short-pulsed acoustic ‘clicks’. These ‘click’ stimuli do not account for temporal shifts in the basilar membrane’s response to sound, and therefore do not elicit ABR waveforms of maximal amplitude.
To elicit ABR waveforms of maximal amplitude, recent studies have suggested that ‘click’ stimuli be replaced by rising-frequency ‘chirp’ stimuli [2]-[4]. Rising-frequency chirp stimuli elicit simultaneous displacement maxima along the entire length of the basilar membrane within the inner ear. This compensates for the temporal shifts in the basilar membrane’s response, and results in simultaneous membrane maxima that allow all regions of the basilar membrane to contribute to the ABR. The final product is an ABR waveform that is larger, can be recorded in less time, and potentially has more diagnostic power.
The use of rising chirp stimuli to elicit ABR waveforms has been limited by a ‘one-size-fits-all’ approach to their
Manuscript received March 29, 2007.
M. A. Petoe is with the School of Information Technology and Electrical Engineering, University of Queensland, QLD 4072, Australia (e-mail: petoe@ itee.uq.edu.au).
Dr. A. P. Bradley is with the School of Information Technology and Electrical Engineering, University of Queensland, QLD 4072, Australia (e-mail: bradley@ itee.uq.edu.au).
Dr. W. J. Wilson is with the School of Health and Rehabilitation Sciences, University of Queensland, QLD 4072, Australia (e-mail: w.wilson@ uq.edu.au).
design. To date, these designs have been based on population (ensemble average) data. This approach does not cater for individual variations in the stiffness and length of the basilar membrane, two factors that will directly affect chirp design. These variations could be significant considering the fact that subject gender [5], age [6], skull thickness [7], and brainstem size [8] have all been shown to result in changes in the ABR waveform.
This paper describes an initial study aimed at maximizing ABR wave amplitudes by tailoring chirp stimuli to individual subjects.
II. MAPPING PATIENT-SPECIFIC PHYSIOLOGY A. System Design
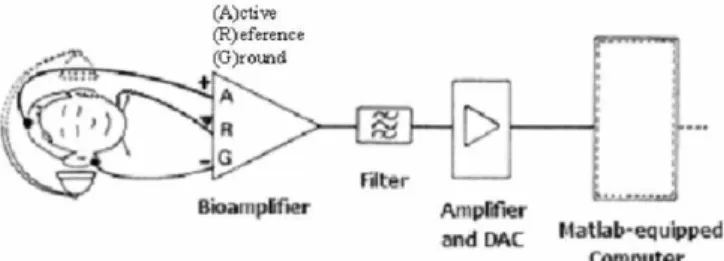
We used a low-noise CED 1902 bio-amplifier and a CED Power1401 data acquisition system, both from Cambridge Electronic Design (CED) to acquire ABR waveforms. The 1902 bio-amplifier contained onboard filters and provided up to 120 dB of gain. We presented auditory stimuli to test subjects via Etymotic 300Ω ER-3A insert earphones, driven by a Tucker-Davis HB7 headphone buffer. We used a custom-coded Mathworks Matlab™ interface to drive the data acquisition and analysis. Fig. 1 (adapted from [9]) summarizes the acquisition set-up.
Fig. 1. Acquisition set-up used in our study. B. Protocol
The method of designing patient-specific stimuli for our study was based on the methods of [10] and [11]. These studies used the latency of Wave V (a characteristic feature in an ABR waveform) from normative tone-evoked ABR data as a surrogate measure of travel-time on the basilar membrane. In contrast to this, our travel-time function was fitted to each test subject individually - based solely on the tone-evoked ABR results of that test subject.
ABRs were recorded from 11 subjects, aged between 20 and 30, who were presumed otologically normal by
self-A System to Generate Patient-Specific Stimuli for use with the
Auditory Brainstem Response Test
Matthew A. Petoe, Andrew P. Bradley,
Senior Member, IEEE
, and Wayne J. Wilson
T
report. Single-frequency tone-bursts were presented at 80 dB SPL and, in keeping with the recommendations of previous studies [12], [13], the envelope of the tone-bursts were chosen to compromise between the need for rapid stimulus onsets (to elicit an ABR) and reduced spectral energy spread (to ensure frequency specificity).
Testing took place in an electrically-shielded room. The test subjects lay down on a clinic bed and the lights were turned out to assist the subject to sleep if possible. Electro-encephalic activity was recorded from the scalp via disposable silver/silver chloride electrodes, attached to the forehead (active, non-inverting) and the ipsi-lateral earlobe (inverting). The back of the neck served as the site for the reference electrode. Inter-electrode impedance was maintained below 5 kΩ, and in most cases was below 2 kΩ.
Responses were amplified (89.5 dB) and filtered (100Hz to 5000Hz Butterworth band-pass, 12 dB/oct roll-off) before being digitized by the Power 1401 ADC unit (set to 32.9 kHz, 16 bit resolution). Responses were recorded for 45.3 ms following the stimulus onset, giving a stimulus repetition rate of 22.1 stimuli per second. The stimuli were presented with rarefacting polarity (initially negative-going electrical phase) and were digitally generated with a reconstruction frequency of 263.2 kHz.
The order of presentation was randomized and responses were recorded for between 1000 – 3000 iterations per tone-burst frequency, depending on the quality of the evoked response. The ensemble average was calculated on-the-fly and presented graphically to the operator, along with a measure of Wave V latency and historical variance. The operator was then able to manually terminate each
acquisition when Wave V was clearly defined and had a stable latency. This part of the study took 30 - 60 minutes per test subject and all measurements were repeated twice.
At the conclusion of the tone-evoked acquisitions the operator invited the test subject to sit up and stretch their legs. During this interval, the operator used the custom-coded Matlab™ application to review all recorded tone-evoked ABRs and chart the location of the peak of Wave V.
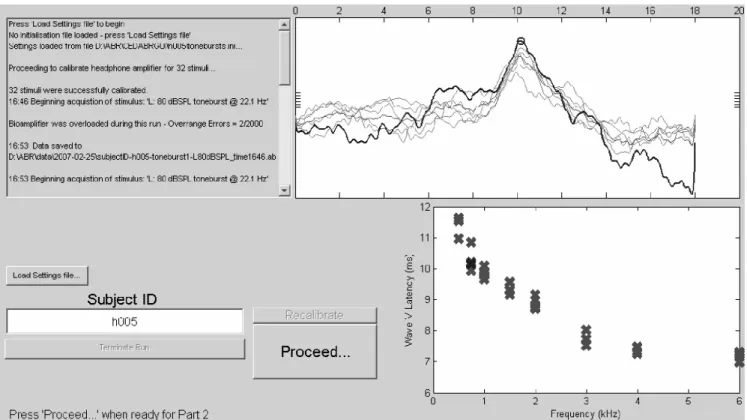
The display in Fig. 3. shows the operator interface. Results are software-filtered (3 kHz low-pass) and all repeat traces are displayed to assist the operator. The summary chart at the bottom right indicates Wave V latency versus test frequency. When the operator has marked all the Wave V locations, he/she then clicks ‘Proceed’, which initiates the calculation of a travel-time function and the second half of the acquisition protocol.
C. Fitting Wave V Latencies to a Travel-Time Function
Fig. 2. A customized chirp, showing instantaneous frequency versus time.
Fig. 3. The interface used for our ABR acquisitions. At the bottom right is the summary chart of marked Wave V locations versus toneburst frequency.
Reference [14] describes forward latency as the travel time of a particular frequency component from stimulus onset to its characteristic place (CP) on the basilar membrane. It has been shown [12], [14]-[17] that a power-law function is appropriate to model the frequency-dependent forward latency function of the inner ear. This takes the form;
c
af
t
=
−b+
(1)where t is the travel time (s), f is the tone-burst frequency (kHz), and a, b, c, are constants to the fit.
The first term represents the mechanical component of the Wave V latency - due largely to the traveling-wave delay along the cochlear partition. The offset, c, represents a fixed frequency-independent neural delay [14].
In our study, the calculation of the constants employed several fitting methods, giving eight fit candidates per test subject. The algorithms used were Trust-Region and Levenberg-Marquardt, with the optional inclusion of a ‘robust’ constraint (which minimizes the summed-square of the residuals and down weights outliers using bi-square weights). The four additional fit methods constrained the neural offset, c, at 0 seconds.
In this way, each of the obtained Wave V latencies is used to determine the appropriate instantaneous frequency in the rising-frequency sweep. Fig. 2 demonstrates how each Wave V latency correlates to an instantaneous frequency on the chirp timeline; −
=
b ba
t
t
f
1 1)
(
(2)where t is the time (s), f is the instantaneous frequency (kHz), and a, b, are the fit constants.
III. RESULTS A. Tone-evoked Wave V Latencies
Table 1. Mean tone-burst-evoked Wave V latencies and standard deviations for our sample population.
Table 1 shows the overall frequency-versus-latency results for 11 test subjects. Although our methods disregard the population average, the results still demonstrate the degree of inter-subject variability. This supports the proposition that differences in subject physiology need to be accounted for when compensating for travel-times on the basilar membrane.
B. Confirmation of Previous Studies
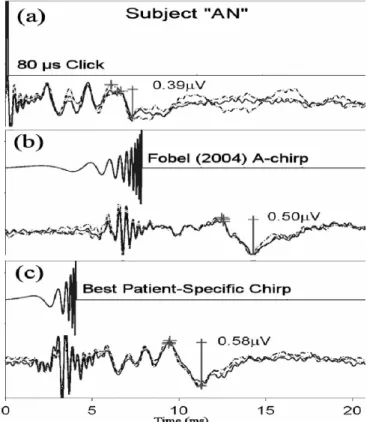
As a preliminary analysis, to investigate the findings of [4] the Wave V amplitude of ABRs evoked with their “A-chirp” stimuli were compared to the amplitude of ABRs evoked with an 80 µs click stimuli. In all our measurements, the amplitude of Wave V was defined to be from the peak of the Wave IV+V complex to the bottom of the immediately following trough. Three repeats per stimuli gave n = 3.
Fig. 4. Sample ABR results from subject "AN". The stimuli used to evoke each ABR are immediately above each result, and there are 3 repeat traces per stimuli.
We chose to use a non-parametric analysis, the Friedman ANOVA test, to minimize inter-subject effects on measured amplitudes due to such sources as differing electrode-impedance or earphone insertion depth. The Friedman test is used to detect differences in treatments across multiple test attempts and places greater significance on the ranking of results, rather than the quantitative value. The procedure involved ranking each block of n rows together, then considering the values of the ranks by columns. However, for completeness, we state the mean ensemble Wave V amplitudes with standard deviations in table 2.
choice of stimulus (click or A-chirp) made no difference to the amplitude of Wave V (i.e., that the evoked amplitudes were equal). However, we found (p < 0.005) that the choice of stimulus affected the size of Wave V. Secondly; we found (p < 0.005) that the A-chirp elicited greater Wave V amplitudes in most cases. This result confirmed the findings of previous studies such as [2], [4].
C. Comparison to Patient-Specific Chirps
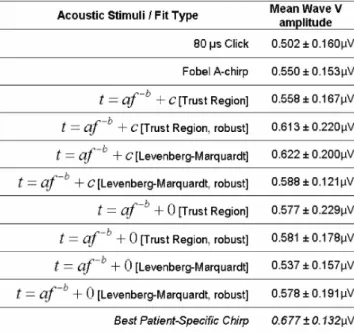
In our study, we parameterized patient-specific stimuli from tone-evoked ABR results using eight different fitting methods. We used a Friedman ANOVA test to compare fitting methods, but we were unable to reject the null hypothesis that the evoked amplitudes from each fitting method were equal. Therefore we suggest that a larger population of test subjects will be needed before an appropriate fitting paradigm can be determined. However, on the assumption that the methodology and accuracy could be improved, we resolved to nominate the best fit per test subject based on the greatest mean Wave V amplitude.
Table 2. Mean Wave V amplitudes and standard deviations for our sample population. The stimuli used to evoke each ABR are shown in the left column. In the case of the customized chirps, the details
of the fit methods are shown (see text).
Although this is statistically biased in favor of the ‘best performers’, the ABRs elicited by these patient-specific chirps are repeatable. The following comparison demonstrates the possibility that a more finely-tuned system could offer patient-specific stimuli with the same advantages shown here.
The null hypothesis for this comparison was that the choice of stimulus (click, A-chirp, or best patient-specific chirp) made no difference to the amplitude of Wave V. We found (p < 0.005) that the best performing patient-specific chirp from each subject evokes significantly greater Wave V amplitudes than either the Fobel A-chirp or click stimuli.
This result supports the hypothesis that a chirp that has been customized to a particular test subject is capable of evoking maximal Wave V amplitudes.
IV. CONCLUSION
Although the methodology used to calculate the parameters of the customized stimuli needs improvement, the results from this study suggest that customizing the parameters of the rising-chirp stimuli to match the physiology of a particular test subject is a significantly better than using a normalized, “one-size-fits-all” approach.
REFERENCES
[1] Delgado, R.E. and O. Ozdamar, Automated Auditory Brain-Stem Response Interpretation, in Ieee Engineering in Medicine and Biology Magazine. 1994. p. 227-237.
[2] Dau, T., et al., Auditory brainstem responses with optimized chirp signals compensating basilar-membrane dispersion. Journal of the Acoustical Society of America, 2000. 107(3): p. 1530-1540. [3] Fobel, O., Auditory Brainstem and Middle Latency Responses with
Optimized Stimuli: Experiments and Models. 2003.
[4] Fobel, O. and T. Dau, Searching for the optimal stimulus eliciting auditory brainstem responses in humans. Journal of the Acoustical Society of America, 2004. 116(4): p. 2213-2222.
[5] Don, M., et al., Gender Differences in Cochlear Response-Time - an Explanation for Gender Amplitude Differences in the Unmasked Auditory Brain-Stem Response. Journal of the Acoustical Society of America, 1993. 94(4): p. 2135-2148.
[6] Ponton, C.W., et al., Frequency-Specific Maturation of the 8th Nerve and Brain-Stem Auditory Pathway - Evidence from Derived Auditory Brain-Stem Responses (Abrs). Journal of the Acoustical Society of America, 1992. 91(3): p. 1576-1586.
[7] Conti, G., et al., Latency of the Auditory Brain-Stem Response (ABR) and Head Size Evidence of the Relationship by Means of Radiographic Data. Scandinavian Audiology, 1988: p. 219-223. [8] Antonelli, A.R., et al., The Relationship of Head and Brain-Stem Size
to Main Parameters of ABR in the Developmental Age and in Adults. Acta Oto-Laryngologica, 1988. 105(5-6): p. 587-590.
[9] Ballantyne, D., Handbook of Audiological Techniques. 1990, London: Butterworth-Heinemann.
[10] Lütkenhöner, B., et al., Verbesserung der Synchronisation auditorisch evozierter Hirnstammpotentiale durch Verwendung eines die cochlearen Laufzeitunterschiede kompensierenden Stimulus. Arch Otolaryngol Supplement 2, 1990: p. 157 - 159.
[11] Wegner, O. and T. Dau, Frequency specificity of chirp-evoked auditory brainstem responses. Journal of the Acoustical Society of America, 2002. 111(3): p. 1318-1329.
[12] Gorga, M.P., et al., Auditory Brain-Stem Responses to Tone Bursts in Normally Hearing Subjects. Journal of Speech and Hearing Research, 1988. 31(1): p. 87-97.
[13] Murray, J.G., et al., Tone burst auditory brain stem response latency estimates of cochlear travel time in Meniere's disease, cochlear hearing loss, and normal ears. American Journal of Otology, 1998. 19(6): p. 854-859.
[14] Neely, S.T., et al., Latency of Auditory Brain-Stem Responses and Otoacoustic Emissions Using Tone-Burst Stimuli. Journal of the Acoustical Society of America, 1988. 83(2): p. 652-656.
[15] Greenwood, D.D., A Cochlear Frequency-Position Function for Several Species - 29 Years Later. Journal of the Acoustical Society of America, 1990. 87(6): p. 2592-2605.
[16] Pantev, C., et al., Frequency-Specific Contributions to the Auditory Brain-Stem Response Derived by Means of Pure-Tone Masking. Audiology, 1985. 24(4): p. 275-287.
[17] Wit, H.P. and R.J. Ritsma, Evoked Acoustical Responses from the Human Ear - Some Experimental Results. Hearing Research, 1980. 2(3-4): p. 253-261.