Evaluating Consumer Preferences for Medicare Part D Using Conjoint
Analysis
La’Marcus Wingate
The University of Tennessee Health Science Center
13th Annual Joint Conference of the Retirement Research Consortium August 4-5, 2011
Washington, DC
The research was supported by a grant from the U.S. Social Security Administration (SSA) as part of the Retirement Research Consortium (RRC). The findings and conclusions expressed are solely those of the author and do not represent the views of the SSA, any agency of the federal government, the University of Tennessee Health Science Center, or the Center for Retirement Research at Boston College. I would like to thank Sawtooth Software (Sequim, WA) for providing the software necessary to carry out this analysis.
2
Part I: Background
Medicare was established in 1965 through Title XVIII of the Social Security Act at a means of helping to provide security against the disproportionate health care risks borne by seniors at least 65 years old, and younger individuals under 65 with certain disabilities including end stage renal disease. The majority of the programs enrollees are senior citizens; in 2010 there were 47 million total beneficiaries with 39 million senior citizens. Medicare is the nation’s largest health insurance program in both enrollment and expenditures, as federal spending on the benefits amounts to over $500 billion dollars. The vast majority of the nearly 40 million
Americans over the age of 65 are automatically enrolled in Medicare Part A, which provides coverage for inpatient hospital visits and skilled nursing visits among other services. Virtually all of these seniors are automatically enrolled in Medicare Part B which covers outpatient hospital services, physician visits, preventive care, and other types of services. During the 1970’s beneficiaries were also given the option of enrolling in Medicare Part C where their services would be provided through a privately owned managed care corporation under the jurisdiction of Medicare. These companies were required to provide at minimum the benefits available in Medicare A and B, and offer additional services at their discretion.
One notable exception to the services provided in Medicare A and B is prescription drug coverage. Medicare Part D, the outpatient prescription drug benefit available through Medicare, was enacted through the passage of the Medicare Modernization Act of 2003 (MMA) with the intention of helping to alleviate the burden of prescription drug costs for seniors, particularly those with no previous drug coverage and those with inadequate prescription coverage. The program was not formally implemented until 2006. The rationale for prescription drug coverage to be included in Medicare has been well documented. Senior citizens tend to have more chronic diseases which require pharmacologic therapy. Recent research indicated that senior citizens had nearly 23 prescriptions filled on an annual basis, nearly double that of the average for the U.S. population as whole (Adamcik 1998, Families USA 2000).
Following the implementation of Medicare Part D, seniors had several options for enrolling in the program. Senior Citizens who had prior coverage which was actuarially superior to Medicare Part D were encouraged to retain their current coverage. This group consisted primarily of individuals who had previous coverage from employers which received a government subsidy to continue providing the insurance. Seniors could also access prescription drug coverage through enrollment in a Medicare Part
3
C (Medicare Advantage) program. The majority of seniors enrolled in Medicare Advantage already had some type of prescription drug coverage. Seniors were already afforded these opportunities for accessing prescription drug coverage prior to passage of the MMA, but the legislation also created stand alone drug plans. These were known as Prescription Drug Plans (PDPs). Senior citizens with limited incomes (less than 150% of poverty) and limited assets were eligible to receive a low income subsidy (Kaiser Family Foundation, 2010b). Certain seniors who met these qualifications were automatically enrolled into the Part D program and the low income subsidy programs, including those eligible for Medicaid (dual eligibles) and those only receiving SSI. These were the only individuals automatically enrolled in Medicare Part D; enrollment was completely voluntary for other seniors. However, unless they have creditable coverage superior to Medicare Part D, seniors are charged a penalty of 1% of the average national monthly premium for each month they delay enrollment in the program upon reaching eligibility.
Medicare Part D is unique in that insurers are required to offer a prescription insurance plan which has benefits that are actuarially equivalent to or at least as good as the standard prescription benefit specified by the Center for Medicare and Medicaid Services (CMS). For plans covering beneficiaries in 2011 this is defined as a plan with a $310 deductible and 25% costs haring for the patient up to $2,840. After reaching $2,840 in total drug costs, the patient is responsible for 50% of the cost of brand name drugs and 93% of the cost of generic drugs until a total drug cost of $6,448 is reached. The sudden increase in copayments for seniors between $2,840 and $6,448 in drug costs has been termed the doughnut hole, and has been a major target of recent health care reform. Prior to 2011, beneficiaries were solely responsible for all
medication costs during this period. However with the passage of the Affordable Care Act of 2010, drug manufacturers and prescription drug plans are slated to assume progressively greater cost sharing during this period so that patients will also have cost sharing of 25% during this phase of the plan by 2020 (Kaiser Family Foundation, 2010b). Upon reaching $6,448 in total drug costs, catastrophic coverage takes over, and the beneficiary is only responsible for 5% of the costs.
However insurers are not restricted to this format in determining structure of their plans. They have the latitude to determine their copayment structures as long as their plans are
actuarially equivalent to the standard benefit. In fact, less than 15% of PDPs use the structure whereby patients pay 25% for each medication (Kaiser Family Foundation, 2010a). The
4
majority of PDPs use tiers to divide medications into three types of classes: generic, brand, and specialty. There is wide variation in the arrangement of tiers available, and there is no typical structure. It is most common for plans to have a flat dollar copayment on brand and generic medications.
There is also considerable variation in the amount of deductibles offered by PDPs. In a given year approximately a third of PDPs charge the maximum allowed deductible, which is the deductible specified in the standard benefit plan (Kaiser Family Foundation, 2010a). There are a smaller percentage of plans which may have a deductible smaller than the maximum allowed deductible. In a given year, at least 40% of PDPs have no deductible. Finally, there is also variation in the doughnut hole coverage offered by PDPs. Although most plans do not have doughnut hole coverage, there are a few plans which do. Even among those offering doughnut hole coverage, there are differences among plans as plans may cover all, some, or only a few generics. It is rare for plans to cover brand name drugs during this time.
With all of the variation in plans, it is quite obvious that many may offer coverage which is in fact superior to that specified through the standard benefit. Plans which do feature this type of coverage where their actuarial value is superior to that of the standard benefit are called enhanced plans. Plans may offer enhanced coverage through a variety of mechanisms. For example, plans may have a 25% coinsurance rate on all medications but offer coverage in the doughnut hole. Alternatively, plans may have a 25% coinsurance rate and no gap coverage, but they could have a partial deductible or no deductible at all. Some plans may have enhanced coverage, because although they have the maximum allowed deductible and include no gap coverage, the coinsurance on the medications is lower than that specified in the standard benefit plan.
One central premise of the PDPs is that they are administered entirely through private companies, and seniors must choose from among the plans which are offered to them. This was done in order to use market based principles of competition whereby plans would be compelled to compete with each other so that seniors would have premiums close to marginal cost. This continued the trend of moving away from the fee for service structure which Medicare was established under in 1965. As such, there has been a body of literature which addresses seniors enrollment into Part D in two facets: whether or not they choose to enroll in the program at all, and secondarily whether they make an efficient choice by choosing the plan which offers them
5
the best benefits. The following is a brief summary of relevant studies looking at choice of a plan.
Part II: Prescription Drug Plan Choice in Medicare Part D
Frakt and Pizer’s analysis of prescription drug plan choice was published in 2010. Their study analyzed data from all Medicare Beneficiaries in 2007 after excluding those with creditable coverage, those enrolled in Medicare Advantage plans, and those enrolled in low income subsidy plans. Their data sources were all publicly available files from CMS and included the PDP landscape source file, the annual enrollment by plan file, and the prescription drug formulary and pharmacy network file. In focusing exclusively on the Medicare PDP
market, their two-stage least squares regression model was designed to model the probability of a particular Medicare Part D plan being chosen. Several covariates were included such as the premium amount, the deductible amount, the minimum preferred copay, the maximum preferred copayment, the presence of generic gap coverage, the presence of brand name gap coverage, the number of formulary plans, and a designation of whether a plan was actuarially equivalent to a plan with standard benefits. The authors demonstrated a premium elasticity of -1.45. Variables which were inversely associated with choice of prescription drug plans included higher
deductibles, greater minimum preferred copays, and an increased number of formulary tiers. Factors which were positively associated with the probability of a prescription drug plan being chosen were a higher maximum preferred copayment, coverage for brand name medications in the coverage gap, and the plan being actuarially equivalent to the standard plan. Coverage for generic medications in the doughnut hole was not significantly associated with a plan being selected. Many of these findings are intuitive such as lower premiums, deductibles, and
minimum copayments being associated with higher enrollment as these would lead to lower out of pocket costs. However the finding that basic benefits would be associated with greater probability of a plan being selected is puzzling, as plans have the option of offering superior enhanced coverage. However, the authors speculate that this may be due to these plans having lower cost. The authors conclude that their premium elasticity is greater than that seen in the Medicare Advanatage Market.
Heiss and colleagues (2007) used data collected from the 2005-2007 waves of the Retirement Perspectives Survey to analyze senior’s perceptions and choices of Medicare Part D plans. The Retirement Perspectives Survey is conducted by the researchers and surveys a
6
random group of seniors chosen to be a representative sample of the non-institutionalized U.S. population. In order to construct measures on the respondent’s projected and actual out of pocket medication costs, the researchers utilized the Medicare Current Beneficiary Survey along with median retail prices of drugs obtained from internet sites. They concluded that the senior’s amount of drug expenditures in 2005 was a very good predictor of determining which seniors without credible coverage would enroll in Medicare Part D plans and that most of the seniors who would benefit from enrollment in a Medicare Part D plan had in fact enrolled. When choosing between different plans, seniors tended to choose ones with lower premiums, even if the actuarial value was less than another plan which may have been more comprehensive and actually resulted in lower estimated annual cost. The authors also explored beneficiaries
willingness to pay for various plan features such as doughnut hole coverage and no deductibles. Seniors were willing to pay significantly more to have plans with no deductible and doughnut hole coverage for brand name drugs when holding other features constant. The use of drug tiers and restrictive formularies were associated with lower prices with which beneficiaries were willing to pay for plans. This may be the most comprehensive study as of yet to look at seniors choice of prescription drugs, but like the Frakt and Pizer study, it ignores the potential impact of the importance of being able to maintain relationships with the pharmacy or pharmacist on prescription drug plan choice.
Abaluck and Gruber (2009) used secondary data obtained from the prescription drug records of the Wolters Kluwer company which processes approximately 31% of all third party prescription claims in the United States. The researchers had access to 2005 and 2006 data. Variables which were associated with a lower probability of a prescription drug plan being chosen were higher premiums, the total out of pocket costs incurred with a plan, and higher deductibles. Any type of doughnut hole coverage, a higher proportion of drug costs covered, and a greater number of drugs included on the formulary were associated with a greater probability of a plan being selected. The authors concluded that premiums were far more important than other cost sharing characteristics in helping to determine seniors choice of a prescription drug plan, and seniors also had little appreciation for plans which would minimize their variability in spending. According to their analysis, if seniors had done an optimal job of selecting plans which minimized their expected annual cost, then they could have saved approximately 27% in annual drug expenditures. This paper contributes to the literature
7
regarding the relationship of drug benefit plan characteristics to prescription drug plan choice, but it does not address the influence of delivery system characteristics or the influence of demographic characteristics on plan choice.
Part III: Conceptual Model
The conceptual model for this study is a modified version of Cline and Mott’s Model (2003) for choosing a prescription drug plan which is in turn derived from Berki and Ashcraft’s Model (1980) for choosing a health care plan.
Berki and Ashcraft proposed that there are several factors which directly influence the amount of health care services an individual or family will use. These include economic characteristics which influence the amount of financial capital that the unit (either family or individual) will be able to apply towards health care services. Certain risk factors such as age, and general health are also expected to influence the amount of health care services utilized. In turn, the expected utilization of medical services is expected to have a direct effect on the financial loss hypothesis and risk perception hypothesis. The financial loss hypothesis
essentially states that, if all other factors are held constant, individuals or families will attempt to choose plans that minimize their expected financial outlays based upon the amount of services they believe will be incurred. The risk perception hypothesis proposes that when purchasing health insurance, if other factors are held the same, decision makers will avoid plans that do not have services they believe they will need. The perception of risk and financial loss have a direct influence on the benefit characteristics, which consist of the copayments and premiums one desires in a plan. The model also proposes that the context in which services are delivered is important in the choice of a plan. The delivery system characteristics are concerned with questions such as from what providers (e.g. physicians and/or hospitals) the beneficiary will be able to obtain coverage. The delivery system characteristics along with the benefit
characteristics directly influence the choice of plan.
Although the Cline and Mott Model (2003) and the Berki and Ashcraft Model (1980) are very similar for the most part, there are a few substantive differences which are noted here. The most obvious difference between the two models is that the Cline and Mott model deals with the choice of a prescription drug plan, whereas the Berki and Ashcraft Model was developed for choice of health care plans. From this, it naturally follows that the Cline and Mott model does not deal with expected utilization of health care services such as physician or hospital visits, but
8
rather anticipated consumption of prescription medications. Moreover, within the context of insurance characteristics, the benefit package in the Cline and Mott model is not concerned with the breadth of services covered, but rather the range of medicines which is covered by the beneficiary’s plan. Whereas the Berki and Ashcraft model describes the delivery system
characteristics in terms of hospitals and physician access the Cline and Mott Model evaluates the delivery system characteristics of access and continuity with respect to pharmacists and
pharmacies.
The proposed model for this study followed the Cline and Mott Model closely with two notable exceptions. Within the benefit plan characteristics, the deductible and doughnut hole coverage have been added, as these are prominent features of the Medicare Part D prescription drug plans. Moreover, this study included the restrictiveness of eligibility requirements
for Medication Therapy Management Services (MTM) as an attribute (Winston and Lin 2009). This is a set of services with the goals of providing education, improving adherence, or detecting adverse drug events in the Medicare population, and legislation concerning the provision of these services was also a part of the Medicare Modernization and Improvement Act of 2003. These services can be provided by a pharmacist on site at a pharmacy, or alternatively they may be provided over the phone.
Part IV: Conjoint Analysis Overview
The methodological approaches in evaluating consumer choice of insurance plans involving primary data collection have evolved over time. Historical approaches that have been used include asking open ended questionsor asking patients to evaluate plans on the basis of a single attribute such as the premium. However, these approaches have acknowledged
limitations. Asking consumers of health care plans to evaluate only one attribute at a time is limited because it is recognized that in actual situations, individuals consider multiple attributes of potential plans simultaneously when making purchasing decisions. Asking consumers open ended questions is limited also, as research shows that consumers self reported importance of health plan attributes is an inaccurate measure of the actual importance they place on different attributes (Fishbein and Ajzen, 1975).
A marketing research technique that aligns more strongly with the principles of models of choice behavior and bypasses these limitations is conjoint analysis (Orme 2010). Conjoint analysis
9
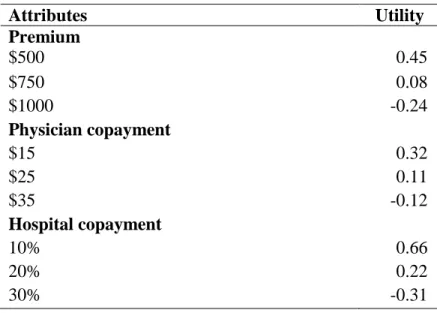
operates on the premise that consumers choose products or services on the basis of the combined value of the aggregate attributes which compose the product or service. So within conjoint analysis, products or services are composed of certain attributes which are further subdivided into different levels which carry a distinct value or part-worth for each person. Within health insurance, possible attributes include the premium, copayments, and types of services covered. A level is a value that an attribute might take. For example, in the simple example depicted in Table 1, levels for monthly premiums of health insurance could hypothetically include $500, $750, or $1,000. Each of the different levels carries a unique value or part-worth for each respondent. The influence of a particular level depends on how important the attribute is to the respondent.
Table 1: Part worths for hypothetical study
Attributes Utility Premium $500 0.45 $750 0.08 $1000 -0.24 Physician copayment $15 0.32 $25 0.11 $35 -0.12 Hospital copayment 10% 0.66 20% 0.22 30% -0.31
In the most popular forms of conjoint analysis used today, respondents are presented with a profile where at least two different products are depicted. These profiles are called choice tasks. Each profile will have the same attributes, but the levels will vary from one profile to another. Respondents are then asked to choose which product they prefer.
After finding out the most important attributes in plans and their relative importance, decision makers can make practical applications with this information. They can devise health plans which have an ideal blend of attributes and levels by figuring out which combination of proposed levels would be more successful in the marketplace. For example, in the example
10
shown in Table 1 a plan with a premium of $500, physician copayments of $15, and hospital copayments of 30% would have a utility of .46 after adding up the part-worths associated with each level. Alternatively, plans with premiums of $750, physician copayments of $25, and hospital copayments of 10% would have a utility of 0.85. However, conjoint analysis can also allow one to adjust for heterogenous preferences within the population. Researchers can repeat the same procedure performed on the aggregate sample for each individual. In the “first choice” rule, one assumes that each individual will purchase the specific plan offering them the greatest utility so that one can simulate the proportion of patients who would purchase a given product (Orme 2010).
Part VI: Formulation of Conjoint Analysis Survey
The drug benefit plan characteristics, including the premium, deductibles, and doughnut hole were all included as attributes within the conjoint analysis survey. In general, it is
recommended to include 3 to 5 levels for each attribute (Orme 2010). The levels chosen should represent what a consumer would see in the actual market place, and be mutually exclusive. Therefore, in order to ensure that the presented attributes were realistic, the cost sharing features of the 2010 PDPs were consulted (Centers for Medicare and Medicaid Services, 2010).
These cost sharing features were derived after consulting the Medicare Part D plans available in Shelby County during 2010 using Medicare Part D’s Drug Plan Finder website.The website displays each of the plans which are offered to seniors in a region during each year, and also offers them the opportunity to see their estimated annual cost after they input their
medications and pharmacy preferences.
Most of the differences in the range of premiums were determined by the plan’s
deductibles and doughnut hole coverage. In order to present realistic prices, the summed pricing approach of Sawtooth Softwares (2010) Adaptive Choice-Based Conjoint Analysis Program was used.This feature allows the price, in this case the premium, to function as a continuous variable by allowing random variation around a price that is based upon the components intrinsic to the product which may affect price. In this study, the price was allowed to fluctuate from between 30% below or 30% above the “average” price of the prescription drug plan package based upon the deductible and gap coverage it contained. This 30% variation allowed the investigator to have enough variation in price to cover most of the premiums that were being offered in the
11
market in 2010, and also represented the recommended levels to be used with the Adaptive Choice-Based Conjoint Analysis Software. Other attributes included that were not found to be directly related to the price were formulary coverage, pharmacy access, brand copayments, generic copayments, and MTM eligibility levels.
Variables such as gender and race are not part of the conceptual models yet they were evaluated in this study as they are standard sociodemographic variables. These variables may be useful in helping to identify certain demographic segments of the market which may have unique preferences. The economic characteristics were evaluated by asking seniors about their
household income. This question took the form of a categorical variable, and income ranges were included which were appropriate for seniors. It was explicitly stated to the respondents to include their social security and retirement benefits in their estimation of income as it is expected that few, if any of them, will be working. Several questions were asked to evaluate the use of risk factors. Seniors were asked to provide their self reported age. The number of acute and chronic Medical Conditions was evaluated by asking patients whether they have the conditions which are listed in the 2005 Medicare Current Beneficiary Health Status and Functioning Survey (Centers for Medicare and Medicaid Services, 2005). The patient’s use of prescription
medications was ascertained be asking them to self report the number of prescription
medications they have been taking for the previous 30 days and the out of pocket cost for these medications.
The seniors who were administered the survey were members of senior centers or senior apartment homes in Shelby County, Tennessee. Informed consent was obtained before each interview, and the investigator administered each survey on a one on one basis with each senior in order to explain the survey and answer any questions the seniors may have. The surveys took an average of 30 minutes for each senior to complete, and seniors received a gift card to a local grocery chain as compensation for their time.
Part VII: Data Analysis
The utility values for the sample were derived using hierarchial bayes (HB) estimation through the use of Sawtooth Software’s (2010) CBC/HB software. Hierarchical bayes has lower and upper level models used in estimating the part worth values. A lower level model is used in estimating part worths at the individual level, and an upper level model is used in measuring population parameters. The lower model assumes that the individual’s partworths for each
12
attribute which ultimately determine their probability for choosing a plan with specified characteristics conform to a multinomial logit model. The lower model is described mathematically by the following equation:
pk = exp(xk' ßi )/∑exp(xj' ßi).
The probability of choosing a particular product in comparison to other products is designated by pk (Sawtooth Software, 2010). Several factors help to determine the probability in
selecting a specific product or service, Xk. More specifically, this probability is a function of Xi,
the levels which make up the product or service, and βi, the individual’s part worths for those
specific levels. As the equation shows, the total utility derived by an individual from a given product is obtained by adding up the respondents part worths for each level presented in the specified product. The total utility is then exponentiated. After these same functions have been performed for all other alternatives presented to the respondent, the probability that the
respondent will choose a given product is derived by dividing that product’s exponentiated utility by the total exponentiated utility of all alternatives presented. For example, consider product A with a total utility of 5, product B with a total utility of 7, and product C with a total utility of 8. Raising e to the fifth power yields 148, while raising e to the sixth power yields 1097, and raising e to the eighth power yields 2981. In order to find the probability that any particular product will be chosen, one simply divides that products exponentiated utility by the sum of the total
exponentiated utilities. In this example, the probability that product B will be chosen is 1097/4,226 or 26%.
The upper model in HB is described by the mathematical formula Bi~Normal (α,D).
Once again βirepresents the part worths for a specific respondent, while α is used to describe the
estimate for the average part worth for the specified level across all respondents taking the survey. The distribution of the variances and covariances across all of the respondents is described by D. The HB model assumes that α and D can be approximated by a normal distribution.
The covariate feature of Sawtooth Software’s (2010) CBC/HB software was used in determining if the premium part worth values differed significantly between segments. For each covariate examined the software produces a point estimate of the magnitude of the difference in between the part worth being examined and the reference value examined. For example in
13
examining race, the reference group of Caucasians may have a part worth of 0.787 for the premium. However, the program also reports that blacks on average have a part worth value which is 0.165 higher than whites. In order to determine statistical significance, one examines the estimates of the added values to the part worth due to the covariate after convergence of the part worth value has been assumed. In this study, 20,000 iterations were performed to allow for convergence, and an additional 20,000 iterations were performed to allow for stable estimates of the α parameter. The parth-worth estimates from the covariate of interest were examined at the 2.5% percentile and the 97.5% percentile in order to obtain a 95% confidence interval and evaluate whether they were statistically significant. If the values crossed zero then they were not assumed to be significant. So in this example, the value of the added part worth due to being black may be -0.031 at the 2.5% percentile and 0.293 at the 97.5% percentile, so it cannot be termed significant because it includes zero.
After the part worth values were obtained using covariates in Sawtooth Software’s CBC/HB, the respective utility runs were imported into the Sawtooth Software ‘s (2010) SMRT program and the utility runs were utilized with the appropriate group. For example, if the sample was divided into three groups based upon their pharmacy preference scores, the utility run
obtained by using these preference scores as a covariate in CBC/HB were imported into SMRT and the sample was divided into these three segments in SMRT. The SMRT program rescales the scores using a method known as zero centered diffs so that the total sum of the part worth between the least preferred and most preferred levels of each attribute across attributes is equal to the number of attributes times 100.
The importance scores for each attribute were determined to assess the relative
importance consumers placed on each attribute. Within each attribute the difference in utilities between levels holding the highest utility and the lowest utility were calculated to obtain the attribute utility range for that particular attribute. These attribute utility ranges were summed to produce a utility range total. The attribute utility ranges were divided by the utility range total to produce an importance score for the respective attribute. These measures were performed using Sawtooth’s Softwares SMRT program (2010).
The willingness to pay values were computed using standard methods in conjoint analysis. The differences between the partworths values for the reference level and the level of interest were obtained and divided by the appropriate premium coefficient.
14 Part 8: Results
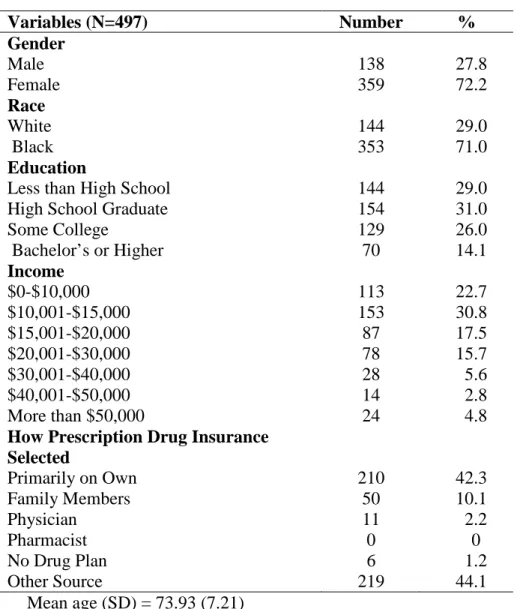
A description of the sample’s demographic characteristics are provided in Table 2. A total of 497 seniors were interviewed. The sample had a mean age of approximately 74 years. Approximately 72% of the sample was female and approximately 28% was male. Most of the respondents (71%) were African American but there were also 144 Caucasians interviewed. Over 70% of the sample had graduated from high school, but just over 14% had obtained at least a bachelor’s degree. Nearly a quarter (26%) of the respondents indicated they had completed some college without obtaining a four year degree. A large portion of the seniors (53.5%) had incomes under $15,000, indicating that they were on relatively fixed incomes. Only 7.6% of the respondents indicated that they had annual incomes in excess of $40,000 annually. Nearly four out of ten (38.8%) of the seniors interviewed had incomes of $15,000-$40,000 annually. The mean number of comorbidities reported was 1.97 with a standard deviation of 1.82, while the mean number of prescription medications taken was 5.15 with a standard deviation of 3.64 (data not shown).
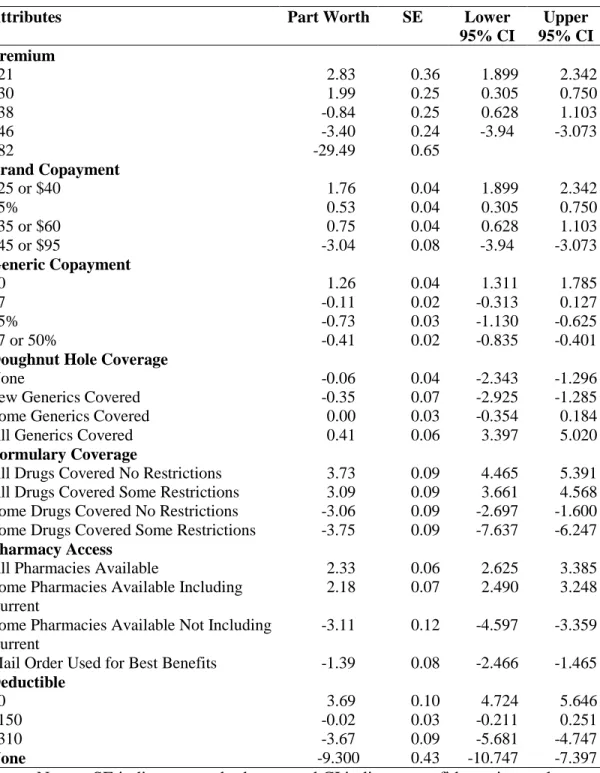
Table 3 shows the mean part worth values for the aggregate sample when using premium values of $21, $30, $38, $46, and $82. The values of $21 and $82 were chosen for analysis because they represent the lowest and highest values available for the premium in the survey, while the other points were chosen because they were thought to represent break points as they were the premium values associated with different values for the deductible. When comparing parth worth values it is important to remember that one cannot compare the absolute values across attributes. For example, although having all drugs covered with no restrictions and a zero dollar deductible both have part worth values of approximately 3.70 one can not accurately state that the utility derived from including these two levels in a plan will be the same. However it is permissible to compare the differences between levels across attributes. As an illustration, consider that the difference in part worth values between having all drugs covered with no restrictions and having some drugs covered with some restrictions is approximately 7.5, while the difference in between the part worth values of having a zero dollar deductible and a $310 deductible is approximately 7.4. Thus the difference in utility in between these two extreme states is approximately the same.
15
When looking at the premium attribute, it is apparent that the decrease in part worths is accelerated at higher prices. The change in part worth values as a result of going from a plan with a $21 premium to a similar plan with a $30 premium is 0.84. However going from a $38 plan to a $46 plan causes a decrease of 2.56 in the part worth values. The difference of 2.56 in part worth values is considerable as this is greater than the difference in between going from zero dollar generics to having a copayment of 25% on generic medications. In general, it appears that the seniors are less sensitive to changes in premiums at lower prices.
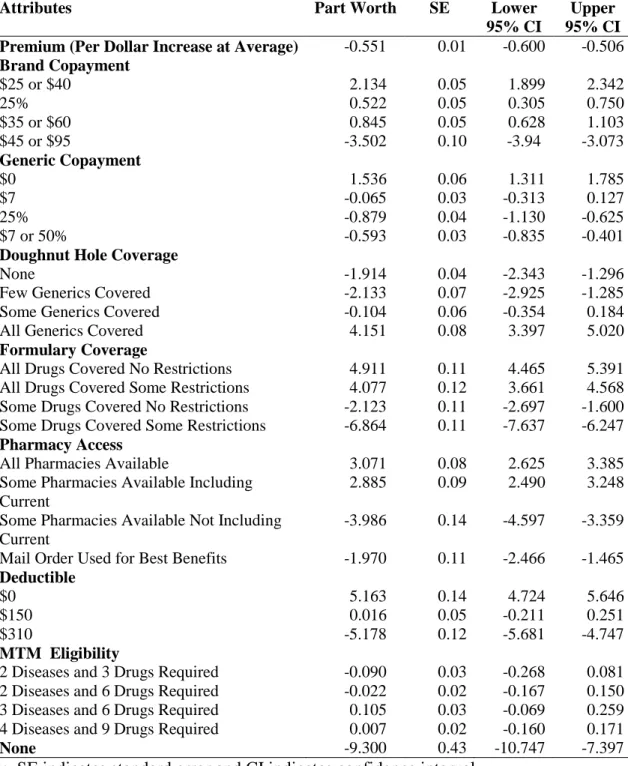
The rest of the results regarding the aggregate part worths will be discussed as they are depicted in Table 4. This table is slightly different from Table 3 in that it evaluates the premium as a one dollar increase at the average value, similar to many traditional studies. In this method as well, the premium had a strong effect on respondent’s utility as every marginal dollar increase above the average decreased a respondent’s utility for a plan by 0.551. However, one should remember that this may overstate the value of premiums at lower prices, and understate the value of premiums at higher prices. Within brand copayments, the seniors who were surveyed
displayed a strong preference for plans offering copayments of $25 or $40, as these copayment types had a part worth of 2.134. The next level within copayments that was preferred most among the sample was copayments of $35 or $60 followed by copayments of 25%. However, there was relative indifference between 25% cost sharing levels and copayment levels of $35 or $60 as the upper 95% confidence interval for 25% costsharing plans is higher than the lower 95% confidence interval of $35 or $60 copayments. The $45 or $95 copayment had the lowest part worth value.
Within generic copayments the most preferred level was $0 copayments, followed by copayments of $7. The copayment structure of $7 or 50% was the third most preferred level, while 25% coinsurance was the least preferred level within this attribute. However, there was not a statistically significant difference between the 25% costsharing levels and the $7 or 50% copayment structure as the confidence intervals for these two levels crossed.
Strong consumer preferences were displayed within the deductible attribute and followed a logical order. The difference in part worth values from $0 to $150 (5.147) was nearly identical to the difference in part worth values in going from $150 to $310 (5.194).
Within the attribute of doughnut hole coverage, the least preferred level was few generics covered followed by no generics covered in the doughnut hole. However, there is no statistical
16
significance in between these levels as the confidence intervals share common values. With both of these levels, the part worth was approximately -2. The most preferred level in this attribute was coverage for all generics in the doughnut hole, with a part worth over 4 followed by having some generics covered in the doughnut hole. In general the seniors seem to exhibit greater utility for having plans where all or most of the generics are covered within the doughnut hole, but only including a few generics covered during this period does not affect their utility in a way that is different from having no doughnut hole coverage whatsoever. Within the attribute of formulary coverage, respondents indicated a rational order where they preferred to have all of their
medications without restrictions. The most preferred level was to have all drugs covered with no restrictions, followed by having all drugs covered with some restrictions. However these
measures are not statistically significant from each other as their confidence intervals share common values. The level that was preferred the third most in this attribute was some drugs covered with no restrictions.
Within the pharmacy access attribute the most preferred level was to have all pharmacies available, although it was not statistically different from having only some pharmacies available but being able to continue using the current one. The least preferred level within this attribute was not being able to use the current pharmacy, while having to use mail order to obtain the best benefits was the third most preferred level and significantly different from other levels in this attribute.
The part worth values for MTM eligibility do not reflect a logical order and have relatively small part worths. This may indicate that this attribute was not clearly understood by the respondents despite the researcher’s efforts to explain them, or the respondents may not have placed great importance on this attribute when compared to other attributes.
The value placed on the none parameter was -9.300 which represents the intercept for the purchaser’s decision threshold. For the general sample, a Part D plan must have a utility greater than -9.300 for the consumer to consider purchasing it.
The part worths are shown after they have been rescaled using the zero centered diffs method in Table 5. The part worths were scaled so that the total sum of the part worth between the least preferred and most preferred levels of each attribute across attributes is equal to the number of attributes times 100 as specified by the Sawtooth SMRT system. The values were obtained using Sawtooth Softwares CBC/HB analysis system which has an option for the
17
evaluation of covariates. After the hierarchial bayes analysis was performed for each of the covariates examined, the values were imported into SMRT for evaluation. Throughout the remainder of the results sections, part worth values will be presented using this method, as it facilitates easier interpretation of the results. In terms of premiums, the bootstrapping analysis conducted in CBC/HB demonstrated that blacks were significantly more sensitive to increases in premiums when compared to whites. Moreover, higher income seniors, defined as seniors reporting incomes of greater than $40,000 annually were significantly less sensitive to increases in premiums when compared to low and middle income seniors. Low income seniors had self reported incomes of less than $15,000 annually, while middle income seniors self reported incomes of between $15,000 through $40,000. This makes intuitive sense as high income
seniors have more disposable income. It is probable that these results are related, yet the analysis methods employed do not permit multivariate analysis to determine if these effects are
independent of each other and persist when adjusting for both race and income.
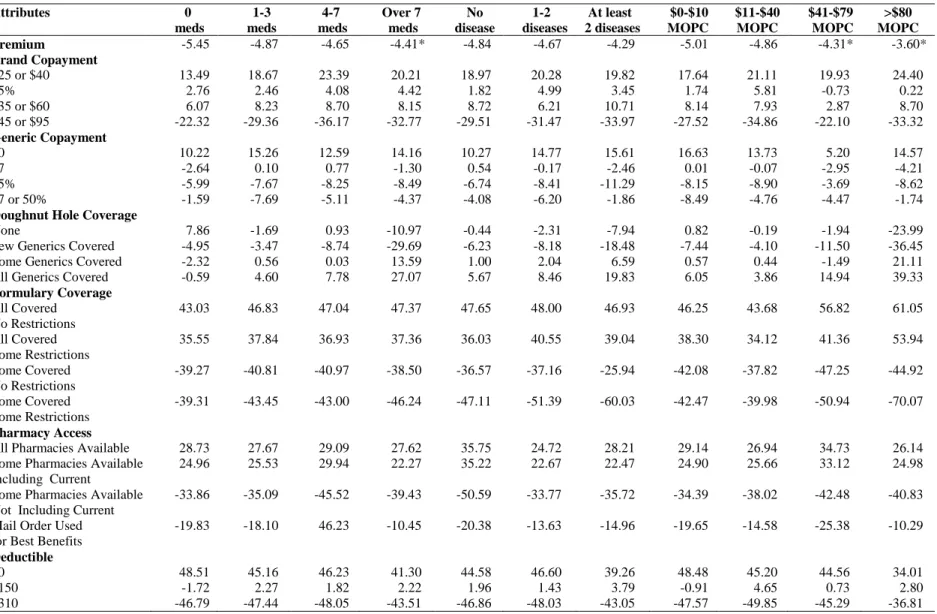
The part worth values are shown by selected medical expenditure and/or risk factors in Table 6. Seniors taking over 7 medications daily were less sensitive to increases in premiums when compared to seniors who reported taking no prescription medications. In addition seniors who reported spending at least $40 or more per month on their medications were less sensitive to premium increases when compared to seniors who spent no more than $10 on their medications monthly. These results are rational, as one would imagine that seniors in these predicaments would be willing to pay more to obtain insurance so that they receive protection from being solely responsible for their medication costs. However, the number of comorbidities had a relatively modest effect. This may be an indication that the number of comoribidities is not necessarily an indicator of the amount of medications one is taking. Another notable feature of this table is the higher emphasis placed on doughnut hole coverage by seniors taking over 7 medications and those spending more than $80 monthly on their medications.
The marginal willingness to pay values by demographic characteristics are depicted in Table 7. These results demonstrate that in general, seniors would have to be paid about $7 to accept a plan with $45 or $95 charged for brand medications in comparison to 25% costsharing. In contrast, seniors indicated that they would be willing to pay approximately $5 more in
premiums in order to have plans with free generics. Most seniors indicated that they would be willing to pay modest amounts for doughnut hole coverage. Even though high income seniors
18
indicated that they would be willing to pay $12 monthly for this coverage, this is still below the implicit price charged by Medicare Part D plans. The willingness to pay values show just how much seniors value having all of their medications covered. In general, seniors indicated that the premium for a plan would have to be at least $14 lower per month in order for them to accept a plan where only some of their drugs were covered. High income seniors indicated that they would be willing to pay more than $30 per month to have all of their medications covered, but this is probably a function of the greater amount of income they have to spend. The willingness to pay values also show how strongly seniors value using their pharmacy. In general, seniors showed that they would have to be paid at least $12 per month in order to accept plans which did not work at their current pharmacy. Most seniors demonstrated that they would pay
approximately $10 monthly in exchange for $150 in lower deductibles on an annual basis. The marginal willingness to pay values are shown by medical characteristics in Table 8. In general these results are similar to those shown in the demographic characteristics. However, there are some features of note. In particular, seniors spending over $80 monthly on their medications were willing to pay $20 on average for doughnut hole coverage, approximately equal to market value. This suggests that seniors who are at risk for doughnut hole coverage are willing to spend the extra money in premiums to purchase these plans. However, a
determination can not be made from this data if this group is primarily seniors who have already reached the doughnut hole previously, or those who perceive that they may be at risk for
reaching the doughnut hole in the future. If it is primarily the latter, then these results suggest that most seniors who have not reached the doughnut hole do not sense they need to purchase this coverage, or they may not even be aware of the provisions entailed by doughnut hole coverage. In addition, seniors spending at least $80 monthly on their medications indicated that they would be willing to spend nearly twice as much in order to have all of their medications compared to some other groups (those spending $11-$40 as an example). These seniors may have been exposed to brand name medications with particularly high prices.
The importance scores are shown for the total sample and by demographic characteristics in Table 9. The premium was by far the most important factor for these seniors when deciding on a plan, followed by the formulary, deductible, pharmacy access, brand copayments, and generic copayments. In general, the order of importance was constant across the demographic groups, however the magnitude of the values varied considerably in some groups. As an
19
example the importance score for premiums was 54% in low income seniors but only 37% in high income seniors. These results also show that seniors place greater importance on brand name medication copayments than copayments for generic medications. This makes intuitive sense because brand name medications are more likely to place one at extreme financial risk due to their higher prices.
The importance scores are shown by medical characteristics in Table 10. This table clearly shows that the premiums are more important relative to other attributes for those with low medication related expenditures such as those currently taking no medications and those who spend no more than $40 per month on medications. It is likely that these individuals will attempt to select plans with low premiums while paying relatively little attention to other attributes. Finally this table helps to demonstrate the increased emphasis that seniors with high medication expenses place on having doughnut hole coverage as well as good formulary coverage.
Part 9: Conclusions
This study sought to evaluate the preferences for Shelby County seniors in regards to Medicare Part D drug plans using the guidance of a conceptual framework developed from previous research regarding beneficiaries selection of health plans and prescription drug plans. The research indicated that several factors influence senior’s choice of prescription drug plans including drug benefit plan characteristics and delivery system characteristics. The most important factors for the aggregate sample in selecting drug plans in decreasing order were premiums, formulary coverage, deductible amount, and pharmacy access.
In terms of drug benefit plan characteristics, greater amounts of control mechanisms, higher premiums, and greater copayments were associated with lower utilities in a PDP, and hence a lower probability of a plan being selected. These findings are not surprising as previous research has demonstrated this relationship (Frakt and Pizer, 2010). In addition as expected, higher deductibles were found to be associated with lower utility. In general, doughnut hole coverage appeared to have a positive association with the probability of a plan being selected, but this was only true where plans had coverage for at least some generics within the doughnut hole.
This study also indicated that access to the pharmacy is an important component in the selection of prescription drug plans. While previous research on medication insurance had explored this issue, it had not been investigated within the context of Medicare Part D plans
20
(Cline and Mott, 2003). In most cases, there was not an appreciable difference between the part worth values for seniors being able to use all pharmacies with their prescription insurance or being able to use only some pharmacies as long as their current pharmacy was included in the insurance plan. However, the part worth values were much lower when seniors were presented with plans which did not allow them to use their insurance within their current pharmacy. Seniors also indicated that they preferred not to have to use mail order to get the best benefits from their prescription drug plan. The results gathered from this study indicated that the
eligibility requirements for MTM services are not an important component in seniors selection of prescription drug plans. This may indicate that many of these seniors are not aware of these services, and that greater efforts must be put in place in order to ensure that seniors are aware of these benefits.
This study also sought to analyze the impact of factors which are not characteristics of the drug plans themselves on the choice of prescription drug plans. Exploring the impact of economic characteristics in senior’s choice of prescription drug plans demonstrated the role that income plays when they decide on a plan. Out of all the sub groups analyzed within this study, seniors with high incomes demonstrated the smallest sensitivity to increases in premiums. The importance score for premiums for this group was nearly 30% lower than that seen in low income seniors. The results indicate that doughnut hole coverage is more important to seniors with higher incomes than lower income groups. While lower income seniors did not indicate that they would be willing to pay any additional money for doughnut hole coverage, and middle income seniors indicated that they would be willing to pay $5 more for full generic coverage in the doughnut hole, higher income seniors indicated that they would pay $12 for doughnut hole coverage. These findings help to explain some of the general ambiguity concerning the doughnut hole in this study, as it may only be important to certain groups such as high income seniors. Seniors with high incomes also indicated that formulary coverage was an important factor to them, and they would be willing to pay generous premiums in order to ensure that all of their medications were covered. Another finding of note is the particular affinity that low
income seniors have for choosing plans which allow them to use their current pharmacy. This may be due to many reasons, but it is possible that these seniors choose a pharmacy which is within close proximity to them so that they may access it even without some type of motor
21
vehicle transportation. Alternatively, the pharmacy may offer some type of delivery service that the senior citizen may value, but this is an area in which more research may prove helpful.
The magnitude of seniors out of pocket cost had a significant impact on how they go about choosing prescription drug plans. Seniors with medication costs of at least $41 monthly had lower premium sensitivity when compared to seniors who spent $10 or less per month on their medications. These groups also were relatively less sensitive to increases in the deductible amount when compared to seniors who spent $10 or less per month out of pocket on their medicines.
It is possible however, that seniors may initially have low medication related expenses at the time they choose to enroll in a plan and end up with some type of condition which subjects them to high medication costs. Therefore, it would be ideal if all seniors demonstrated some type of knowledge of doughnut hole coverage as these part worths are independent of higher premiums. However, this does point to the need for the doughnut hole to be subsidized as promulgated in the affordable care act as many seniors do not seem to be able to comprehend the need for doughnut hole coverage. And once again, the seniors with high medication costs are already under increased pressure due to their high medication expenses, so having to purchase insurance plans with higher premiums due to doughnut hole coverage only exacerbates their situation.
Within the risk factors, the current use of prescription medications were found to affect the choice of plan most. Specifically, seniors taking more than 7 medications had a part worth value for the premium that was of significantly lower magnitude than seniors taking no
medications. These results suggest that these seniors may be willing to pay higher premiums for plans which offer more generous coverage, a premise that is supported by their significantly higher part worths for plans offering full doughnut hole coverage and the greater importance they place on formulary coverage. However, these seniors probably have high medical expenses, so it is important to ensure that their costs as relates to medication do not become overwhelming. The number of current medications also seemed to have an effecot on the amount of doughnut hole coverage seniors are willing to accept.
Abaluck and Gruber (2009) indicated that seniors over value premiums in relation to other determinants of out of pocket costs, and in their statistical models, the coefficient on
22
premiums was five times larger than that found on out of pocket costs. In this study, the importance of the premium was five times larger than the combined importance scores of the copayments for generic and brand medications. They also indicated that seniors would have to be paid approximately $80 annually in order to go to plans with the lowest cost sharing in their study (25%) to plans with the highest cost sharing. In this study seniors would have to be paid $84 annually to go from a plan with 25% brand cost sharing to the attribute level with the highest level of cost sharing. However, this study shows how these figures may be slightly different depending on the group which is being studied. For example, for seniors with medications expenses over $80 monthly they would have to be paid $108, but seniors with high incomes would have to be paid as little as $36. Abaluck and Gruber also indicated that seniors would be willing to pay $50 annually for generic doughnut hole coverage while Heiss and colleagues (2007) found a value of $33, similar to the value of $36 found in this study for full doughnut hole coverage. However, the Heiss study alluded to the fact that this amount would be different between seniors with high and low costs as this study did. In addition, Heiss and associates found that beneficiaries would be willing to pay $14 monthly for no deductible plans during 2006 – 2007. This is smaller than the $18 amount in this study to go from full deductibles to no deductibles, yet the deductible amounts were smaller. In 2006, the deductible was $250.
This study has several limitations. The internal validity of this sample is limited because it is not a random sample. It is possible that there may be unobserved factors which may
introduce bias. Furthermore, the respondents are depended upon to provide answers to
questions about their past or current situation which has the possibility of bringing in recall bias. Also this study is limited in the external validity because the results will only be able to be extrapolated to the Shelby County Medicare population as this population is distinct in nature from even other areas of Tennessee. In addition, all of the information is derived from senior citizens who are relatively ambulatory and therefore may have differential preferences in comparison to the senior population at large.
There are several recommendations for research that come as a result of conducting this study. One suggestion is to use the results and part worths in order to determine if they are able to assist in developing models which may predict changes in market share as a result of changes made to the plan. Two factors which may be important in choice of PDPs which were not studied in this research are the plan’s quality ratings and the concept of “brand loyalty”: that is
23
whether seniors forgo the time and effort needed on an annual basis to evaluate their enrollment decision and just decide to remain with their current plan without exploring other options. These were not included due to the possibility of presenting the seniors with too much information at one time and they were not part of the conceptual models used in framing the survey. This would contribute to imperfect market conditions and diminish the efforts of competing plans to enhance their products by finding ways to offer lower cost and greater coverage. In addition, although this study explored many secondary characteristics, it did not study them all in a simultaneous manner. It would be prudent to utilize multivariate techniques which allow one to study the most important characteristics and evaluate whether their effects are independent of others.
24 References
Abaluck , Jason, and Jonathan Gruber. 2009. "Choice Inconsistencies Among the Elderly: Evidence from Plan Choice in the Medicare Part D Program." Working Paper 14759. Cambridge, MA: The National Bureau of Economic Research.
Adamcik, B. 1998. The Consumers of Health Care. 2nd ed. Binghampton, NY: Pharmaceutical Products Press.
Berki, S, and M Ashcraft. 1980. "HMO Enrollment: Who Joins What and Why: a Review of the Literature." The Milbank Memorial Fund Quarterly. Health and Society 58(4): 588-632. Centers for Medicare and Medicaid Services. 2005. Medicare Current Beneficiary Survey 2005
Health Status and Functioning Survey. Washington, DC. Available at:
Centers for Medicare and Medicaid Services. 2010. Medicare Plan Finder. Washington, DC. Available a
Cline, Richard, and David Mott. 2003. "Demand for a Medicare Prescription Drug Benefit: Exploring Consumer Preferences under a Managed Competition Framework." Inquiry 40(2): 169-83.
Families USA. 2000. Cost Overdose: Growth in Drug Spending for the Elderly 1992-2010. Washington, DC. Available at:
/assets/pdfs/drugod852b.pdf.
Fischbein, Martin, and Icek Ajzen. 1975. Belief, Attitude, Intention and Behavior . Reading, Mass.: Addison-Wesley.
Florian Heiss, Daniel McFadden, and Joachim Winter "Mind the Gap! Consumer Perceptions and Choices of Medicare Part D Prescription Drug Plans.” Working Paper W13627. Cambridge, MA: National Bureau of Economic Research.
Frakt, A, and S Pizer. 2010. "Beneficiary Price Sensitivity in the Medicare Prescription Drug Plan Market." Health Economics 19(1): 88-100.
Kaiser Family Foundation. 2010a. The Medicare Part D 2010 Data Spotlight Benefit Design and Cost Sharing. Menlo Park,CA. Available at: www.kff.org/medicare/upload/8033.pdf . Kaiser Family Foundation. 2010b. The Medicare Prescription Drug Benefit. Menlo Park, CA.
Available at: www.kff.org/medicare/upload/7044-11.
Orme, Bryan K. 2010. Getting started with conjoint analysis. 2nd ed. Madison, WI:. Sawtooth Software. 2010. Sawtooth Software Product Page. Sequim, WA. Available at:
25
Winston, Shelly, and Yu-Shen Lin. 2009. “Impact on Drug Cost and Use of Medicare Part of Medication Therapy Management Services Delivered in 2007.” Journal of the American Pharmacists Association 49(6): 813-820.
26 Appendix
Table 2: Demographics of Sample
Variables (N=497) Number % Gender Male 138 27.8 Female 359 72.2 Race White 144 29.0 Black 353 71.0 Education
Less than High School 144 29.0
High School Graduate 154 31.0
Some College 129 26.0 Bachelor’s or Higher 70 14.1 Income $0-$10,000 113 22.7 $10,001-$15,000 153 30.8 $15,001-$20,000 87 17.5 $20,001-$30,000 78 15.7 $30,001-$40,000 28 5.6 $40,001-$50,000 14 2.8 More than $50,000 24 4.8
How Prescription Drug Insurance Selected Primarily on Own 210 42.3 Family Members 50 10.1 Physician 11 2.2 Pharmacist 0 0 No Drug Plan 6 1.2 Other Source 219 44.1 Mean age (SD) = 73.93 (7.21)
27
Table 3: Part Worth Values with Breakpoints for Premium
Attributes Part Worth SE Lower
95% CI Upper 95% CI Premium $21 2.83 0.36 1.899 2.342 $30 1.99 0.25 0.305 0.750 $38 -0.84 0.25 0.628 1.103 $46 -3.40 0.24 -3.94 -3.073 $82 -29.49 0.65 Brand Copayment $25 or $40 1.76 0.04 1.899 2.342 25% 0.53 0.04 0.305 0.750 $35 or $60 0.75 0.04 0.628 1.103 $45 or $95 -3.04 0.08 -3.94 -3.073 Generic Copayment $0 1.26 0.04 1.311 1.785 $7 -0.11 0.02 -0.313 0.127 25% -0.73 0.03 -1.130 -0.625 $7 or 50% -0.41 0.02 -0.835 -0.401
Doughnut Hole Coverage
None -0.06 0.04 -2.343 -1.296
Few Generics Covered -0.35 0.07 -2.925 -1.285
Some Generics Covered 0.00 0.03 -0.354 0.184
All Generics Covered 0.41 0.06 3.397 5.020
Formulary Coverage
All Drugs Covered No Restrictions 3.73 0.09 4.465 5.391
All Drugs Covered Some Restrictions 3.09 0.09 3.661 4.568
Some Drugs Covered No Restrictions -3.06 0.09 -2.697 -1.600
Some Drugs Covered Some Restrictions -3.75 0.09 -7.637 -6.247
Pharmacy Access
All Pharmacies Available 2.33 0.06 2.625 3.385
Some Pharmacies Available Including Current
2.18 0.07 2.490 3.248
Some Pharmacies Available Not Including Current
-3.11 0.12 -4.597 -3.359
Mail Order Used for Best Benefits -1.39 0.08 -2.466 -1.465
Deductible
$0 3.69 0.10 4.724 5.646
$150 -0.02 0.03 -0.211 0.251
$310 -3.67 0.09 -5.681 -4.747
None -9.300 0.43 -10.747 -7.397
28
Table 4: Part Worth Values with Single Level for Premium
Attributes Part Worth SE Lower
95% CI
Upper 95% CI Premium (Per Dollar Increase at Average) -0.551 0.01 -0.600 -0.506
Brand Copayment $25 or $40 2.134 0.05 1.899 2.342 25% 0.522 0.05 0.305 0.750 $35 or $60 0.845 0.05 0.628 1.103 $45 or $95 -3.502 0.10 -3.94 -3.073 Generic Copayment $0 1.536 0.06 1.311 1.785 $7 -0.065 0.03 -0.313 0.127 25% -0.879 0.04 -1.130 -0.625 $7 or 50% -0.593 0.03 -0.835 -0.401
Doughnut Hole Coverage
None -1.914 0.04 -2.343 -1.296
Few Generics Covered -2.133 0.07 -2.925 -1.285
Some Generics Covered -0.104 0.06 -0.354 0.184
All Generics Covered 4.151 0.08 3.397 5.020
Formulary Coverage
All Drugs Covered No Restrictions 4.911 0.11 4.465 5.391
All Drugs Covered Some Restrictions 4.077 0.12 3.661 4.568
Some Drugs Covered No Restrictions -2.123 0.11 -2.697 -1.600
Some Drugs Covered Some Restrictions -6.864 0.11 -7.637 -6.247
Pharmacy Access
All Pharmacies Available 3.071 0.08 2.625 3.385
Some Pharmacies Available Including Current
2.885 0.09 2.490 3.248
Some Pharmacies Available Not Including Current
-3.986 0.14 -4.597 -3.359
Mail Order Used for Best Benefits -1.970 0.11 -2.466 -1.465
Deductible
$0 5.163 0.14 4.724 5.646
$150 0.016 0.05 -0.211 0.251
$310 -5.178 0.12 -5.681 -4.747
MTM Eligibility
2 Diseases and 3 Drugs Required -0.090 0.03 -0.268 0.081
2 Diseases and 6 Drugs Required -0.022 0.02 -0.167 0.150
3 Diseases and 6 Drugs Required 0.105 0.03 -0.069 0.259
4 Diseases and 9 Drugs Required 0.007 0.02 -0.160 0.171
None -9.300 0.43 -10.747 -7.397
29
Table 5: Part worth values by selected demographic characteristics after rescaling Attributes Part Worth 65-75 Over 75 Males Females Blacks Whites Low
Income Middle Income High Income Premium -4.71 -4.64 -4.83 -4.80 -4.67 -4.93 -4.19* -5.11* -4.35* -3.34 Brand Copayment $25 or $40 20.09 21.83 17.96 18.13 20.58 18.84 23.06 19.86 19.27 31.93 25% 3.33 3.73 3.42 2.34 4.27 5.22 -1.55 6.97 0.18 -10.46 $35 or $60 7.81 8.95 6.40 7.58 7.74 8.12 5.90 8.13 10.84 -0.38 $45 or $95 -31.23 -34.51 -27.78 -28.05 -32.59 -32.17 -27.40 -34.97 -30.29 -21.10 Generic Copayment $0 14.16 15.52 10.66 11.52 14.07 14.34 11.71 14.38 11.87 15.11 $7 -0.11 -0.56 0.36 2.36 -0.71 -0.31 0.54 -2.44 1.25 10.62 25% -8.57 -9.34 -6.58 -8.73 -7.81 -9.38 -6.78 -7.38 -9.12 -9.22 $7 or 50% -5.49 -5.62 -4.43 -5.15 -5.55 -4.65 -5.48 -4.56 -4.00 -16.51
Doughnut Hole Coverage
None -2.81 -4.70 -2.96 -4.50 -2.69 -0.93 -8.69 1.57 -7.11 -12.72
Few Generics Covered -10.11 -10.16 -8.99 -13.14 -8.10 -6.30 -20.38 -4.45 -15.74 -20.04
Some Generics Covered -2.21 2.45 3.70 2.88 1.57 0.90 8.21 -0.90 6.84 4.00
All Generics Covered 10.70 12.41 8.25 14.76 9.22 6.33 20.87 3.78 16.01 28.77
Formulary Coverage
All Covered No Restrictions 46.95 49.02 42.83 48.37 47.40 43.60 55.64 42.02 48.74 68.29
All Covered Some Restrictions 38.09 39.91 35.70 35.58 40.32 36.30 53.43 36.07 38.63 55.46
Some s Covered No Restrictions -38.52 -43.24 -35.01 -36.54 -38.99 -37.71 -40.89 -37.22 -39.58 -49.95
Some Covered Some Restrictions -46.52 -45.39 -43.52 -47.42 -48.73 -42.18 -58.18 -40.87 -47.79 -73.80
Pharmacy Access
All Pharmacies Available 28.90 27.73 28.71 25.19 29.32 27.06 30.81 26.93 31.16 22.33
Some Pharmacies Available Including Current
26.83 27.14 25.40 21.15 27.31 25.37 27.73 25.84 29.29 15.05
Some Pharmacies Available Not Including Current
-38.08 -38.29 -33.96 -33.99 -38.96 -35.20 -43.20 -33.70 -44.99 -32.92
Mail Order Used for Best Benefits -17.65 -16.59 -20.15 -12.35 -17.66 -17.23 -15.34 -19.07 -15.45 -4.46
Deductible
$0 45.52 46.25 44.16 40.33 47.17 46.65 42.40 48.35 41.93 40.31
$150 0.70 3.21 0.83 5.72 -0.47 1.38 2.08 -1.85 4.46 6.04
$310 -46.22 -49.47 -44.98 -46.06 -46.70 -48.02 -44.48 -46.50 46.39 -46.35
Notes: * indicates significant differences in premiums at P=0.05 level following bootstrapping analysis. Blacks were compared with whites and low and middle income groups were compared with the high income group.
30
Table 6: Part worth values by selected medical characteristics after rescaling
Attributes 0 meds 1-3 meds 4-7 meds Over 7 meds No disease 1-2 diseases At least 2 diseases $0-$10 MOPC $11-$40 MOPC $41-$79 MOPC >$80 MOPC Premium -5.45 -4.87 -4.65 -4.41* -4.84 -4.67 -4.29 -5.01 -4.86 -4.31* -3.60* Brand Copayment $25 or $40 13.49 18.67 23.39 20.21 18.97 20.28 19.82 17.64 21.11 19.93 24.40 25% 2.76 2.46 4.08 4.42 1.82 4.99 3.45 1.74 5.81 -0.73 0.22 $35 or $60 6.07 8.23 8.70 8.15 8.72 6.21 10.71 8.14 7.93 2.87 8.70 $45 or $95 -22.32 -29.36 -36.17 -32.77 -29.51 -31.47 -33.97 -27.52 -34.86 -22.10 -33.32 Generic Copayment $0 10.22 15.26 12.59 14.16 10.27 14.77 15.61 16.63 13.73 5.20 14.57 $7 -2.64 0.10 0.77 -1.30 0.54 -0.17 -2.46 0.01 -0.07 -2.95 -4.21 25% -5.99 -7.67 -8.25 -8.49 -6.74 -8.41 -11.29 -8.15 -8.90 -3.69 -8.62 $7 or 50% -1.59 -7.69 -5.11 -4.37 -4.08 -6.20 -1.86 -8.49 -4.76 -4.47 -1.74
Doughnut Hole Coverage
None 7.86 -1.69 0.93 -10.97 -0.44 -2.31 -7.94 0.82 -0.19 -1.94 -23.99
Few Generics Covered -4.95 -3.47 -8.74 -29.69 -6.23 -8.18 -18.48 -7.44 -4.10 -11.50 -36.45
Some Generics Covered -2.32 0.56 0.03 13.59 1.00 2.04 6.59 0.57 0.44 -1.49 21.11
All Generics Covered -0.59 4.60 7.78 27.07 5.67 8.46 19.83 6.05 3.86 14.94 39.33
Formulary Coverage All Covered No Restrictions 43.03 46.83 47.04 47.37 47.65 48.00 46.93 46.25 43.68 56.82 61.05 All Covered Some Restrictions 35.55 37.84 36.93 37.36 36.03 40.55 39.04 38.30 34.12 41.36 53.94 Some Covered No Restrictions -39.27 -40.81 -40.97 -38.50 -36.57 -37.16 -25.94 -42.08 -37.82 -47.25 -44.92 Some Covered Some Restrictions -39.31 -43.45 -43.00 -46.24 -47.11 -51.39 -60.03 -42.47 -39.98 -50.94 -70.07 Pharmacy Access
All Pharmacies Available 28.73 27.67 29.09 27.62 35.75 24.72 28.21 29.14 26.94 34.73 26.14
Some Pharmacies Available Including Current
24.96 25.53 29.94 22.27 35.22 22.67 22.47 24.90 25.66 33.12 24.98
Some Pharmacies Available Not Including Current
-33.86 -35.09 -45.52 -39.43 -50.59 -33.77 -35.72 -34.39 -38.02 -42.48 -40.83
Mail Order Used for Best Benefits
-19.83 -18.10 46.23 -10.45 -20.38 -13.63 -14.96 -19.65 -14.58 -25.38 -10.29
Deductible
$0 48.51 45.16 46.23 41.30 44.58 46.60 39.26 48.48 45.20 44.56 34.01
$150 -1.72 2.27 1.82 2.22 1.96 1.43 3.79 -0.91 4.65 0.73 2.80
$310 -46.79 -47.44 -48.05 -43.51 -46.86 -48.03 -43.05 -47.57 -49.85 -45.29 -36.81
Notes: * indicates significant differences in premiums at P=0.05 level following bootstrapping analysis. Over 7 meds was compared to the group taking no medications. MOPC indicates monthly out of pocket cost for prescription medications. The reference group was the group with monthly medication costs no higher than $10 per month.
31
Table 7: Marginal willingness to pay by selected demographic characteristics
Attributes Total Age
65-75
Age Over 75
Males Females Blacks Whites Low
Income Middle Income High Income Premium -4.71 -4.64 -4.83 -4.80 -4.67 -4.93 -4.19 -5.11 -4.35 -3.34 Brand Copayment $25 or $40 $4 $4 $3 $3 $3 $3 $6 $3 $4 $13
25% Reference Reference Reference Reference Reference Reference Reference Reference Reference Reference
$35 or $60 $1 $1 $1 $1 $1 -$1 $2 $0 $3 $3
$45 or $95 -$7 -$8 -$6 -$6 -$8 -$8 -$6 -$8 -$7 -$3
Generic Copayment
$0 $5 $5 $4 $4 $5 $4 $4 $4 $5 $7
$7 $2 $1 $1 $2 $2 $1 $2 $1 $2 $6
25% Reference Reference Reference Reference Reference Reference Reference Reference Reference Reference
$7 or 50% $1 $1 $0 $1 $0 $1 $0 $1 $1 -$2
Doughnut Hole Coverage
None Reference Reference Reference Reference Reference Reference Reference Reference Reference Reference
Some Generics Covered $0 $2 $1 $2 $1 $0 $4 $0 $3 $5
All Generics Covered $3 $4 $2 $3 $3 $1 $7 $0 $5 $12
Formulary Coverage
All Covered No Restrictions $2 $2 $1 $3 $2 $1 $1 $1 $2 $4
All Covered Some Restrictions Reference Reference Reference Reference Reference Reference Reference Reference Reference Reference
Some Covered No Restrictions -$16 -$18 -$15 -$15 -$17 -$15 -$23 -$14 -$18 -$32
Some Covered Some Restrictions -$18 -$18 -$16 -$17 -$19 -$16 -$27 -$15 -$20 -$38
Pharmacy Access
All Pharmacies Available $0 $0 $1 $1 $0 $0 $1 $0 $0 $2
Some Pharmacies Available Including Current
Reference Reference Reference Reference Reference Reference Reference Reference Reference Reference
Some Pharmacies Available Not Including Current
-$14 -$14 -$12 -$12 -$14 -$12 -$17 -$17 -$17 -$14
Mail Order Used for Best Benefits -$9 -$9 -$9 -$7 -$10 -$9 -$9 -$12 -$10 -$6
Deductible
$0 $10 $9 $9 $7 $10 $9 $9 $10 $9 $10
$150 Reference Reference Reference Reference Reference Reference Reference Reference Reference Reference