International Journal On Engineering Technology and Sciences – IJETS™
ISSN(P): 2349-3968, ISSN (O): 2349-3976 Volume III, Issue XII, December- 2016
24
SEGMENTATION OF HIGHER SPATIAL RESOLUTION REMOTE SENSING
DATA
1N.Muthusamy, 2Dr.M.Ramalingam,
1
Research Scholar, 2Principal,
1
Institute of Remote sensing,2Jerusalem College of Engineering,
1
College of Engineering, 1,2Anna University, Chennai – 25.
1
[email protected], 2Email-ram_irs @annauniv.edu
ABSTRACT
In an exponentially growing and alerting mega city, a lack of up-to-date information is obvious. Therefore an up-to-date area-wise information management in highly dynamic urban settings is a critical endeavor for their future development. The accomplishment for this task requires adequate spatial database which can be obtained through remote sensing data. Realizing the present need the objective of the paper deals with the development of fuzzy approach for the segmentation of image object on the high resolution remote sensing data, which is the base for the classification and the development of the spatial database. The Panchromatic (PAN) and Multi Spectral Sensor (MSS) merged product of QUICKBIRD and Digital Surface Model (DSM) of aerial photograph of the same area is used for this task and the region growing algorithm is used for the segmentation. The segmentation process is controlled by the five segmentation parameter such as scale, color, shape, compactness and smoothness. If the smallest growth exceeds the threshold defined by the segmentation parameter the process stops and the fuzzy membership function was defined for those parameters. This eliminates the human intervention in fixing the parameters.
1.0.INTRODUCTION
In an exponentially growing and altering mega cities, lack of an up-to-date spatial data base is obvious. Therefore an updated and area-wise information management in highly dynamic urban settings is a critical endeavor for their future development. For this task requires adequate spatial databases which can be obtained through remote sensing data. The advancement of the sensor design in the remote sensing technology provides high resolution remote sensing data and captures detailed urban features in terms of spatially, spectrally, radiometrically and temporally.
The IKONOS and QUICKBIRD are spaceborn sensor offers a higher spatial resolution of 1m and 0.60m of Panchromatic (PAN), 4m and 2.6m of Multi Spectral Sensor (MSS) images. Buildings can be detected at a spatial resolution of 0.25m to maximum of 5m (Jensen and Cowen, 1999). For this purpose remote sensing offers the possibility of a fast and area-wise assessment of urban changes and developments (Taubenbock, 2006).
Conventional methods of pixel-based
classification such as parallelepiped, minimum
distance from means, and maximum likelihood only utilize the spectral information and it has limited use of spatial information. An object-oriented approach with shape parameters and neighborhood relations provides additional analysis potential from remote sensing apart from spectral information (eCognition, 2002). In the object oriented classification, object segmentation is a crucial process and it significantly influences the classification results. (Baatz and Schape, 2000).
A variety of segmentation technique have been applied to remote sensing imagery with varying degree of success. Segmentation of remotely sensed images pose difficult problem due to mixed pixels, spectral similarity and textured appearance of many land cover type. The authors suggest that region growing algorithm is well suited for the urban needs. (Baatz ,1999)
Neubert (2004) compared different
segmentation methods such as region growing, watershed segmentation, triangulation and simulated annealing and the region growing algorithm suits for producing good quality output and hence the region growing method is adopted in this study.
Al-Khudhairy (2005) compares mathematical
International Journal On Engineering Technology and Sciences – IJETS™
ISSN(P): 2349-3968, ISSN (O): 2349-3976 Volume III, Issue XII, December- 2016
25 methods of segmentation. From the output result, it concludes that the ecognition method works well for the urban feature extraction and the previous method has less scope on this.
Vidya (2002) classified the urban features using the object oriented approach on the IKONOS data. The study resulted that the accuracy of the object oriented approach is 13% higher than the conventional pixel based approach of Maximum likelihood method. For selecting the data set, for the segmentation, study concludes that the elevation data is one of the important data, which is used for classifying the buildings and to differentiate with the roads etc.
2.0OBJETIVES
The following are the objectives of the study
1. Creation of merged data product for PAN
and MSS of QUICKBIRD satellite data and to create Digital Elevation Model of the same area using aerial photographs.
2. Creation of an object by performing
segmentation and fuzzyfying its process for an automation
3.0STUDY AREA
The part of an institutional area of Anna University, Guindy campus which is having about 50 hectare has been considered for the study and represented in fig1.0. . The area contains predominately buildings, vegetation cover includes garden, meadows, roads, pathways playgrounds and parking areas. The elevation difference between the ground level and building tops provides ample opportunities for the delineation of feature with the digital elevation model. Not only features like building, roads, vegetation and openspaces are differentiated by trivial spectral differences but it can also be delineated with the help of elevation data.
Fig1.0. Study Area – Part of Anna University Guindy campus.
4.0.METHODLOGY
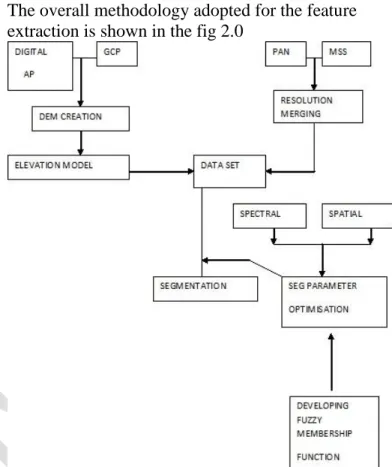
The overall methodology adopted for the feature extraction is shown in the fig 2.0
4.1 Data set
The dataset includes higher resolution of remote sensing data from the PAN and MSS of Quickbird and the elevation data generated from aerial photographs.
4.1.1. Higher Resolution Remote Sensing data
The higher resolution remote sensing data, (ie) QUICKBIRD satellite data, which is having a spatial resolution of 0.60m of PAN and 2.4 m of MSS has been used in this study. The products were merged using Principle Component Analysis (PCA) method, to produce the new image with the spatial resolution of the PAN and spectral resolution of the Multi Spectral Sensor. While guaranteeing that each band, it is sharpened, maintains its original bit range, number of bands as well as spectral values.
4.1.2. Creation of Digital Elevation Model
Digital Elevation Model (DEM) of the study area was created using the aerial photographs by collecting the Ground Control Points (GCP) using Global Positioning System (GPS). The interior
International Journal On Engineering Technology and Sciences – IJETS™
ISSN(P): 2349-3968, ISSN (O): 2349-3976 Volume III, Issue XII, December- 2016
26 orientation, exterior orientation and absolute orientation were carried out using soft copy digital photogrammetry tool of Socket Set and the automatic generation of Digital Elevation Model (DEM) was created with the 0.36m grid cell resolution and 0.2m of vertical accuracy. Through the interactive editing, the trees and other features were extracted and then the DEM was converted in to TIN and exported into the TIFF format, which is the collateral data for the imagery and presented in fig3.
4.2Object Oriented Image Analysis
The image segmentation and classification are the major tasks in object oriented image analysis. The following step describes the process of image segmentation.
4.2.1. Image segmentation
It is a bottom up region merging technique, starting with one pixel of an object and in subsequent steps the smaller objects are merged in to larger ones (more pixels). The growing decision is based on the local homogeneity criteria describing the similarity of adjacent image objects in terms of size, distance, texture, spectral similarity and form (Baatz and schape, 2000) (Schieve J, 2002)
.
4.2.2. Creation of an Object
In subsequent steps, smaller image objects are merged into bigger ones. Throughout this pair wise clustering process, the underlying optimization procedure minimizes the weighted heterogeneity of n*h of resulting image objects, where n is the size of a segment and h is a parameter of heterogeneity. In each step, that pair of adjacent image objects are merged which results in the smallest growth of the
defined heterogeneity. If the smallest growth exceeds the threshold defined by the scale parameter, the process stops. The above steps are followed to optimize the segmentation parameters.
4.2.3 Segmentation Parameters used
There are five parameters which are having functions for defining the heterogeneity while doing the segmentation in the object oriented image processing are Scale, Color, Shape, Compactness and Smoothness (Baatz and Scha¨pe, 1999). A brief description of each parameter is given below.
4.3. Algorithms for defining the Segmentation parameters
4.3.1. Definition of heterogeneity.
Heterogeneity in eCognition considers the primary object features such as color and shape. The increase of heterogeneity ‘f’ has to be less than a certain threshold.
f = W
color.Δh
color +W
shape. Δh
shapeW
color
[0,1],
W
shape
[0,1]
W
color+ W
shape= 1
Where
w
color - Weightage for color factorw
shape - Weightage for shape factorΔhcolor – Color heterogeneity
Δhshape – Shape heterogeneity
The weight parameters (wcolor, wshape) allow adopting
the heterogeneity definition to the application. The
spectral heterogeneity allows multi-variant
segmentation by adding a weight wc to the image
channels c. Difference in spectral heterogeneity Δhcolor is defined as following:
Δh
color=
c
W
c(
merge.
c merge.– (
obj_1.
cobj_1
+
obj_2
cobj_2))
Where
merge number of pixels withinmerged object
obj_1 number of pixels in object 1
obj_2 number of pixels in object 227
c
standard deviation within theobject of channel
Subscripts merge refer to the merged object, object 1 and object 2 are prior to merge, respectively. The
shape heterogeneity Δhshape is a value that describes
the improvement of the shape with regard to smoothness and compactness of an object’s shape.
Δh
shape= w
compt .Δh
compt +w
smooth .Δh
smoothWhere
lmerge -Length of merging distance
bmerge - Perimeter of object’s bounding box.
The scale parameter is the stop criterion for optimization process. Prior to the fusion of two
adjacent objects, the resulting increase of
heterogeneity ‘f’ is calculated. The scale parameter determines the threshold‘t’ and it checks the result, if t =W (scale parameter), then no further fusion takes place and the segmentation stops and the segmented image is shown in fig4. This produces extensive semantic information for an object interms of spectral, shape and neighborhood which is presented in fig 5. The larger the scale parameter, the more objects will be fused and the larger the objects grow.
4.3 Segmentation Parameter - Fuzzy Approach
Fuzzy logic is used to deal with vague and imprecise input in a manner similar to human decision making
(Kaehler, 1998). The imprecise nature of
segmentation and selection of its associated parameters makes fuzzy logic well suited to the task of segmentation parameter determination.
The characteristic function of a crisp set assign a value of either 1 or 0 to each individual in the universal set. There by discriminating between member and non members of the crisp set under consideration. The value assigned to each element of the universal set, fall with in the range called membership function and its set is fuzzy set (Yuvan.B, 2004).
The following fuzzy membership function used to select the scale parameter for the building feature and the corresponding function slope (fig 6) are shown below.
Fuzzy Membership Function
fsp =
0 10 80 1
x
10
10 90
90 x
x
x
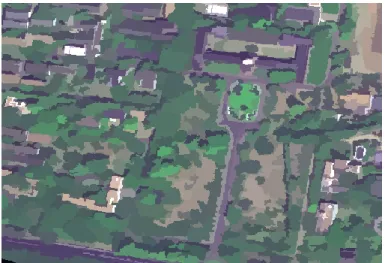
Fig. 4. Multi resolution segmentation and object recognition
International Journal On Engineering Technology and Sciences – IJETS™
ISSN(P): 2349-3968, ISSN (O): 2349-3976 Volume III, Issue XII, December- 2016
28
0 0.2 0.4 0.6 0.8 1 1.2
10 20 30 40 50 60 70 80 90
F
u
z
z
y
M
em
b
er
sh
ip
V
al
u
e
Scale Parameter Fuzzy Membership Slope
Series1
Fig.6. Fuzzy membership segmentation slope for scale parameter.
From these membership function and function slope, the initial and intermediate segmentation parameters are observed. For example, the scale parameter for the building feature, the initial segmentation will start with the value from 10. Lesser than that indicates the membership function as zero, which is very micro level segmentation, not needed for the extraction of the building feature, and it reaches the value of 1 at the scale parameter of 90. Two or three intermediate segmentations are required to get a good quality segmentation for final or optimal segmentation. The table1 indicates the scale parameters for different segmentation levels.
Table 1.0 Scale Parameter value Segmentation
level
Scale parameter
Level 1 10
Level 2 30
Level 3 60
Level 4 90
The membership function for the building features of the color factor of the level 1 is given below.
fcolor for level 1 =
0
1.0
0.4
0.5
0.3
0.2
0.1
1
x
x
x
1.0
1.0
0.5
0.5
0.2
0.2
0.1
0.1
x
x
x
x
x
From the membership function (MF) and function slope the optimized segmented color parameter for each level of segmentation can be observed. For example in the level 1 the color parameter for the building features starts from the value of 1 to zero. The value greater than one will have the color MF value of 0, and value less than 0.1 will have the MF of 1. Similarly for the different level, the corresponding MF can be derived.
The table2 indicates the color parameter for the level 1 of the segmentation parameter.
Table 2.0 Color parameter value
Level Color
value
Shape value
1 1 0
0.8 0.2
0.5 0.5
0.2 0.8
0 1
The membership function for the shape parameter is the inverse of the color parameter.
29 fsmoothness for level 1 =
0
0.7
0.2
0.5
0.2
0.2
0.3
1
x
x
x
0.9
0.9
0.7
0.7
0.5
0.5
0.2
0.2
x
x
x
x
x
Table 3.0 Smoothness parameter value
Level Smoothness
value
Compactness value
1 0.9 0.1
0.7 0.3
0.5 0.5
0.2 0.8
The membership function for the compactness parameter is the inverse of the smoothness parameter.
5. RESULTS AND DISCUSSION
The results obtained from the image segmentation is broadly discussed below.
5.1. Image Segmentation
The multi resolution segmentation in object oriented approach played a key role in merging different spatial resolution data of 0.61m PAN sharpened merged image and 0.26m of Digital Elevation Model , inturns it produces object. It is used for the
creation of object information for image
classification. For example the elevation information obtained from the segmented object is one of the main criteria to classify the building object. The comparison of two object oriented methods such as mathematical morphology and region merge algorithm, the study proves that region merging is
more suited for the urban feature classification comparing the other one. (Al khudairy, et al, 2003)
The developed fuzzy membership function for segmentation is readily available to fix the scale
parameter, color, shape, smoothness and
compactness. For example the membership value for 0.7 (Level3) corresponding the scale parameter of 60, was derived from the fuzzy membership slope. Similarly other values such as color, shape, smoothness and compactness values such as 0.4, 0.6, 0.5 and 0.5 respectively were obtained from the corresponding membership slope. This standardized membership function was used to find the parameter at different levels, where the vagueness in fixing the segmentation parameter by traditional method (ie) trail and error method is eliminated due to the fuzzification.
6. CONCLUSION AND RECOMMENDATION
The optimization of segmentation parameters using fuzzy approach gives an automated value for the process. It eliminates human intervention and vagueness in fixing the parameters. Image segmentation plays a key role in object extraction in higher spatial resolution imagery. This produces extensive semantic information for an object interms of spectral, shape and neighborhood. The elevation information derived from Digital Elevation Model is highly used for classifying the building feature by differentiating the road feature. The fuzzy rule base was extensively used to describe an object, which enhances the accuracy in classification. Further it can be improved by identifying more significant parameters to describe the object and can be implemented through fuzzy rule.
7.0. REFERENCES
1. Anonymous, 2002, eCognition userguide,
Definiens Imaging GmbH, Munich.
2. Al khudairy,D.H.A., I.Carvaggi, and
S.Giada, 2005, Structural Damage
Assessment from Ikonos data using Change detection, Object-Oriented Segmentation,
International Journal On Engineering Technology and Sciences – IJETS™
ISSN(P): 2349-3968, ISSN (O): 2349-3976 Volume III, Issue XII, December- 2016
30 Photogrammetry Engineering and Remote Sensing, 71(7), 825-837.
3. Baatz, M. and A.Schape 2000,
Multi-resolution segmentation: an optimization approach for high quality multi-scale image segmentation. AGIT 2000. In: Strobl, J.,
Blaschke, T., Griesebner, G. (Eds.),
Proceedings of the Angewandte
Geographische Informationsverarbeitung XII Beitrage Zum AGIT-Symposium Salzburg 2000, 12-23.
4. Benz, U.C., P.Hofmann, G.Willhauck,
I.Lingenfelder, and M.Heynen, 2004,
Multiresolution Object-oriented Fuzzy
Analysis of Remote Sensing Data for GIS-ready Information. ISPRS Journal of Photogrammetry and Remote Sensing. 58, 239-258.
5. Davis.C.H., and X.Wang, 2002. Urban
landcover classification from high resolution multi spectral IKONOS imagery, Proc, IGARSS, 2, Toronto, ON, Canada, June 24-28, pp 1204-1206.
6. Hoffman.P, 2001, Detecting urban features
from IKONOS data using an object-oriented approach, RSPS 2001 Proceedings, 79- 91.
7. Hofmann P, 2001, Detecting Informal
Settlements from IKONOS Image Data Using methods of Object Oriented Image Analysis – An Example from Cape Town, South Africa. In: Jürgens, C. (ed.), Remote Sensing of Urban Areas, Regensburger
Geographische Schriften, Heft 35,
Regensburg, 107-118.
8. Jensen, J.R., D.C.Cowen, 1999, Remote
sensing of urban/sub-urban infrastructure and socio-economic attributes. Photogram. Eng. Remote Sens. 65 (5), 611–622.
9. Neubert.M. Meinel, 2004, A comparison of
segmentation programs for high resolution
remote sensing data, ISPRS 2004
Photogrammetry and Remote Sensing.
http://www.cartesia.org/articulo208.html (accessed 10th Jan 2006)
10.Shackelford.A.K. and C.H.Davis, 2003, A
Combined fuzzy pixel-Based and Object-Based approach for classification of High-Resolution Multispectral Data over Urban Areas, IEEE Transaction on Geoscience and Remote Sensing, 141(10), 2354 - 2363.
11.Taubenbock.H, T.Esch and A.Roth, 2006,
An urban classification approach based on an object oriented analysis of high resolution satellite imagery for a spatial structuring within urban areas. 1st EARSeL Workshop of the SIG Urban Remote Sensing. Humboldt-Universität zu Berlin.
12.Vidya.R, 2002, Object Based Image
Analysis for Remote Sensing data,
Unpublished PhD. Dissertation, Anna
University, Chennai.
13.Yuvan.B., J.George, 2004, Fussy sets and
Fussy logic - theory and applications, Prentice-Hall of India Private Limited, New Delhi. 1-33.
14.Zhang, Y.J. 1997, Evaluation and
Comparison of Different Segmentation Algorithms. Pattern Recognition Letters. 18, 963-974.
15.Zhang,Y. and T.Maxwell, 2006, A Fuzzy