Brain CT-Scan Images Classification Using PCA,
Wavelet Transform and K-NN
Kamaljeet Kaur, Daljit Singh
109
All Rights Reserved © 2012 IJARCSEE
Abstract: With rapid development of technology in biomedical image processing, classification of tissues of human body is very challenging task as it requires very accurate results without any misclassification. By making use of this technology along with neural network; a hybrid technique has been proposed for classification of Brain CT-Scan images. This technique is not limited to medical field; it is also applicable to classification of natural images. Database consists of CT-Scan images and Brodatz texture. The methodology adopted in this paper consists of two stages: firstly, features are extracted from given images using feature extraction algorithms PCA and Wavelet Transform. They are further fed as an input to train the K-NN classifier to classify between normal and abnormal images. For Brain CT-Scan images; features extracted by PCA gives 100% classification accuracy with execution time of 0.6133 seconds whereas for Brodatz texture images; features by Wavelet transform gives classification accuracy of 100% with execution time of 0.1912 seconds. Code is developed by using MATLAB 2011a.
Index Terms: CT-Scan, PCA, GLCM, K-NN, feature extraction
I. INTRODUCTION
Computed tomography (CT-Scan) is a medical imaging procedure which utilizes computer-processed X-rays to produce tomographic images or 'slices' of specific areas of the body including soft-tissues. These three-dimensional images of interior body tissue are used for diagnostic and therapeutic purposes in various medical disciplines. Digital geometry processing is used to generate a three-dimensional image of the inside of an object from a large series of two-dimensional X-ray images taken around a single axis of rotation.
Kamaljeet Kaur, Electronics and Communication Engineering, Ludhiana College of Engineering and Technology, Ludhiana, India.
Daljit Singh, Electronics and Communication Engineering, Ludhiana College of Engineering and Technology, Malerkotla , India, 9465378987.
It is primarily used to detect and locate structures inside the body that cannot be located by other forms of radiological investigation. CT-Scan produce images of tissues, shows the exact location of structures within soft tissues. It is useful to detect bleeding within skull or tumors.
Traditional X-rays suffer from their inability to give any perception of depth to the physician. CT-Scan is better than traditional X-rays in three different ways:
- CT-Scan uses a very narrow beam of X-rays that can penetrate straight through the body in a straight line to the detector.
- Ray source is rotated around the body so that the X-rays pass through the entire structure in both directions. - A computer is used to reconstruct the intensity of
X-rays into an image showing the density of any point of the plane through which X-rays passed.
II. METHODOLOGY
Several feature extraction algorithms are in use. In this paper, authors have used only Principal Component Analysis (PCA) and Wavelet Transform algorithms for feature extraction from images. These extracted features are used as input to train the K-Nearest Neighbor (KNN) classifier which give results as normal and abnormal images.
III. DATABASE
110
All Rights Reserved © 2012 IJARCSEE Figure 1: Normal Brain CT-Scan image
Figure 2: Abnormal Brain CT-Scan image
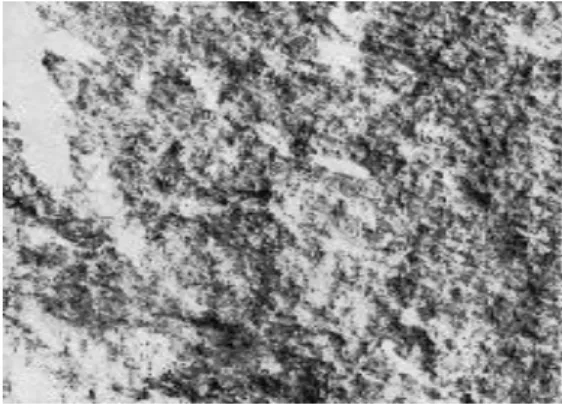
Figure 3: Brodatz texture image
Figure 4: Brodatz texture image
IV. FEATURE EXTRACTION
Feature extraction involves simplifying the amount of resources required to describe a large set of data accurately. When performing analysis of complex data one of the major problems stems from the number of variables involved [3]. Analysis with a large number of variables generally requires a large amount of memory and computation power or a classification algorithm which over fits the training. Feature extraction is a general term which depicts to extract only valuable information from given raw data. The main objective of feature extraction is to represent raw image in its reduced form and also to reduce the original dataset by measuring certain properties to make decision process easier during classification.
A. Principal Component Analysis (PCA)
PCA is a transformation that converts the set of correlated variables into set of uncorrelated variables. The goal of PCA is to reduce the dimensions of data by making it computationally feasible, while retaining as much as possible of variation present in original dataset. It is used for first order feature extraction. Features extracted using PCA are: Mean, Variance and Standard-Deviation
Following steps are to be followed while using PCA:
Step 1: Get two-dimensional data-set to understand the concept of PCA.
Arrange the data as a set of N data vectors X1…….XN with each XN representing a single grouped observation of the M variables.
111
All Rights Reserved © 2012 IJARCSEE
-
Place the column vectors into a single matrix X of dimensions M x N.Step 2: Calculate the Mean
For PCA to work properly on data; subtract the mean from each of the data dimensions. Subtracted mean is the average across each dimension.
-
Calculate the mean along each dimension m= 1… M.-
Store the calculated mean values into vector „u‟ ofdimensions Mx1.
𝑢 𝑚 =1
𝑁 𝑋(𝑚, 𝑛)
𝑁
𝑛=1
Step 3: Calculate Zero Mean data
-
Subtract the empirical mean vector „u‟ from each column of the data matrix X.-
Store zero mean data in the M × N matrix B.B = 𝑋 − 𝑢ℎ
Step 4: Calculate the Covariance Matrix „C‟.
-
Find the Covariance Matrix C from matrix B with itself.As given data is two-dimensional thus covariance matrix is also two-dimensional. If the non-diagonal elements of co-variance matrix are positive, both variables increase together. If the non-diagonal components are zero; then variable are independent of each other and are uncorrelated.
Step 5: Find Eigenvectors and Eigenvalues of Covariance Matrix C which is a square matrix.
-
Compute the matrix V of Eigen vectors which diagonalizes the covariance matrix C.Eigenvectors provide the information about patterns in data and are perpendicular to each other.
Step 6: Rearrange the Eigenvectors and Eigenvalues in decreasing order.
Step 7: Derive a new dataset.
Dimensions are greatly reduced and most representative features of whole dataset still remain within only selected Eigen features.
B. Haar Wavelet Transform
Transform of signal is another form of representation of signal but doesn‟t change the information content present in signal. Transformation of signal is done to obtain the further information which is not present in raw signal. The wavelet transform decomposes the image into a set of different resolution sub-images, corresponds to various frequency bands. Basic idea of DWT is to approximate a signal through a set of given mathematical functions [1]. This yields a multi-resolution decomposition of signal into four sub-bands called approximation and details.
𝑦𝑙𝑜𝑤 𝑛 = 𝑥 𝑘 𝑔[2𝑛 − 𝑘] ∞
𝑘=−∞
𝑦ℎ𝑖𝑔ℎ 𝑛 = 𝑥 𝑘 ℎ[2𝑛 − 𝑘] ∞
𝑘=−∞
Haar is a simplest wavelet and is a sequence of rescaled “square shaped” functions which together form a wavelet family [6]. Haar wavelet‟s mother wavelet function Ψ (t) can be described as:
𝜑(𝑡) =
1, 0 < 𝑡 < 1/2 −1, 1/2 < 𝑡 < 1 0, 𝑜𝑡ℎ𝑒𝑟𝑤𝑖𝑠𝑒
Its scaling function ∅(𝑡) can be described as:
∅ 𝑡 = −1,0, 0 < 𝑡 < 1𝑜𝑡ℎ𝑒𝑟𝑤𝑖𝑠𝑒
Haar wavelet decomposes an high-frequency components into further four sub-bands, LL, LH, HL, HH resp. LLk,HLj, LHj, HHj ; where j= 1,2,….k
K denotes the image‟s decomposition scale levels of wavelet transform ,LLkdenotes the kth level low-frequency
sub-image and HLj, LHj, HHj denote the jth scale high
frequency sub-images, where HL indicates variation along X-axis and LH indicates variation along Y-axis. Power is more compacted in LL band. In order to obtain more image detail information, decompose further high-frequency components using haar wavelet transform. It helps to obtain more detailed information in all level sub-images except low-frequency sub-images.
112
All Rights Reserved © 2012 IJARCSEE
{HHj00, HHj01 HHj10 HHj11}
Where j= 1, 2…. K and j00, j01, j10, j11 denote the position of four sub-images.
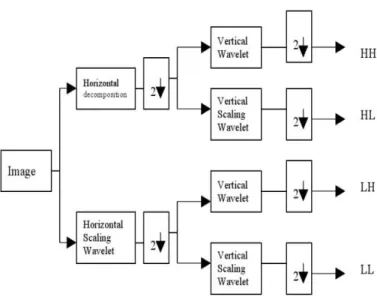
Figure 5: Wavelet decomposition
Above process shown in fig. 5 depicts how the image is decomposed into different sub-bands.
C. Features extracted from images:
There are several features in images which are able to represent whole image if extracted carefully. In this work; only three features are extracted and they are described below:
Mean: It is an average value and measures the general brightness of an image.
Variance: It is a measure of spread of data in data set. Covariance between one dimension and itself is called as variance.
Standard Deviation: It calculates the average distance from mean of the data set to a point.
V. CLASSIFICATION
Classification refers to the analysis of the properties of an image. Depending upon the analysis; the dataset is further referred into different classes. Input features are categorized as 0 and 1.The classification process is divided
into two phases: training phase and testing phase. In training phase; known data is given and in testing phase; unknown data is given. Classification is done by using classifier after training.
A .K-Nearest Neighbor (K-NN)
K-NN is a method for classifying objects based on closest training examples in feature space. K-NN is a type of instance based learning where the function is locally approximated. This is simplest of all machine learning algorithms. An object is classified by majority vote of its neighbors, with the object being assigned to class most common among its K nearest neighbor.
K-Nearest Neighbors (KNN) classification divides given data into a training set and a test set. For each row of the test set; the K nearest (in Euclidean distance) training set objects are found, and the classification is determined by majority vote with ties broken at random [7]. If there is tie for the 𝑘𝑡ℎ nearest vector, all candidates are included in the vote. The training examples are vectors in a multidimensional feature space, each with a class label. The training phase of the algorithm consists only of storing the feature vectors and class labels of the training samples. In the classification phase, k is a user-defined constant and any query point is classified by assigning the label which is most frequent among the k training samples nearest to that query point.
By default, Euclidean distance method is used to calculate the distance between query points with k=1. In case of text classification; hamming distance can be used.
VI. FOLLOWED STEPS FOR FEATURE EXTRACTION AND CLASSIFICATION
As shown in fig.6; the proposed methodology is divided into two phases. They are discussed in this section.
A. Training Phase
1. Obtain any image and convert it into matrix form. Store the resultant image in the form of array; it can be 2-dimensional or 3-dimensional depending upon the image. Matrix can be of class single, double, uint8, uint16.
113
All Rights Reserved © 2012 IJARCSEE
represents black pixel and 255 represents white pixel. In between values represents different gray levels. 3. Apply an algorithm developed using PCA on matrix.
It transforms the data into uncorrelated form by reducing redundant variables from matrix. It is done by calculating the variables having large amount of variance. Extract the required features from newly derived dataset.
4. Now, apply wavelet transform on matrix. Decompose the image into sub-image .They are further decomposed into four sub-bands LL,LH,HL,HH and provide values approximation detail, horizontal detail, vertical detail and diagonal detail. Out of these approximation details have been selected for feature extraction.
5. Save the above extracted features in your system with .mat extension for further process.
6. Now, train the K-NN classifier using extracted features for classification. This can be done by applying the features as an input to the classifier. It classifies between images by calculating the distance between test data and train data. Also by changing the value of K. In this thesis; K=1 have been considered by using Euclidean distance as distance method. Having large number of features in train data; classifier will get trained more and leads to better accuracy.
B. Test Phase
7. Next step is to test the performance of classifier by using test images. Repeat the steps as discussed in points 1 to 5. Apply the test data to classifier. It differentiates between images by calculating the Euclidean distance between the data points and value of K selected is 1. Images having minimum distance with train images are taken as they belong to the same class. If not; their distance are further calculated with another image in train data.
8. Same process is repeated for Brodatz texture images.
The flow chart gives an idea of steps followed during training phase and test phase for feature extraction and classification for both medical images and Brodatz texture.
Figure 6: Proposed Methodology
VII. RESULTS
As discussed above; three features have been extracted from images using two different feature extraction algorithms. In Brodatz texture classification; out of 9, 8 images are correctly classified with 1 misclassification when features are extracted by PCA. Similarly when features extracted by Wavelet transform; all 9 images are correctly classified without any misclassification.
Below shown tables gives values for normal images for variance and standard deviation. Images having feature values beyond these ranges are considered as abnormal images. During classification process; values of standard deviation have been given more importance. The same results are also shown in graphical form.
Brain CT-scan images as input
Feature extraction
Features by PCA Features by Wavelet Transform
K-NN Classifier
Normal Abnormal
Decision Start
114
All Rights Reserved © 2012 IJARCSEE
TABLE I: Classification results for Brain CT-Scan images with feature values by PCA
FEATURES BY PCA MAXIMUM MINIMUM
STANDARD DEVIATION 19.2869 17.9485
VARIANCE 3447.8268 1456.4312
TOTAL IMAGES IN TEST DATASET 7
ACCURATELY CLASSIFIED BY K-NN 7
TABLE II: Classification results for Brain CT-Scan images with feature values by Wavelet Transform
FEATURES BY
WAVELET TANSFORM MAXIMUM MINIMUM
STANDARD DEVIATION 108.000 77.000
VARIANCE 12897.6728 6794.5950
TOTAL IMAGES IN TEST DATASET 7
ACCURATELY CLASSIFIED BY K-NN 6
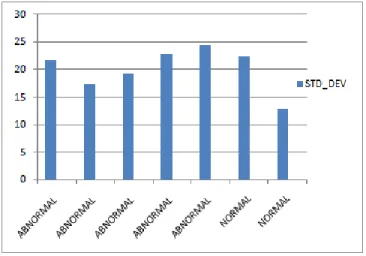
A. Graphs
Figure 7: Variance by PCA
Figure 8: Standard Deviation by PCA
Figure 9: Variance by Wavelet Transform
115
All Rights Reserved © 2012 IJARCSEE
The above shown graphs represent the values of variance and standard deviation in the form of bars for normal and abnormal Brain CT-Scan images extracted by PCA and Wavelet Transform.
VIII. CONCLUSION
PCA and Wavelet transform are very efficient tools for feature extraction and they are very successfully used in biomedical image processing. In this paper, classification technique is developed to automatically detect whether an abnormality in CT-Scan exists or not. If the relevant features are successfully extracted from brain CT-Scan images; they can help in detection of abnormalities in human body at very initial stage which helps to save the previous human life. Same features are extracted by both algorithms. After classification; the performance of classifier is discussed below with both PCA and Wavelet Transform with same features.
For Brodatz Texture images; features by PCA gives maximum classification accuracy of 88.88% with execution time of 0.7480 seconds. On the other hand; features extracted by Wavelet Transform gives maximum accuracy of 100% with execution time of 0.1912 seconds.
For Brain CT-Scan images; features by PCA gives maximum classification accuracy of 100% with execution time of 0.6133 seconds. Similarly features extracted by Wavelet Transform give maximum classification accuracy of 85.71% with execution time of 0.5508 seconds.
Distance method used to calculate the distance between train points and test points are Euclidean method. From the above discussion; it has been concluded that brain CT-Scan images can be accurately classified if K-NN is used in combination with PCA. Similarly; Brodatz texture can be accurately classified if K-NN is used in combination with Wavelet Transform.
REFERENCES
[1] Amir Rajaei, Lalitha Rangarajan, “Wavelet Based Feature Extraction for Medical Image Classification”. An International Journal of Engineering Sciences, ISSN: 2229-6913 Issue Sept 2011, Vol.4.
[2] EL-Sayed, EL- Dahshan, Abdul- Badeeh M. Salem, Tamer H.Yousin, “A Hybrid Technique for Automatic MRI Brain Images Classification”. Studia Univ. Babes.Bolyai, Volume LIV, Number 1, 2009.
[3] M.Vasantha, “Medical Image Feature Extraction, Selection and Classification”, International Journal of Engineering Science and Technology, Vol.2 (6), 2010, 2071-2076.
[4] Manimegalai.P, Revathy.P, Dr.K.Thanushkodi, “Micro-calcification Detection in Mammogram Image using Wavelet Transform and Neural Network” .International Journal of Advanced Scientific Research and Technology. Issue2.Volume 1(February 2012). ISSN: 2249-9954.
[5] R.Nithya, B.Santhi, “Comparative Study on Feature Extraction Method for Breast Cancer Classification” Journal of Theoretical and Applied Information Technology, 30 Nov, 2011. Vol.33 No.2, ISSN: 1992 - 86
[6] Ms.Yogita K.Dubey, Milind M. Mushrif, “Extraction of Wavelet Based Features for Classification of T2-Weighted MRI Brain Images”. Signal and Image Processing: International Journal (SIPIJ) Vol.3, No.1, February 2012.
[7] N.Suguna, Dr. K.Thanushkodi, “An improved K-nearest neighbor classification using Genetic Algorithm” IJCSI- International Journal of Computer Science Issues, Vol.7 , Issue-4, July 2010. ISSN: 1694-0784
[8] Ryszard S.Choras, “Image Feature Extraction Techniques and Their Applications for CBIR and Biometrics Systems”, International Journal of Biology and Biomedical Engineering. Issue 1, Vol.1, 2007.
Kamaljeet Kaur is pursuing her M-Tech (regular) thesis in Biomedical Image Processing. She had completed her B-Tech in Electronics and Communication Engineering in 2009.She has attended 2 national conferences on image processing. She had published 3 national papers and 1 international journal. Her areas of interest
are Digital Image Processing and
Microcontrollers.