The defects are defined as units that are not members of the intended population. Since it was originally developed, six sigma has become an element of many total quality management (TQM) initiatives. Six sigma is a registered service mark and trademark of Motorola, Inc. Motorola has reported over US $17 billion in savings from six sigma, as of 2006. Other companies using this technique are Honeywell International (previously known as Allied Signal) and Raytheon and General Electric (introduced by Jack Welch). In recent times six sigma has been integrated with the TRIZ methodology for problem solving and product design.[1-4]
INTRODUCTION
Six sigma is a system of practices originally developed to systematically improve processes, by eliminating the defects.
Six Sigma: Process of Understanding the Control and Capability
of Ranitidine Hydrochloride Tablet
Chabukswar AR, Jagdale SC, Kuchekar BS, Joshi VD
1, Deshmukh GR
1,
Kothawade HS, Kuckekar AB, Lokhande PD
2MAEER’s Maharashtra Institute of Pharmacy, MIT Campus, Paud Road, Kothrud, Pune – 411 038,
1Department of Production, Glaxo Smith Kline Pharmaceuticals Ltd., Ambad, Nashik – 422 010, 2Department of Chemistry, University of Pune, Pune, Maharashtra, India
Address for correspondence: Dr. Swati Jagdale; E-mail: [email protected]
ABSTRACT
The process of understanding the control and capability (PUCC) is an iterative closed loop process for continuous improvement. It covers the DMAIC toolkit in its three phases. PUCC is an iterative approach that rotates between the three pillars of the process of understanding, process control, and process capability, with each iteration resulting in a more capable and robust process. It is rightly said that being at the top is a marathon and not a sprint. The objective of the six sigma study of Ranitidine hydrochloride tablets is to achieve perfection in tablet manufacturing by reviewing the present robust manufacturing process, to find out ways to improve and modify the process, which will yield tablets that are defect-free and will give more customer satisfaction. The application of six sigma led to an improved process capability, due to the improved sigma level of the process from 1.5 to 4, a higher yield, due to reduced variation and reduction of thick tablets, reduction in packing line stoppages, reduction in re-work by 50%, a more standardized process, with smooth flow and change in coating suspension reconstitution level (8%w/w), a huge cost reduction of approximately Rs.90 to 95 lakhs per annum, an improved overall efficiency by 30% approximately, and improved overall quality of the product.
Key words: DMAIC, process capability, ranitidine, six sigma
Access this article online Quick Response Code:
Website:
www.jyoungpharm.in
DOI:
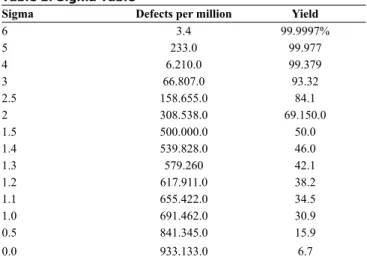
A process that is six sigma (six sigma process quality is considered as world class quality) will yield just two instances of non-conformances out of every billion opportunities, provided there is no shift in the process average, and the same process will yield 3.4 instances of non-conformances out of every million opportunitieswith an expected shift of 1.5 sigma in the process average. A process at four sigma levels (considered average process) is expected to yield 63 instances of non-conformances for every million opportunities, without a shift in process average and 6210 instances of non-conformances with a shift in the process average. Contrary to the above, a process at the two sigma level is considered a poor quality process and is expected to yield 3,08,537 instances of non-conformances with the shift of 1.5 sigma in the process.[5-7] The data for the process at different sigma levels are given in Table 1.
Defect values in the Table 1 suggest that as the sigma level
goes up the defect rate reduces, which means the product quality improves. Six sigma, therefore, is a powerful tool that can transform defect prone business / industry into an organization of perfection. Thus a journey toward sigma level means a journey toward making fewer and fewer mistakes in everything.
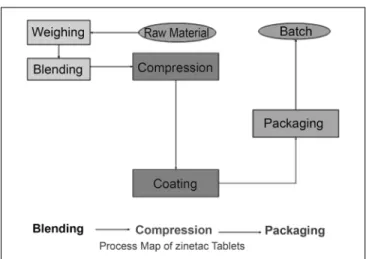
The PUCC framework is explained in Figure 1. The framework can be used to manage: current processes, process change, and new processes. Eight elements of PUCC[8,9] are shown in Figure 2.
DMAIC
The basic methodology consists of the following five steps:
• Define the process improvement goals that are consistent with customer demands and enterprise strategy. • Measure the current process and collect relevant data
for future comparison.
• Analyze, to verify the relationship and causality of factors. Determine what the relationship is, and attempt to ensure that all factors have been considered. • Improve or optimize the process based on the analysis,
using techniques such as the design of the experiments.
• Control, to ensure that any variances are corrected before they result in defects. Set up pilot runs to establish process capability, transition to production, and thereafter continuously measure the process and its capability.[10-12]
EXPERIMENTAL
Focus methodology
PUCC stands for three phases, process of understanding, Table 1: Sigma Table
Sigma Defects per million Yield
6 3.4 99.9997%
5 233.0 99.977
4 6.210.0 99.379
3 66.807.0 93.32
2.5 158.655.0 84.1
2 308.538.0 69.150.0
1.5 500.000.0 50.0
1.4 539.828.0 46.0
1.3 579.260 42.1
1.2 617.911.0 38.2
1.1 655.422.0 34.5
1.0 691.462.0 30.9
0.5 841.345.0 15.9
0.0 933.133.0 6.7
process control, and process capability. These three phases cover the DMAIC methodology of six sigma. Instead of carrying the project in the phases of PUCC, the project was covered by the DMAIC method.[13]
Ranitidine hydrochloride production falls in the following stages: Weighing and blending, Compression, Coating, and Packing.
Forty batches from NL461 – NL500 were monitored throughout these four stages, and enormous data was collected, to cover the measure phase of DMAIC.
The data collected was then analyzed using STATISTICA, MINITAB 14 (STATISTICAL PACKAGES), and MICROSOFT EXCEL.
On completion of the analysis phase, the improved phase is initiated, and then the action plan for the control phase of DMAIC is designed.
Define
The process improvement goals are consistent with customer demands and the enterprise strategy. The complete process of manufacturing is defined in terms of its various process flow diagrams; the definition of the problem must be stated in this step. Process capability parameters are defined and are critical to the customer and to the quality parameters that are defined.
Ranitidine hydrochloride
(RHCL) tablet manufacturing is monitored for a long run, up to 35 batches, with data regarding the characterization of raw materials, comparability study of alternative sources of raw materials, manufacturing process such as blending, compression, and packing, packing material characterization, packing line efficiency, and packing line yields. Data has to be collected and treated statistically, to study the trend analysis and define most of the contributing variables in the process variations. The present Sigma level of the overall manufacturing process is between 1.5 and 2.5, and the target Sigma value is 4.Baseline of manufacturing process is defined using the following tools
The Ranitidine hydrochloride
Process Capability Parameters are, Proposed CTQ Trait, Process Map of RHCL tablets, [Figure 3], Flow diagram for parameters affecting the process, Process flow diagram for RHCL tablets, input process output (IPO) diagram for blending process, IPO diagram for compression process, blending parameters,data required, correlation analysis, variable factor analysis, multiple variable graphs, Pareto charts for variables, line plots, and trend plots.
RHCL process capability parameters
Critical to Customer (CTC): Defects that would make the customer question the quality or effectiveness of the product.[14]
Proposed CTC trait
Color (uniformity, right color) legibility of print / embossing, broken / chipped tablets, thick or thin tablets, efficacy, shape.[15]
• Critical to Quality (CTQ): Defects that would cause a batch rejection, batch re-work or FDA action.
• Critical to Process (CTP); an item that if not held within a certain range as determined through process development would cause out-of-specification results.[16]
Batch reconciliation in dispensing (per raw material), blending time parameters met, blending yield, tablet weights (individual, average), tablet thickness, tablet hardness (individual, average), tablet friability, tablet disintegration time, tablet shape, tablet size, debossing, foreign product / material, uncoated tablet, broken tablet, compression accountability, compression yield, QC assay, equilibrium relative humidity, press speed, pre-compression force, main compression force, blending yield, blending accountability, blending LOD, and tablet assay.
Measure
Evaluation of granule[17]
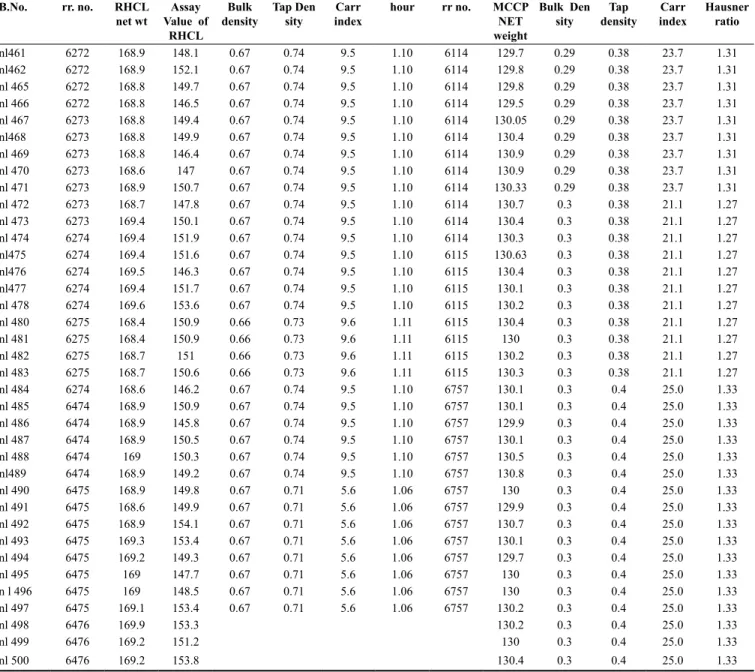
Tables 2 and 3 indicate data for raw material and blending.
Table 2: Data for raw materials
B.No. rr. no. RHCL
net wt Value of Assay RHCL
Bulk
density Tap Den sity indexCarr hour rr no. MCCP NET weight
Bulk Den
sity densityTap indexCarr Hausner ratio
nl461 6272 168.9 148.1 0.67 0.74 9.5 1.10 6114 129.7 0.29 0.38 23.7 1.31 nl462 6272 168.9 152.1 0.67 0.74 9.5 1.10 6114 129.8 0.29 0.38 23.7 1.31 nl 465 6272 168.8 149.7 0.67 0.74 9.5 1.10 6114 129.8 0.29 0.38 23.7 1.31 nl 466 6272 168.8 146.5 0.67 0.74 9.5 1.10 6114 129.5 0.29 0.38 23.7 1.31 nl 467 6273 168.8 149.4 0.67 0.74 9.5 1.10 6114 130.05 0.29 0.38 23.7 1.31 nl468 6273 168.8 149.9 0.67 0.74 9.5 1.10 6114 130.4 0.29 0.38 23.7 1.31 nl 469 6273 168.8 146.4 0.67 0.74 9.5 1.10 6114 130.9 0.29 0.38 23.7 1.31 nl 470 6273 168.6 147 0.67 0.74 9.5 1.10 6114 130.9 0.29 0.38 23.7 1.31 nl 471 6273 168.9 150.7 0.67 0.74 9.5 1.10 6114 130.33 0.29 0.38 23.7 1.31 nl 472 6273 168.7 147.8 0.67 0.74 9.5 1.10 6114 130.7 0.3 0.38 21.1 1.27 nl 473 6273 169.4 150.1 0.67 0.74 9.5 1.10 6114 130.4 0.3 0.38 21.1 1.27 nl 474 6274 169.4 151.9 0.67 0.74 9.5 1.10 6114 130.3 0.3 0.38 21.1 1.27 nl475 6274 169.4 151.6 0.67 0.74 9.5 1.10 6115 130.63 0.3 0.38 21.1 1.27 nl476 6274 169.5 146.3 0.67 0.74 9.5 1.10 6115 130.4 0.3 0.38 21.1 1.27 nl477 6274 169.4 151.7 0.67 0.74 9.5 1.10 6115 130.1 0.3 0.38 21.1 1.27 nl 478 6274 169.6 153.6 0.67 0.74 9.5 1.10 6115 130.2 0.3 0.38 21.1 1.27 nl 480 6275 168.4 150.9 0.66 0.73 9.6 1.11 6115 130.4 0.3 0.38 21.1 1.27 nl 481 6275 168.4 150.9 0.66 0.73 9.6 1.11 6115 130 0.3 0.38 21.1 1.27 nl 482 6275 168.7 151 0.66 0.73 9.6 1.11 6115 130.2 0.3 0.38 21.1 1.27 nl 483 6275 168.7 150.6 0.66 0.73 9.6 1.11 6115 130.3 0.3 0.38 21.1 1.27 nl 484 6274 168.6 146.2 0.67 0.74 9.5 1.10 6757 130.1 0.3 0.4 25.0 1.33 nl 485 6474 168.9 150.9 0.67 0.74 9.5 1.10 6757 130.1 0.3 0.4 25.0 1.33 nl 486 6474 168.9 145.8 0.67 0.74 9.5 1.10 6757 129.9 0.3 0.4 25.0 1.33 nl 487 6474 168.9 150.5 0.67 0.74 9.5 1.10 6757 130.1 0.3 0.4 25.0 1.33 nl 488 6474 169 150.3 0.67 0.74 9.5 1.10 6757 130.5 0.3 0.4 25.0 1.33 nl489 6474 168.9 149.2 0.67 0.74 9.5 1.10 6757 130.8 0.3 0.4 25.0 1.33 nl 490 6475 168.9 149.8 0.67 0.71 5.6 1.06 6757 130 0.3 0.4 25.0 1.33 nl 491 6475 168.6 149.9 0.67 0.71 5.6 1.06 6757 129.9 0.3 0.4 25.0 1.33 nl 492 6475 168.9 154.1 0.67 0.71 5.6 1.06 6757 130.7 0.3 0.4 25.0 1.33 nl 493 6475 169.3 153.4 0.67 0.71 5.6 1.06 6757 130.1 0.3 0.4 25.0 1.33 nl 494 6475 169.2 149.3 0.67 0.71 5.6 1.06 6757 129.7 0.3 0.4 25.0 1.33 nl 495 6475 169 147.7 0.67 0.71 5.6 1.06 6757 130 0.3 0.4 25.0 1.33 n l 496 6475 169 148.5 0.67 0.71 5.6 1.06 6757 130 0.3 0.4 25.0 1.33 nl 497 6475 169.1 153.4 0.67 0.71 5.6 1.06 6757 130.2 0.3 0.4 25.0 1.33
nl 498 6476 169.9 153.3 130.2 0.3 0.4 25.0 1.33
nl 499 6476 169.2 151.2 130 0.3 0.4 25.0 1.33
nl 500 6476 169.2 153.8 130.4 0.3 0.4 25.0 1.33
Evaluation of tablet[18]
The features evaluated were: Tablet thickness and diameter, tablet hardness, friability, uniformity of weight, and uniformity of content.
Analyze
Data collected from 38 batches was analyzed on a statistical tool called ‘Statistica’.
Data was analyzed for the following phases and in the following order:
• Raw material and blending • Compression
• Coating • Packing
Verification of relationships and causality of factors were carried out by using various statistical tools.[19-21] What the relationship was also determined and an attempt was made to ensure that all factors had been considered. (All representative figures of each phase mentioned above had been attached in the same sequence).
Improve
should remain in control, that is, they should be sustained. An action review is important for that, and this was carried out in this phase.
RESULT AND DISCUSSION
Undesirable effects were observed during the analysis of the process using different statistical tools. For minimization of undesirable effects, various changes in terms of process alteration and corrective measures for manual handling of the process were made in the process, for making it more capable and robust.
In order to improve process capability, in the following stages different parameters are targeted and their exact role is discussed.
• Blending • Compression • Coating • Packing
(All representative figures of each phase mentioned above have been attached in the same sequence).
Blending
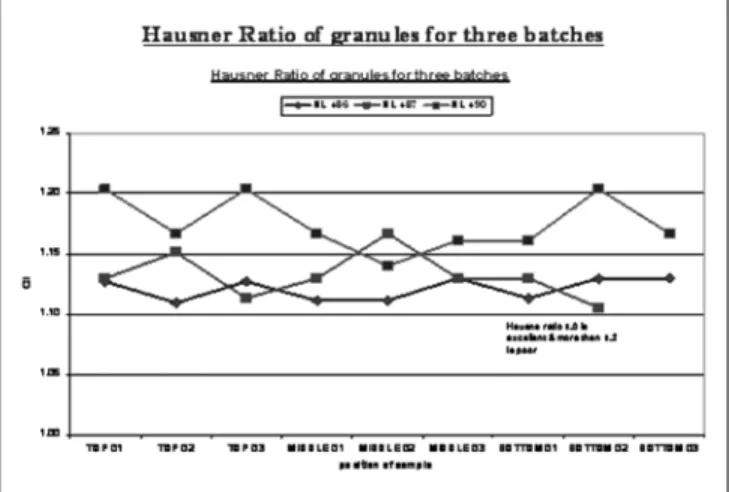
During the blending process, assay variation [Figures 4 and 5] was observed in the range of 146 – 152. In order to overcome this variation, the existing blender had to be replaced with a new blender of higher capacity, it was validated and a measurement system analysis of the blend was performed.
Particle size distribution of Ranitidine Hydrochloride (RHCL) and microcrystalline cellulose (MCCP) was not available to manufacturing heads. This had been informed to the Manufacturing Department on the browser, for RHCL as well as MCCP, from the Quality Assurance Department, with the help of the Information Technology Department.
High cycle time for the activity of weighing, sifting, and blending was required and more manpower was used in this stage for weighing, sifting, and blending. To avoid this, load charting of the weighing, sifting, and blending stage had to be carried out, for minimization of manpower, Recalculation of the cycle time at the installation of the new blender was carried out. Parameters for the granule evaluation are as shown in Table 4 and Figures 6 and 7.
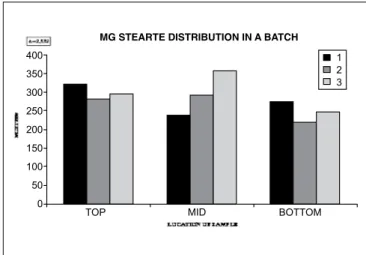
Magnesium stearate [Figure 8] distribution in the batch at the top, middle, and bottom was also observed. For even distribution of magnesium stearate, the angle of repose Table 3: Data on Blending
B no. Speed of blender in
rpm
Time for rotation in
minutes
Weight after blending
in kgs
Total time for blending
in minutes
Weight loss in blending
in kgs
NL 461 24 15 299.45 17:12:15 1.4 NL462 24 15 326.15 16:19:43 1.1 NL 465 24 15 316.8 16:12:21 1.05 NL 466 24 15 299.5 18:40:07 1.025 NL 467 24 15 301.6 16:34:34 -0.5 NL 468 24 15 315.75 16:45:54 2.3 NL 469 24 15 301.2 17:52:45 0.75 NL 470 24 15 300.5 16:07:39 1.25 NL 471 24 15 300.4 19:56:32 1.12 NL 472 24 15 302.75 17:23:34 -1.1 NL 473 24 15 319.5 17:56:03 1.9 NL 474 24 15 327.95 16:49:32 0.7 NL 475 24 15 318.7 16:54:54 1.58 NL 476 24 15 299.8 18:10:02 2.35 NL 477 24 15 299.45 17:10:34 2.3 NL 478 24 15 300.3 16:54:31 1.75 NL480 24 15 318.95 18:59.0 0.6 NL481 24 15 323.7 18:12:21 0.85 NL482 24 15 299.34 16:39:27 1.81 NL483 24 15 299.75 16:50:10 1.5 NL484 24 15 328.85 17:52:10 0.1 NL485 24 15 317.5 17:55:02 2.75 NL486 24 15 299.6 18:16:10 1.45 NL487 24 15 299.9 17:56:03 1.35 NL488 24 15 300.2 16:46:38 1.55 NL489 24 15 299.65 18:13:10 2.3 NL490 24 15 299.95 17:30:30 1.2 NL491 24 15 299.91 17:40:40 0.84 NL492 24 15 300.75 16:30:40 1.1 NL493 24 15 300.05 17:40:50 1.6 NL494 24 15 301.15 18:10:19 1.1 NL495 24 15 322.9 18:07:20 1.85 NK496 24 15 323.75 17:55:33 2.4 NL497 24 15 322.5 17:54:53 1.05 NL498 24 15 326.55 18:05:10 0.8 NL499 24 15 330.15 16:56:10 0.3 NL500 24 15 318.85 17:55:10 1.2
were made for improvements, which were then discussed. Subsequently, these improvements would be implemented and their impact would be observed on the improvement of yield and sigma level. The major U.D.E’s discovered during the analysis phase and their suggestion for improvement made the process more capable and robust.
Control
Figure 7: Carr index of granules for three batches in the blending phase Figure 5: Process capability report of the assay value of RHCL in the blending phase
Figure 4: Trend plot for assay value of RHCL in the blending phase
Figure 6: Hausner ratio of granules for three batches in the blending phase
Table 4: Data on Granules
Sr. no NL 486 NL 487 NL 490
Bulk
density Tapped density Hausner ratio CI Descri-ption densityBulk Tapped density Hausner ratio CI Descri-ption densityBulk Tapped density Hausner ratio CI Descri-ption
Top 01 0.55 0.62 1.13 11.3 E 0.54 0.61 1.13 11.5 E 0.54 0.65 1.20 16.9 F Top 02 0.55 0.61 .11 9.8 E 0.53 0.61 1.15 13,1 G 0.54 0.63 1.17 14.3 G Top 03 0.55 0.62 1.13 11.3 E 0.53 0.59 1.11 10.2 E 0.54 0.65 1.20 16.9 F Middle 01 0.54 0.6 1.11 10.0 E 0.54 0.61 1.13 11.5 E 0.54 0.64 1.17 14.3 E Middle 02 0.54 0.6 1.11 10.0 E 0.54 0.63 1.17 14.3 G 0.57 0.65 1.14 12.3 E Middle 03 0.54 0.61 1.13 11.5 E 0.54 0.61 1.13 11.5 E 0.56 0.65 1.16 1.16 E Bottom 01 0.53 0.59 1.11 10.2 E 0.54 0.61 1.13 11.5 E 0.56 0.65 1.16 13.8 E Bottom 02 0.54 0.61 1.13 11.5 E 0.57 0.630 1.11 9.5 E 0.54 0.65 1.20 16.9 F Bottom 03 0.54 0.61 1.13 11.5 E 0.55 0.61 1.09 8.3 E 0.54 0.63 1.17 14.3 G
Carr Index Descriptor
5 – 15 Excellent
12 – 16 Good
18 – 21 Fair to passable
23 – 25 Poor
33 – 38 Very poor 40 Very very poor
studies was carried out at the time of installation of the new blender.
Compression
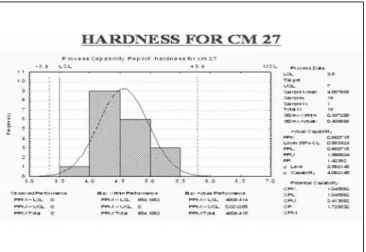
and tablet hardness was observed in Table 5, Figures 9 -13.
In order to solve the variation in the compression stage of different machines, data was observed and entered simultaneously on a run chart after replacement of a punch set. Checking the thickness of the tablets on the first two rotations of the machine, every time the machine was restarted, and also collection of data on punch height was done.
Average U.R (Utilizable Residue) produced per batch was 3.5%, that led to extra man hours for rework. In order to overcome this variation, interlinking the speed of the machine and force feeder was done and also inspection of
Figure 8: Distribution of magnesium stearate in a batch, in the blending phase
TOP MID BOTTOM
400 350 300 250 200 150 100 50 0
MG STEARTE DISTRIBUTION IN A BATCH
1 2 3
Table 5: Compression Data
Compression on CM 26
B. no. m c no Avg. weight
in gms
Avg. thickness
in mms Avg hardness Kg/cm2 Friability in % UR generated In kgs
NL 462 cm 26 0.2997 4.52673 4.9 0.203 8.9
NL 465 cm 26 0.3017 4.47627 4.2 0.231 11.23
NL467 cm 26 0.2979 4.46443 4.75 0.197 8.98
NL469 cm 26 0.3023 4.4972 4.95 0.222 12.2
NL471 cm 26 0.3011 4.5111 5.15 0.108 8.67
NL473 cm26 0.3026 4.48853 4.55 0.197 9.08
NL475 cm 26 0.3025 4.438 4.95 0.228 13.9
NL477 cm 26 0.2995 4.40651 5.2 0.26 8.02
NL481 cm 26 0.3003 4.46448 4.55 0.358 9
NL483 cm 26 0.2998 4.45533 4.25 0.311 9
NL485 cm 26 0.3013 4.4815 4.4 0.299 8.552
NL488 cm 26 0.2968 4.4744 4.3 0.268 9.8
NL490 cm 26 0.2957 4.459 4.55 0.299 9.23
NL492 cm 26 0.2997 4.486 4.65 0.292 11.72
NL494 cm 26 0.3021 4.3963 5.2 0.323 9.23
NL496 cm 26 0.2914 4.436 3.15 0.221 10.8
NL498 cm 26 0.299 4.464 4.45 0.244 9.4
NL499 cm 26 0.3005 4.4455 4.3 0.26 12.8
whether the tablets were taken out, each time the machine was adjusted or not was checked.
Considerable variation in friability was found and in order to solve this variation, monitoring of moisture content was done regularly and data was generated for CHEMFILED, to compare it with the existing RANQ.
More unaccounted time and minor stoppages were observed and to minimize this, Time value mapping of the cleaning activity on a daily and weekly basis was done and operator attitude and awareness was addressed.
Rotation of the machine operator was observed daily. To minimize this, the staff was fixed for a period of two weeks.
Time wasted while the first shift ended (30 minutes closing time) and the second shift started (15 minutes starting time) was observed. To utilize that time, overlapping between these two times were challenged.
The Present Overall Equipment Effectiveness (OEE) is 28.75%, and 28.30% for Compression machine CM26 and CM27 was observed. To improve the Overall Equipment Effectiveness (OEE) level up to 45% for CM26 and CM27 as a first target, the project had to be taken by the manufacturing heads.
Coating
Figure 9: Trend chart for average weight in the compression phase
Figure 11: Trend chart for average hardness in the compression phase
Figure 10: Trend chart for average thickness in the compression phase
Figure 12: Trend chart for friability in the compression phase
Figure 13: Process capability report of hardness in the compression phase
[Tables 6 and 7, Figures 14 and 15] as well as individual gun spray rate variation (50 ml – 450 ml) was observed,
in order to solve this variation, Gun maintenance and replacement was done and when required chocking of guns to be minimized or eradicated and also gun cleaning frequency and its effectiveness to be addressed.
Considerable variation in the parameters like: inlet air temperature, outlet air temperature, inlet air cfm, outlet air cfm, tablet bed temperature, and so on were observed. In order to minimize these variations, the same parameters were kept in PLC for both the coating pan and calibration of velocity. The sensor for filter cleaning was done. Also standard parameters values were set.
No robust method of measurement was available to measure gun distance from tablet bed, In order to solve this problem; Collection of data to see the validated results was done.
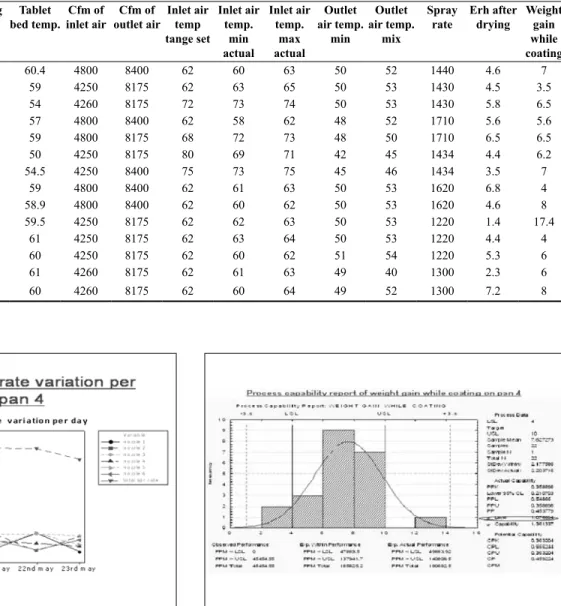
Table 6: Data on coating spray rate
Date Coating pan Nozzle 1 Nozzle 2 Nozzle 3 Nozzle 4 Nozzle 5 Nozzle 6 Total spray Avg. spray Spray time
16 May 4 250 450 450 230 300 50 1430 238.3333 115.3846154 17 May 4 200 375 400 450 200 50 1675 279.1667 98.50746269 18 May 4 150 310 310 250 100 160 1280 213.3333 128.90625 21 May 4 160 400 400 290 200 310 1760 293.3333 93.75 22 May 4 410 130 400 250 410 150 1750 291.6667 94.28571429 23 May 4 120 360 370 210 225 300 1585 264.1667 104.1009464
Table 7: Coating data on pan no. 5
B. no. Coating pan no. coating Total
time
Drying
time bed temp.Tablet inlet airCfm of outlet airCfm of Inlet air temp tange set
Inlet air temp.
min actual
Inlet air temp.
max actual
Outlet air temp.
min
Outlet air temp.
mix
Spray
rate Erh after drying Weight gain while coating
NL466 5 203 53 60.4 4800 8400 62 60 63 50 52 1440 4.6 7 NL469 5 230 72 59 4250 8175 62 63 65 50 53 1430 4.5 3.5 NL471 5 200 50 54 4260 8175 72 73 74 50 53 1430 5.8 6.5 NL475 5 190 40 57 4800 8400 62 58 62 48 52 1710 5.6 5.6 NL477 5 190 42 59 4800 8175 68 72 73 48 50 1710 6.5 6.5 NL481 5 220 60 50 4250 8175 80 69 71 42 45 1434 4.4 6.2 NL483 5 190 42 54.5 4250 8400 75 73 75 45 46 1434 3.5 7 NL486 5 220 53 59 4800 8400 62 61 63 50 53 1620 6.8 4 NL488 5 200 54 58.9 4800 8400 62 60 62 50 53 1620 4.6 8 NL492 5 215 65 59.5 4250 8175 62 62 63 50 53 1220 1.4 17.4 NL494 5 175 35 61 4250 8175 62 63 64 50 53 1220 4.4 4 NL496 5 220 63 60 4250 8175 62 60 62 51 54 1220 5.3 6 NL498 5 230 78 61 4260 8175 62 61 63 49 40 1300 2.3 6 NL500 5 210 55 60 4260 8175 62 60 64 49 52 1300 7.2 8
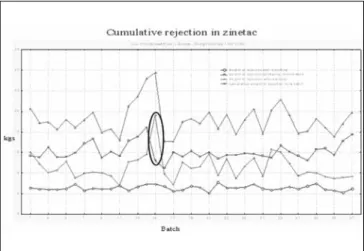
Figure 15: Process capability report of weight gain while coating on pan 4 in the coating phase
Figure 14: Cumulative spray rate variation per day in pan 4 of the coating phase
to solve this variation in weight gain, interaction of controllable parameter in coating that results in more or less weight gain, for e.g. spray rate ,inlet and outlet air temp, inlet and outlet air cfm, atomizing air pressure was observed.
Present Overall Equipment Effectiveness (OEE) is 34.48%
and 23.66% for coating pan4 and coating pan5, respectively. In order to improve the Overall Equipment Effectiveness (OEE) level up to 50 - 55% for both the pans as a first target, the project was taken up by manufacturing heads.
Table 8: Packing data on line no. 1 B. no. Line No. Total working time for batch Temp of left r
oller
min
Temp of left r
oller
min
Temp of left r
oller
min
Temp of left r
oller min W eight tr an sf er re d fr om coating
Stoppages (in mins)
W
eight of
tablet after defoiling
W
eight of defoiled strip and blank strip Run time in mins Unacco- unted time
For
M/c
adjustment
Roll change Printing or othr problem Tablet problem
Br
eaks
Total
stoppage in mins
NL 461 1 691 133 179 148 170 316.5 34 36 30 61 77 233 1003 15.57 453 73 NL 462 1 575 143 171 139 182 294.6 10 41 5 30 90 176 563 10.148 400 20 NL 473 1 535 143 167 139 220 310.4 15 30 2 21 75 148 21 3.85 395 15 NL 477 1 843 160 182 154 189 307.9 36 39 20 74 130 299 1903 21.8 544 164 NL 482 1 542 151 186 157 177 293.1 14 31 10 15 75 145 609 775 397 17 NL 489 1 594 145 182 144 179 295.1 4 36 19 11 80 150 86 13.44 444 64 NL 493 1 544 145 174 147 160 297.7 23 27 9 9 75 143 735 9.44 401 21 NL 500 1 545 135 165 148 170 315.15 7 36 4 8 70 123 415 7.97 422 42
for change in coating suspension Reconstitution Level. In order to carry out the six sigma tool, design of experiment (DOE) for change in coating suspension Reconstitution Level, a separate project had to be handled. For that an STP (Situation, Target, and Plan) was prepared and also a trial protocol prepared.
Packing
The Average Overall Equipment Effectiveness (OEE) of packing lines [Table 8, Figure 16] was 40.53% (single shift bases), with individual line OEE being: line 1 (39.39217%), line 2 (46.18117%), line 3 (39.16551%), line 4 (35.52693), and line 6 (42.38882%).
In order to achieve Overall Equipment Effectiveness (OEE) level in the range of 50 - 65% for all the packing lines as a first target, the project had to be taken by the Packing Department heads.
It has been observed that the Roll change time contributes to 25 – 34% of total stoppage time while completing a batch. To minimize this time period, the procedure was standardized for changing the rolls. Also efforts were made by the Engineering. Department to bring automation in the process of roll change and the process mapping was carried out at least once in a fortnight.
A run time (on a single shift basis of 570 minutes) of 320 minutes was observed and to increase this run time, the stoppages due to machine adjustment, tablet problem, and other miscellaneous factors were minimized. Also process mapping was carried out once in a month. Mapping of micro-stoppages, morning–evening tea breaks, and ground level exit was carried out, to minimize unaccounted time,
and a BRAVO CARDsystem was implemented, to give
recognition to the line operator who was providing the maximum output in a week.
Loose winding of plane and printed rolls were observed. In order to solve this problem, the issue was addressed at the time of procurement of the rolls from the supplier.
The average foil rejection per batch was 12 kg and the average weight of the defoiled tablets was 6 kg per batch. [Figure 16]. To minimize this rejection, the variation in tablet thickness, hardness, weight, and coating, was reduced, which made the compression and coating stage more robust, to produce minimum number of defects. The operator attitude and awareness was also addressed, and machine issues that led to tablet and foil rejection, were taken care of by the Engineering Department.
CONCLUSION
As various UDEs (Undesirable effects) were discovered and discussed in the analysis, an improved phase of DMAIC, recommendations, and suggestions came about, to make the present process more robust against defects, either by bringing new steps in the process or by improving the same existent current process. This will result in benefits, some tangible and some non-tangible.
• Given here are some value additions from the process of RHCL production obtained by the implementing of PUCCInstallation of high capacity blender of 1000 kg, replacing the current 300 kg blender, thus saving the man-hours by 66% (approximately).
• Introducing high capacity tote-bins of 200 – 300 kgs, which would result in reducing the unloading time from the blender, coating the pan to one-third. Man and material motion would be reduced to one-third. Time of loading and unloading of tote-bins, to lifts, and to and from the mezzanine floor would be one-third. Batch changeover time would be reduced to 33% of the current time, and hence, less amount of U.R would be generated.
• OEE improvement for compression, coating, and packing stage, which would lead to 30 – 35% increase in OEE for RHCL 150 MG tablets production. • Set up time reduction for the whole process by 40 –
50%.
• Release of 20 – 30% of the manpower.
• Process waste reduction, both in compression and packing by 35%
• Rework reduction by 50 – 70%. • Reduction in packing line stoppages.
• Improved process capability due to improved sigma level.
• A more standardize process.
ACKNOWLEDGEMENT
The authors are grateful to Glaxo Smith Kline Pharmaceuticals Ltd., Ambad, Nashik - 422010. Maharashtra, India, for their support and for allowing this study to be carried out in their industry.
REFERENCES
1. Edgeman RK. Six sigma in communities of care: Improved care via institutionalized genius business briefing: Global healthcare, (invited contribution) World Medical Association – 53rd General Assembly London, UK. 2002;2:46-9.
2. Edgeman RK, David IB, Thomas AF. Mission critical: Six sigma and business excellence for information technology. Qual Reliab Eng Int 2005;27:25-30.
3. Abraham B, Mackay J. Discussion of Six sigma black belts: What do they need to know? J Qual Technol 2001;33:410-3.
4. Edgeman RK, Bigio D, Ferleman T. Six Sigma or business excellence: Strategic and tactical examination of IT service level management at the office of the chief Technology Officer of Washington, DC. (Invited Contribution). Qual Reliab Eng Int 2005;21:30-40.
5. Noble K. Is six sigma a fad. Qual Prog Mag 2005;14:14-20.
6. Ramberg J. Six Sigma: Fad or Fundamental? Qual Dig 2000. p. 28-32. Available from: http://www.qualitydigest.com/may00/html/sixsigmapro.
html [last cited on ]
7. Pyzdek T. Discussion, Six Sigma Black Belts: What do they need to know? J Qual Technol 2001;33:418-20.
8. Niles K. What makes six sigma work: Six Sigma Insights Newsletter. 2001;2:44. Available from: http://www.iSixSigma.com/library/content/
c010723a.asp [last cited on 2010 Mar 17].
9. Niles K. Process Improvement Prerequisites : ASQ Six Sigma Forum. Available from: http://www.sixsigmaforum.com/ [last cited on 2003].
10. Mikel JH. Six sigma a breakthrough strategy for profitability. Qual Prog
1998;31:35-42.
11. Joseph A, De F, William WB. JURAN institute's six sigma breakthrough and beyond - quality performance breakthrough methods. India, Pune: Tata McGraw-Hill Publishing Company Limited; 2005.
12. Klefsjo B, Wiklund H, Edgeman R. Six sigma seen as a methodology for total quality management. Measuring Bus Excell 2001;5:31-5.
13. Antony J, Coronado R. Design for Six Sigma. Manuf Engineer 2002;81:24-6.
14. Cryer JD, Ryan TP. The estimation of sigma for an x chart. J Qual Technol
1990;22:187-91.
15. Edgeman R, Bigio D. Six sigma as metaphor: heresy or holy writ. Qual
Prog Mag 2004;37:25-30.
16. Jiju A, Mohammed Z. World class applications of six sigma: Case studies
from manufacturing and service industries. Oxford, UK: Elsevier Science;
2005.
17. Aulton ME. Pharmaceutics: The science of dosage form design. 2nd ed.
Livingstone C: Elsevier Science Ltd; 2002. p. 315-20.
18. Indian Pharmacopoeia. Government of India Ministry of Health and Family Welfare. Delhi: Published by the controller of Publications; 1996. p. 736.
19. David B, Rick L, Edgeman F, Thomas F. Six sigma availability management of information technology in the office of the chief technology officer of Washington, DC. Total Qual Manag 2004;15:689-97.
20. Niles K. Six sigma and design of experiments: ASQ Six Sigma Forum. 2008:1-26. Available from: http://www.sixsigmaforum.com/mbb/index.
html [last cited on 2010 Mar 17].
21. Pearson T. Measure for Six Sigma success. Qual Prog 2001;34:35-40.
22. Snee R. Why should statisticians pay attention to Six Sigma? Qual Prog
1999;32:100-3.
Source of Support: Glaxo Smith Kline Pharmaceuticals Ltd., Ambad, Nashik - 422010. Maharashtra, India,