R E S E A R C H A R T I C L E
Open Access
An integrated analysis of the SOX2 microRNA
response program in human pluripotent and
nullipotent stem cell lines
Sebastian F Vencken
1,2*, Praveen Sethupathy
3, Gordon Blackshields
1,2, Cathy Spillane
1,2, Salah Elbaruni
1,2, Orla Sheils
1,2,
Michael F Gallagher
1,2*†and John J O
’Leary
1,2†Abstract
Background: SOX2 is a core component of the transcriptional network responsible for maintaining embryonal carcinoma cells (ECCs) in a pluripotent, undifferentiated state of self-renewal. As such, SOX2 is an oncogenic transcription factor and crucial cancer stem cell (CSC) biomarker in embryonal carcinoma and, as more recently found, in the stem-like cancer cell component of many other malignancies. SOX2 is furthermore a crucial factor in the maintenance of adult stem cell phenotypes and has additional roles in cell fate determination. The SOX2-linked microRNA (miRNA) transcriptome and regulome has not yet been fully defined in human pluripotent cells or CSCs. To improve our understanding of the SOX2-linked miRNA regulatory network as a contribution to the phenotype of these cell types, we used high-throughput differential miRNA and gene expression analysis combined with existing genome-wide SOX2 chromatin immunoprecipitation (ChIP) data to map the SOX2 miRNA transcriptome in two human embryonal carcinoma cell (hECC) lines.
Results: Whole-microRNAome and genome analysis of SOX2-silenced hECCs revealed many miRNAs regulated by SOX2, including several with highly characterised functions in both cancer and embryonic stem cell (ESC) biology. We subsequently performed genome-wide differential expression analysis and applied a Monte Carlo simulation algorithm and target prediction to identify a SOX2-linked miRNA regulome, which was strongly enriched with epithelial-to-mesenchymal transition (EMT) markers. Additionally, several deregulated miRNAs important to EMT processes had SOX2 binding sites in their promoter regions.
Conclusion: In ESC-like CSCs, SOX2 regulates a large miRNA network that regulates and interlinks the expression of crucial genes involved in EMT.
Keywords: SOX2, microRNA, Embryonic stem cell, Embryonal carcinoma, Pluripotency, EMT Background
SOX2 is a member of the SRY-related HMG-box (SOX) transcription factor family with a set of well-established and diverse roles in stem cell potency and maintenance, embryonic development and cancer [1-10]. It regulates extensive and often divergent transcriptional networks across different cell types [1,2,11,12]. SOX2 is best known as a core pluripotency factor, maintaining the
undifferentiated phenotype of pluripotent stem cells, and is closely co-regulated alongside core pluripotency fac-tors OCT4 and NANOG in undifferentiated embryonic stem cells (ESCs), embryonal carcinoma cells (ECCs) and induced pluripotent stem cells (iPSCs) [8,13,14]. Loss of SOX2 expression in these cell lines triggers their differentiation. More recently, SOX2 has been identified as a crucial player in the maintenance and differentiation of adult stem cells such as in neural stem cells [15]. As an oncogene, SOX2 has been implicated in many differ-ent malignancies of the cdiffer-entral nervous, gastrointestinal, circulatory, respiratory, endocrine and skeletal systems, and also those of the skin, liver, gonads and breast * Correspondence:[email protected];[email protected]
†Equal contributors
1Department of Histopathology, Trinity College Dublin, Sir Patrick Dun
Research Laboratory, St. James’s Hospital, Dublin, Ireland
2The Coombe Women and Infants University Hospital, Dublin, Ireland
Full list of author information is available at the end of the article
© 2014 Vencken et al.; licensee BioMed Central Ltd. This is an Open Access article distributed under the terms of the Creative Commons Attribution License (http://creativecommons.org/licenses/by/2.0), which permits unrestricted use, distribution, and reproduction in any medium, provided the original work is properly credited. The Creative Commons Public Domain Dedication waiver (http://creativecommons.org/publicdomain/zero/1.0/) applies to the data made available in this article, unless otherwise stated.
[1-7,10]. However, despite its oncogenic potential in nu-merous tumour types, the suppression of SOX2 has been reported as a hallmark of gastric carcinoma [16-18]. In malignancy growing evidence reveals SOX2 to be a cen-tral regulator of a tumourigenic, stem cell-like subpopu-lation of tumour cells, frequently referred to as cancer stem cells (CSCs), which are found to be responsible for the proliferative and invasive capacities of most tumour types [7]. Many of the genes regulated by SOX2 in nor-mal stem cells are aberrantly regulated by this transcrip-tion factor in cancerous cells with a similar, albeit malignant phenotype.
MicroRNAs (miRNA) are a functional family of short (21–23 nt), non-protein coding RNA transcripts that primarily, but not exclusively, confer regulation of gene expression by targeting mRNAs for degradation or tran-sient translational repression by post-transcriptionally binding these in a directed manner [19]. They are in-volved in the regulation of almost all cell processes and maintain cell homeostasis in both healthy and disease conditions. In cancer and CSCs, many miRNAs have been identified as tumour suppressive or oncogenic miRNAs (oncomiRs) [20]. Many of these miRNAs also have im-portant regulatory functions in pluripotent cells, such as ESCs and ECCs, and in embryonic development [20,21].
Although the SOX2 transcriptome of protein coding genes has been previously mapped in various cell types and tissues, including ECCs, with techniques such as chromatin immunoprecipitation (ChIP) and gene array profiling, no extensive SOX2-transcriptome analysis has been performed for miRNAs in human pluripotent cells [1,2,11,12,22-25]. Some insight into the SOX2-linked miRNAome in murine pluripotent cells has previously been provided by Marson et al. who performed an exten-sive ChIP-sequencing (ChIP-seq) analysis of SOX2-bound miRNA promoters in mouse ESCs [26]. Additionally, in a study of the SOX2 regulatory network in human ESCs (hESCs), Boyer et al. produced a limited set of exclusively intragenic miRNAs that were potentially regulated by the SOX2-binding sites within the promoter regions of their respective host genes [11]. However, both Marson et al. and Boyer et al. provide no SOX2 knock-down and miRNA expression analysis to functionally link this tran-scription factor to specific miRNAs. Fang et al. profiled genes and miRNAs regulated by SOX2 in glioblastoma multiforme (GBM) cells [1]. Notably absent from this study were an in-depth analysis of miRNAs directly regu-lated by SOX2 and a large scale combinatorial study of the gene target regulome of deregulated miRNAs in these cells.
To map the functions of this miRNA network in pluri-potent cell and CSC biology, we silenced SOX2 in two human ECC (hECC) lines followed by a high-throughput expression analysis of expression changes in its associated
miRNA network. To reveal genes potentially regulated by SOX2 through its linked miRNA regulome, we profiled whole-genome differential mRNA expression and applied a Monte Carlo algorithm to identify a subset of SOX2-regulated miRNAs that confer a significant regulatory sig-nature on the differential gene expression profile in hECCs. This type of analysis has been performed before and is enabled by the finding that the majority of total miRNA-mediated gene suppression functions through mRNA degradation, thus functional miRNA activity can be determined by measuring the expression of their tar-gets at the transcript level [27-36]. Finally, to identify can-didate miRNAs with a direct transcriptional association to SOX2, we applied existing SOX2 ChIP-seq and miRNA promoter data to our differential expression profiles.
To study SOX2 in both a CSC and pluripotent cell context, we chose the 2102Ep and NTera-2 hECC lines, the CSC component of teratocarcinoma, a type of germ cell tumour. The NTera-2 cell line is pluripotent and is frequently used as cell model to study ectodermal differ-entiation [37]. 2102Ep cells are considered ‘nullipotent’ as they are resistant to retinoic acid-induced differenti-ation and form homogenous EC tumours when xeno-grafted into mice [38,39]. 2102Ep cell differentiation can however be induced by low-density growth or by silen-cing core pluripotency factors SOX2 and OCT4 [23,38]. Because 2102Ep and NTera-2 cell lines are phenotypic-ally similar to hESCs in an undifferentiated state and during early differentiation stages, they have previously been used as an alternative hESC model [14,23,38-43]. For this study, 2102Ep and NTera-2 cells could provide significant insights into the post-transcriptional regula-tory functions of SOX2 towards both cancer stemness and embryonic stemness.
Based on parameters set in our analysis we present sev-eral novel miRNAs that are direct transcriptional targets of SOX2. Indirect targets of this transcription factor in-cluded, we found many pro and anti-malignant miRNAs that also have important functions in embryonic develop-ment. Statistical analysis of whole-genome differential mRNA expression revealed a distinct Type 1 epithelial-to-mesenchymal (EMT) signature in an miRNA/gene target regulatory network linked to SOX2.
Results
SOX2 knock-down in 2102Ep and NTera-2 cells results in many altered miRNAs involved in both cancer and embryonic development
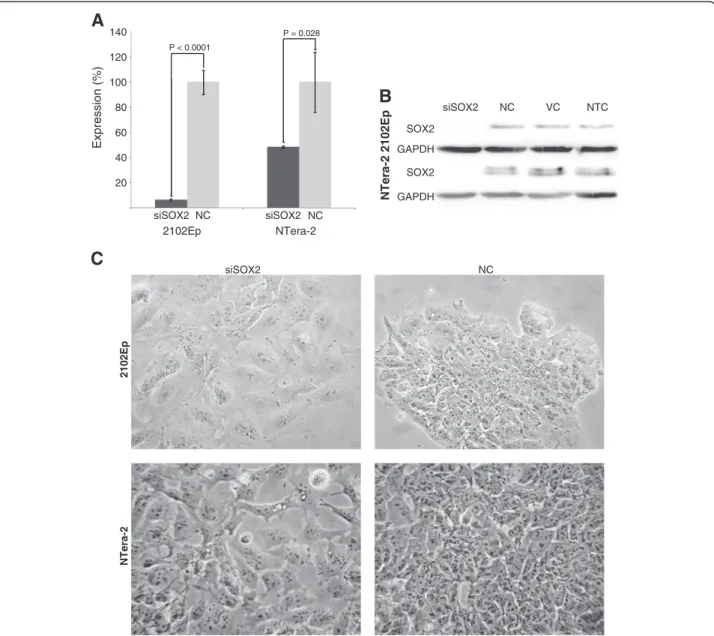
SOX2 was selected for RNAi-mediated silencing in the two hECC lines and an siRNA with specific complemen-tarity to SOX2 mRNA (siSOX2). Successful knock-down was confirmed by comparing SOX2 mRNA and protein expression with cells transfected with a non-targeting control (Figure 1A and Figure 1B). SOX2 mRNA was
highly downregulated in 2102Ep cells, while in NTera-2 cells 49% reduced mRNA expression was reported. However, subsequent protein analysis showed that the SOX2 protein expression was completely eliminated, confirming successful knock-down.
As shown in Figure 1C, distinct changes in cell mor-phology were recorded in 2102Ep and NTera-2 cells three days after siSOX2 transfection compared to cells transfected with a non-targeting siRNA control. For both
cell lines, the cells had a flatter and larger appearance. They were also more evenly dispersed in monolayers, which differed from their normal, undifferentiated phe-notype as densely packed colonies. This phenotypic change is characteristic of ECC differentiation.
We profiled miRNA expression using high-throughput quantitative real-time PCR (qRT-PCR) arrays in 2102Ep and NTera-2 cells three days after transfecting them with siSOX2 or a non-targeting, scrambled siRNA
P = 0.028 20 40 60 80 100 120 140 Expression (%) 2102Ep NTera-2 siSOX2 NC siSOX2 siSOX2 siSOX2 NC SOX2
A
B
C
2102Ep NTera-2 NTera-2 2102Ep GAPDH SOX2 GAPDH NC VC NTC NC P < 0.0001Figure 1 Knock-down of SOX2 in 2102Ep and NTera-2 cells. The induced RNAi of SOX2 mRNA by SOX2 siRNA (siSOX2) facilitated a substantial and significant down-regulation of this gene’s expression in the EC cell lines. (A) As determined by qRT-PCR, very little SOX2 mRNA expression remains (6.5%) in siSOX2-transfected 2102Ep cells, while the remaining expression in siSOX2-transfected NTera-2 cells is higher (48.5%). SOX2 expression was compared to that in cells transfected with a scrambled, non-targeting siRNA (NC), which was set at 100%. SOX2 expression was normalised to GAPDH expression. All experiments were performed in biological triplicate. (B) As determined by Western blot, no SOX2 protein could be detected in the siSOX2-transfected cells of either cell line when compared to the non-targeting siRNA-transfected controls (NC), vehicle controls (VC) or non-transfected controls (NTC). GAPDH protein expression was measured to account for equal loading and transfer. (C) RNAi phenotypes of 2102Ep and NTera-2 cells, four days after SOX2 siRNA transfection. SOX2-silenced EC cells have a flattened, enlarged and more dispersed morphology, compared to SC-transfected cells, which are, similarly to untreated cells (not shown), small, defined and grown in dense colonies.
control. This experiment tested the expression of 754 validated miRNAs, covering the majority of the Sanger miRBase v14 miRNA database [44]. From this set of
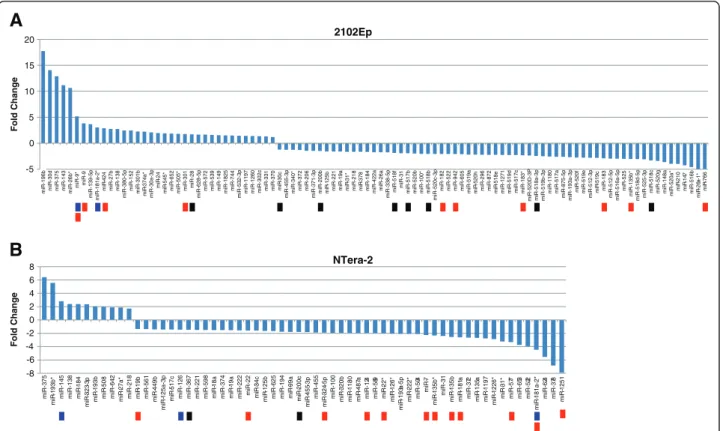
miRNAs, 99 and 62 miRNAs were significantly (P≤
0.05) deregulated in 2102Ep and NTera-2 cells respect-ively (Figure 2 and Additional file 1: Table S1). These in-clude the minor strand (star,‘*’) miRNAs, which have increasingly been attributed with biological functions. The large majority of differentially expressed miRNA in both cell lines were downregulated, suggesting that SOX2 is predominantly a transcriptional activator of miRNAs in hECCs.
14 miRNAs were mutually deregulated (mir-1180, −125b, −135b*, −138, −19a, −221, −31, −31*, −372, −375, −378, −455-3p, −517c, −522), of which four were mutually deregulated by over 2-fold each (miR-135b*, −138, −375, −522). Another four miRNAs were oppositely regulated (miR-1197,−miR-181a-2*, −184, −218), with miR-181a-2* showing a large difference between 2102Ep (up) and NTera-2 cells (down). These results will be further de-tailed in following paragraphs.
Many deregulated miRNAs in 2102Ep and NTera-2 cells after SOX2 knock-down have previously reported oncogenic or tumour suppressive functions. In addition, many are actors in the maintenance of stem cell pheno-types or guide embryonic development and differentiation. We cross-analysed the deregulated miRNAs in both hECC lines with hESC miRNA data from Stadler et al. and the miRCancer database, a curated repository of oncomiRs and tumour suppressor miRNA [45,46]. Table 1 contains a summary of deregulated miRNAs that have roles in can-cer and also are enriched in hESCs or are differentially expressed during early hESC differentiation. This demon-strates great overlap of the deregulated miRNAs in our dataset and many miRNAs involved in cancer and stem cell biology.
We also compared the miRNA profiles of the 2102Ep and NTera-2 cell lines in their native, undifferentiated state. This comparison produced 213 differentially regu-lated miRNA when both datasets are normalised to their respective global mean miRNA expression (Additional file 2: Table S2). This substantial difference in miRNA
-5 0 5 10 15 20 7 1* Fold Change -8 -6 -4 -2 0 2 4 6 8 p 3p 5p a 4 9 5p 4 7 a 2 a 7 3 2 4 8 Fold Change
A
B
2102Ep NTera-2Figure 2 Differential expression of miRNA in 2102Ep and NTera-2 cell lines after induced SOX2 silencing. Total number of all significantly (P≤ 0.05) deregulated miRNA three days after SOX2 knock-down in 2102Ep (A) and NTera-2 cells (B) normalised to the respective miRNA expression in cells transfected with a non-targeting control. 99 and 62 miRNAs were deregulated in 2102Ep and NTera-2 cells respectively. Both charts visualise a substantial bias towards miRNA downregulation after the knock-down of SOX2. These charts represent the mean expression values across three biological replicates. Blue markers indicate miRNAs that form an autoregulatory loop with SOX2. Black markers indicate miRNAs found to be significant master regulators of differential gene expression in hECCs. Red markers indicate miRNAs with SOX2 binding sites in their promoters as found in this study.
expression profiles could contribute to the divergence of differential miRNA expression profiles in 2102Ep and NTera-2 cells after SOX2 knock-down.
Statistical identification of an enriched miRNA regulatory signature reveals the regulation of EMT-related genes
Current research has primarily focused on the direct ac-tion of SOX2 on its transcripac-tional target genes in the context of pluripotency, differentiation and cancer. To expand the picture of SOX2 regulation beyond this, we intended to identify SOX2-linked miRNAs that conferred a significant regulatory signature on the dif-ferential gene expression profile in hECCs after SOX2 knock-down.
For this approach, genome-wide gene expression ar-rays were used to generate differential gene expression profiles of the 2102Ep and NTera-2 cells from the same SOX2 knock-down samples used for miRNA profiling analysed against the same non-targeting control samples. All genes that were significantly ≥2-fold up or downreg-ulated were included in further analysis and can be found in Additional file 3: Table S3. Using a Monte Carlo simulation algorithm combined with the miRNA target-prediction software, TargetScan 6.0, we analysed the gene expression data to identify deregulated miRNAs that target significantly more of the oppositely deregu-lated genes than would be expected by chance. This stat-istical method has previously been successfully applied
Table 1 Deregulated oncogenic or tumour suppressive miRNAs in 2102Ep and NTera-2 cells with an upregulated or downregulated profile in undifferentiated or differentiated hESC data from Stadleret al. [45]
2102Ep hESC undifferentiated hESC differentiated
OncomiR Downregulated miR-519c Upregulated Downregualted
miR-19a miR-519d miR-24 miR-26a
miR-512-5p miR-520a* miR-31
miR-517a miR-520b miR-125b
miR-517b miR-520f mir-182
miR-517c miR-520 g miR-221
miR-518b miR-520 h
miR-518f miR-525
Tumour Suppressor miRNA Downregulated Upregulated Downregulated
miR-148a miR-424 miR-26a
miR-27b miR-31
miR-28 miR-125b
miR-30d miR-149 miR-331
NTera-2 hESC undifferentiated hESC differentiated
OncomiR Downregulated Upregulated Downregulated
miR-18a miR-193b miR-22
miR-19a miR-125b
miR-19b miR-221
miR-367 miR-222
miR-374 miR-517c
Tumour Suppressor miRNA Upregulated Downregulated
miR-145 miR-22
miR-193b miR-31
miR-125b miR-34c The individual titles‘Downregulated’ and ‘Upregulated’ indicate the differential expression of each miRNA after SOX2 knock-down in either 2102Ep or NTera-2 cell lines or both.
to identify specific miRNAs as ‘master regulators’ of one-carbon metabolism-linked genes and lipid metabol-ism genes [47,48].
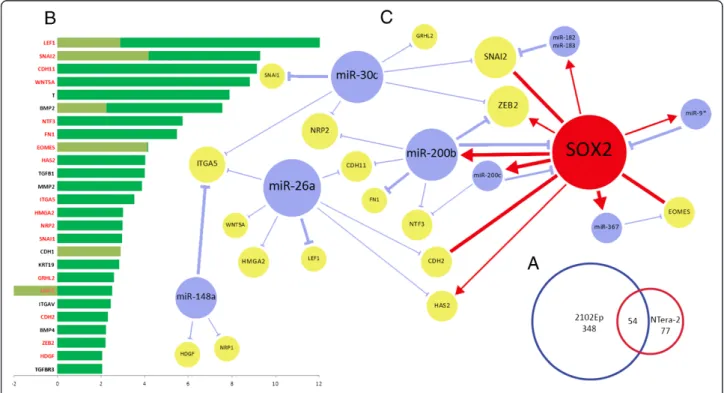
Whole-genome profiling revealed the deregulation of 402 genes in 2102Ep cells and 131 genes in NTera-2 cells, with 54 commonly deregulated genes between the two cell lines (Figure 3A and Additional file 3: Table S3). Gene ontology analysis revealed, particularly in 2102Ep cells, the deregulation of many markers of embryonic development, early tissue morphogenesis, cell differenti-ation and respective pathways involved, such as the Wnt pathway (Additional file 4: Table S4) [49]. An expected feature was the upregulation of 26 functional markers of mesodermal differentiation and EMT (see Figure 3B), with the exception of NRP1 in NTera-2 cells, which was downregulated in this cell line, but upregulated in 2102Ep cells. Previous evidence demonstrates the induc-tion of EMT and the acquisiinduc-tion of neural crest cell traits in hESCs after SOX2 knock down and the central roles of SOX2 in this type of cell fate determination have
been previously suggested [22,50]. This phenotypic change is particularly evident in 2102Ep cells, which produced more altered markers than NTera-2 cells. In cancer, EMT is a process of transdifferentiation by which epithelial cells lose their cell-cell adhesion and adopt a migratory mesenchymal phenotype enabling them to metastasise to other tissues. Unexpectedly, some established EMT inhibitors were upregulated in NTera-2 (CDH1/E-cadherin) and 2102Ep cells (KRT19 and HAS2) [51,52]. This observation will be further touched upon in the Discussion section. Among the 26 EMT markers, SNAI2/Slug and CDH2/N-cadherin have been previously shown to be transcriptionally activated by SOX2 during Type 3 and Type 1 EMT respectively. In our data, these genes are upregulated after SOX2 knock-down, suggesting an opposite transcriptional rela-tion to SOX2 [10,53]. On the other hand, T/Brachyury and EOMES were previously found to be repressed by SOX2 in Type 1 EMT, which is in concordance with our findings [54,55].
Figure 3 EMT-specific miRNA-target relationships directly and indirectly regulated by SOX2 in 2102Ep and NTera-2 cells. (A) This Venn diagram displays the exclusive and mutual expression of all≥2-fold up or downregulated genes in 2102Ep and NTera-2 cells after SOX2 knock-down. Excluded from the mutual group were the four oppositely deregulated genes. As shown, despite a large overlap between the two cell lines,
significantly more genes were deregulated in 2102Ep cells than NTera-2 cells. (B) This chart displays the expression levels of all 26 EMT genes differentially expressed in 2102Ep and NTera-2 cells combined. Those denoted in red are targets of the 11 miRNAs in Table 2 as predicted by our analysis. Several of these were previously validated. Together with SOX2 these miRNAs and targets form a complex network of EMT regulation (C). The EMT network compiled from predicted miRNA and gene interaction data from this study and previously established interactions. The thick arrows represent previously validated functional relationships, which include those predicted by this study, while the thin arrows are novel relationships predicted by this study alone. Red arrows represent transcriptional control by SOX2. Stripes without arrowheads or bars represent the previously validated transcriptional activation by SOX2 of genes that could be transcriptionally inhibited by SOX2 in our study. SOX2 binding sites were also found in the promoter regions of HAS2 and ZEB2 as per the ChIP data from Lister et al. and Boyer et al. [11,12].
We performed Monte Carlo analysis on the 2102Ep and NTera-2 differential gene expression datasets and cross-referencing with the results with the differential miRNA expression results revealed 10 miRNAs in 2102Ep cells (mir-26a, 28, 30c, 148a, miR-200b, miR-517b, miR-518a-3p, miR-518b, miR-518c, miR-518f )and two miRNAs in NTera-2 cells (miR-200c and miR-367) to be potential master regulators of their inversely regulated target genes. Certain human miRNA families are broadly conserved across many vertebrate species, while the evolutionary conservation of others is limited to mammals or mammalian species of close common ancestry. The corollary is that poorly con-served miRNAs may bind to poorly concon-served target sites. To maximise the probability of identifying true miRNA targets we limited our scope to target sites of equal conservation to their respective miRNAs. While miR-26a, miR-30c, miR-148a, miR-200b, miR-200c and miR-367 are broadly conserved across vertebrate spe-cies, miR-28 is conserved only in mammals and miR-517b, miR-518f, miR-518b, miR-518c, miR-518a-3p, all as members of the C19MC polycistron, are found only in primates.
To identify high-probability gene targets we further fil-tered the results by microT-CDS and miRanda (August 2010 release) cross-analysis and removed any targets that were not predicted by either of these tools (2 cases) [56,57]. The results are found in Table 2 and with the added prediction scores in Additional file 5: Table S5.
The results reveal a combined set of 128 miRNA-target interactions with 85 unique genes potentially regulated by our significant set of miRNAs. Of these, 99 miRNA-target interactions are predicted by all three target prediction tools used in this study governing a high-confidence set of 75 unique genes, 19 of which have two or more high-confidence miRNA interactions. This portrays a dense network of interlinking miRNA-target regulation contain-ing many previously validated miRNA targets (expressed in bold in Table 2) and many potentially new targets.
Many genes related to EMT pathways were found to be regulated by several differentially expressed miRNAs. Of these, members of the miR-200 family have been the most extensively studied in this context [72]. We discovered that a group of 11 miRNAs in Table 2, all of which were downregulated, could target 14 differentially expressed EMT-related genes from both cell lines combined. Four of these miRNAs, 200b, 200, 30c and miR-148a, are established inhibitors of EMT and metastasis by targeting ZEB1 and ZEB2 (miR-200b/200c), TWF1 and VIM (miR-30c) and mesenchymal-to-epithelial transition (MET) (miR-148a) [68,73,74]. Additionally, miR-26a has targets that were verified in non-EMT studies, but which have independently established functions in EMT and me-tastasis. These include HMGA2 and LEF1 (miR-26a) [60,62,75]. Figure 3C illustrates a network of validated and novel SOX2-miRNA-target interactions found in this study. Some of these interactions are further detailed in the Discussion section.
Table 2 Significantly represented miRNAs in 2102Ep and NTera-2 data with their associated targets
Cell line miRNA Fold change Targets
2102Ep
miR-148a −3.63 ARRDC3 [58], ATP2B4, CHD7, ELMO1, FAM123B, H2AFY, HDGF, HMGA2, IL6ST,
ITGA5 [59],ITGB8 [59], LIX1, NRP1, PREX1, TEAD1, TMEM54
mir-26a −1.73 ADAM19, AMOT, CDH2, CDH11, CSNK1G1, ENC1, ENPEP, HAS2, HMGA2 [60],
HOXA5 [61], HOXA9, LHX1, ITGA5, ITGB8, LEF1 [62], LIFR, MAP2 [63], NID1, NRIP1, PLXNA2, PRTG, SSFA2, TFAP2A, USP3, WNT5A, ZSWIM6
miR-200b −1.48 AHNAK, ARRDC3, CDH11, CNKSR3, CNTFR, EFNA1 [64], EMP1, FN1 [65],
GATA2 [66], GLI3, HEG1, HOXA5, KIAA0101, MAP2, MBNL3, NKD1, NRIP1, NRP2, NTF3, PLXNA2, PRTG, ST6GALNAC5, TEAD1, TFAP2A [67], WWC3, ZEB2 [68]
miR-30c −1.23 ACTC1, ADAM19, ADAMTS9, AHNAK, CAMK2N1, CHD7, CSNK1G1, CYP24A1, ELMO1,
FAM123B, GRHL2, ITGA5, KIAA1024, LHX1, LIFR, MBNL3, NID1, NRIP1, NRP2, PLXNA2, PRTG, RARG, RASGRP3, RHOB, SNAI1 [69], SNAI2, TBL1X, TEAD1, TIMP3, ZEB2, ZSWIM6
miR-28 1.71 DPF1 , IQSEC2, PRUNE2
miR-517b −1.94 CACNG4, HOXA5, NKD1, PRTG, ZEB2, ZNF436
miR-518a-3p −2.47 FRAS1, IL13RA1, TEAD1, TGFBR3
miR-518b −2.06
miR-518c −3.33
miR-518f −1.87
NTera-2 miR-200c −1.80 AHNAK, CITED2, MBNL3, NTF3 [70], PLXNA2, PRTG, SEMA6D [71], YPEL2
miR-367 −1.46 ATP2B4, CADM2, EOMES, HAND1, MBNL3, PKDCC, SEMA6D, SESN3
Genes in bold are previously confirmed targets of their respective miRNAs which also showed up in our data. Genes in cursive style are predicted by TargetScan and either microT-CDS or miRanda (August 2010 Release). All other genes were predicted by all three prediction tools.
Meta-analysis of miRNAs with SOX2 binding sites in their promoter regions
To provide further insight into the miRNA transcrip-tome under direct control by SOX2, we cross-analysed our profiling data with existing genome-wide SOX2 ChIP data.
We first performed a meta-analysis of SOX2 transcrip-tion factor binding sites (TFBSs) in proximity of miRNA transcription start sites (TSSs). At the time of this study, no previously published SOX2 ChIP experiments were performed for hECC lines. Because of this we adopted a similar strategy used by Greber et al. and performed analysis with SOX2 ChIP data from hESCs as a substi-tute [23]. The assumption that SOX2 binds similar gen-omic loci in both hECCs and hESCs was based on the evidence supporting a phenotypic similarity between these cell types and further supported by functional studies which show that SOX2 has highly comparable roles in the maintenance and differentiation of these cell lines [23,76]. Some differences do exist between hECC and hESCs on the genetic and transcriptomic level, but current research accepts that this is limited to the ex-pression and alternative splicing of only a relatively small number of genes [77].
Two whole-genome hESC SOX2 ChIP datasets were included in the analysis; those previously published by Boyer et al., and Lister et al. [11,12]. Lister et al. per-formed ChIP-Seq of the whole genome, while Boyer et al. used a more limited ChIP-on-chip based method which covered the -8 kb to +2 kb genomic regions rela-tive to transcription start sites of 17,917 annotated genes.
Secondly, we compiled a list of TSSs from two re-sources: a dataset of miRNA TSSs identified by Bulik-Sullivan et al. and all host gene and miRNA TSSs from the miRStart database [78,79]. All miRNAs with SOX2 binding sites 5 kb upstream or downstream from their miRNA TSS and, where applicable, their host gene TSS, were compiled and included in further analysis.
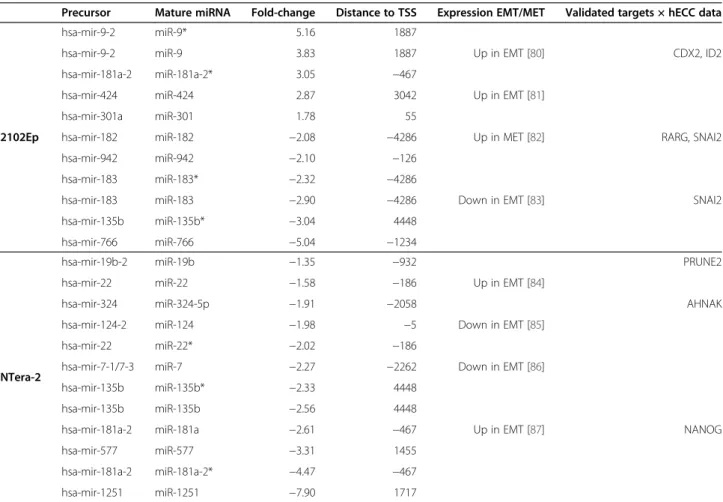
In total, 71 unique miRNA precursors were found to have one or more SOX2 binding sites (see Additional file 6: Table S6). We compared this set of miRNAs with all miRNAs that we found to be significantly down or up-regulated in the 2102Ep and NTera-2 cell lines. From this analysis, 11 deregulated mature miRNAs in 2102Ep cells and 12 in NTera-2 cells were found to have prox-imal SOX2 binding sites as shown in Table 3. In NTera-2 cells, all these miRNAs were downregulated, while in
Table 3 MiRNAs with SOX2-binding sites in hESCs which were deregulated in 2102Ep and NTera-2 cells
Precursor Mature miRNA Fold-change Distance to TSS Expression EMT/MET Validated targets × hECC data
2102Ep
hsa-mir-9-2 miR-9* 5.16 1887
hsa-mir-9-2 miR-9 3.83 1887 Up in EMT [80] CDX2, ID2
hsa-mir-181a-2 miR-181a-2* 3.05 −467
hsa-mir-424 miR-424 2.87 3042 Up in EMT [81]
hsa-mir-301a miR-301 1.78 55
hsa-mir-182 miR-182 −2.08 −4286 Up in MET [82] RARG, SNAI2
hsa-mir-942 miR-942 −2.10 −126
hsa-mir-183 miR-183* −2.32 −4286
hsa-mir-183 miR-183 −2.90 −4286 Down in EMT [83] SNAI2
hsa-mir-135b miR-135b* −3.04 4448
hsa-mir-766 miR-766 −5.04 −1234
NTera-2
hsa-mir-19b-2 miR-19b −1.35 −932 PRUNE2
hsa-mir-22 miR-22 −1.58 −186 Up in EMT [84]
hsa-mir-324 miR-324-5p −1.91 −2058 AHNAK
hsa-mir-124-2 miR-124 −1.98 −5 Down in EMT [85]
hsa-mir-22 miR-22* −2.02 −186
hsa-mir-7-1/7-3 miR-7 −2.27 −2262 Down in EMT [86]
hsa-mir-135b miR-135b* −2.33 4448
hsa-mir-135b miR-135b −2.56 4448
hsa-mir-181a-2 miR-181a −2.61 −467 Up in EMT [87] NANOG
hsa-mir-577 miR-577 −3.31 1455
hsa-mir-181a-2 miR-181a-2* −4.47 −467
2102Ep cells this transcriptional activity was mixed. Only miR-135b* and miR-181a-2* were commonly listed for both 2102Ep and NTera-2 cells. This signifies a dif-ference between the two hECC lines in response to SOX2 downregulation.
None of the miRNAs listed in Table 3 have been vali-dated before as transcriptional targets of SOX2, reveal-ing a novel network of miRNAs potentially directly regulated by SOX2 in pluripotent cells. In general, few miRNAs have so far been identified as direct transcrip-tional targets of SOX2 in human cells. Previous research efforts have focused on its regulation of the ESC-specific miR-302-367 cluster and recently SOX2 has been impli-cated in a direct negative feedback loop with the miR-200 family [88-90]. Despite the significant deregulation of 302c and 200b in 2102Ep cells and 200c and 367 in NTera-2 cells, none of these miR-NAs were identified as SOX2 transcriptional targets in our data. The false negative result for the miR-302-367 cluster can be explained by the absence of identifiable TSSs for this cluster. However, two SOX2 binding sites were found in a <2000 bp proximity of the miRNA pre-cursors, confirming previous reports. No SOX2 binding sites were in proximity to the TSSs of miR-200b and miR-200c as mapped by Boyer et al. and Lister et al.
A literature search revealed a substantial overlap of miRNAs potentially controlled by SOX2 as listed in Table 3 and miRNAs functionally linked to EMT or its counterpart, MET, in cancer or embryonic stem cell lines. Table 3 column‘Expression during EMT/MET’ in-dicates the direction of differential expression during EMT or MET. With the exception of 22 and miR-181a in NTera-2 cells, the differential expression of all miRNAs listed in Table 3 correspond with their reported expression during EMT or MET.
Additionally, with the aid of miRTarBase, a repository of validated miRNA-target interactions, genes deregu-lated in 2102Ep and NTera-2 cells after SOX2 knock-down were included as previously validated targets [91]. Only interactions validated with strong evidence (reporter assay, Western blot or qPCR) were included. Notably, SNAI2/Slug, an important EMT gene, is upregulated in 2102Ep cells, while its previously validated miRNAs, miR-182 and miR-183, are downregulated. Both miRNA are members of the same miR-183-96-182 cluster in the gen-ome. This potentially presents alternative route through which SOX2 controls SNAI2/Slug transcription (Figure 3C).
Discussion
SOX2 is a major pluripotency marker and oncogene. Al-though previous studies have addressed the SOX2 tran-scriptional profile of protein-coding genes in both hESCs and hECCs [11,12,23], no study has yet profiled the SOX2 miRNA profile in human pluripotent cells.
Successful previous attempts have mapped the direct transcriptional miRNA network of SOX2 in mouse ESCs and human GBM, but no integrated differential gene and miRNA expression analysis was performed and none exist in human pluripotent stem cells [1,26]. The basis of this study was to attempt such analysis and to provide a platform for future SOX2 and pluripotency-linked miRNA-target discovery and validation.
ECCs have been previously used as a model to study cancer stemness, ESCs and embryonic development [37,38,40,42,77,92]. As CSCs of embryonal carcinoma and teratocarcinoma, they have been subjects of cancer stemness studies, while their phenotypical similarities with ESCs have kept ECCs interesting to researchers who study embryonic development and ESC biology. Re-cently, these fields have converged in research which uti-lises ECCs as a model to investigate ESC and iPSC tumourgenicity and cancer cells expressing embryonic biomarkers [42,77,93].
MiRNA profiling after SOX2 knock-down reveals a distinct phenotypes in 2102Ep and NTera-2 cells
We profiled the differential expression of 754 miRNAs in two SOX2 knock-down ECC lines. To our best know-ledge, this is the first study to map a SOX2-linked miRNA network by a high-throughput method in human pluripo-tent cell lines. MiRNA profiling revealed the significant deregulation 99 and 62 unique mature miRNAs in 2102Ep and NTera-2 cells, of which only 18 were common be-tween these groups, with four miRNAs of this subset op-positely deregulated. The large difference in miRNA response to SOX2 knock-down signifies the phenotypic differences between the 2102Ep and NTera-2 cell lines which is further supported by the different miRNA pro-files between undifferentiated 2102EP and NTera-2 cells.
However, the miRNA profiles in both cell lines showed certain features expected in hESCs after SOX2 silencing. In 2102Ep cells, several ESC-specific miRNAs were down-regulated, most notably 28 members of the C19MC poly-cistron. In NTera-2 cells, this cluster is expressed, but only two of its miRNAs (miR-517c and miR-522) were downregulated. C19MC is located on chromosome 19q13.42 and conserved to primates only. In normal tis-sue, its miRNAs are specifically expressed in ESCs, ECCs and placental tissue. Although the precise function of C19MC is still quite elusive, its expression is rapidly lost during early ESC differentiation [94]. However, C19MC re-expresses in several cancer types and in particular em-bryonal brain tumours in which it activates an early devel-opmental program by driving global methylation changes [95]. The downregulation of C19MC after SOX2 knock-down in 2102Ep cells and its its apparent resistance to this in NTera-2 cells aligns the phenotype of the former cell line closer to that of hESC differentiation than the latter.
MiRNA profiling after SOX2 knock-down expands the autoregulatory network of core pluripotency factors
The differential expression of three miRNAs, miR-9*, miR-145 and miR-126, which have previously been vali-dated to target SOX2, suggests the possible existence of novel autoregulatory loops between SOX2 and miRNAs it directly or indirectly regulates. MiR-9*, which is up-regulated in 2102Ep (Figure 2A), and 145 and miR-126, which are upregulated and downregulated in NTera-2 respectively (Figure 2B), all have been validated to repress SOX2 [18,96-98]. While the downregulation of miR-126 points towards a negative feedback mechan-ism, the upregulation of miR-9*, which has a proximal SOX2 binding site in its promoter region (Table 3), and miR-145 indicates the existence of positive feedback loops. In fact, Fang et al., who found similar deregula-tion of miR-145 upon the knock down of SOX2 in GBM cells, proposed this association [1].
Expanding these autoregulatory networks beyond the direct targeting of SOX2 reveals additional regulatory connections between SOX2-targeted miRNAs (Table 3) and regulators of SOX2 expression. The pluripotency factor NANOG reciprocally induces SOX2 expression and both can cooperatively enhance their own expres-sion in stem cells, including ESCs, ECCs and CSCs [99,100]. As expected, NANOG was similarly downregu-lated in both ECC lines in this study. In hematopoietic stem cells, miR-181a-2*, a member of the miR-181 fam-ily and deregulated in both 2102Ep and NTera-2 cells, can directly target NANOG [101]. The expression of the miR-181 family increases during early hESC differenti-ation and has previously been identified as regulators of stem cell differentiation, including that of hESCs and CSCs [102-105]. We found that the miR-181a/-2a* pre-cursor contains a SOX2 binding site in close proximity to its TSS (Table 3), suggesting its direct regulation of these miRNAs. MiR-181a-2* was upregulated in 2102Ep cells, while its complement strand miR-181a was simi-larly upregulated just outside the minimal threshold of statistical significance (not shown). If miR-181a-2* tar-gets NANOG during 2102Ep differentiation, this would present an alternative mechanism of NANOG regula-tion by SOX2 in this ECC line, and possibly other cell lines.
Integrated analysis reveals a distinct EMT miRNA-target regulatory network
From a statistical cross-analysis of miRNA and gene pro-filing data we identified 12 miRNAs that controlled a combined set of 85 deregulated genes, of which 75 were predicted by three computational target prediction tools. This set was enriched with a subgroup of 17 genes in-volved in EMT (Figure 3C). SOX2 has recently been dir-ectly linked to EMT and metastasis in cancer, and as an
oncogene is considered to be a promoter of EMT during disease progression [3,106-108]. Although the precise mechanisms by which SOX2 contributes are still quite elusive, its cancer stem cell regulatory and EMT func-tions probably overlap. So far, one study found that its transcriptional regulation of the Wnt/β-catenin pathway was a contributing factor [108]. Recent evidence sug-gests that EMT could attribute to the generation of CSCs, possibly further implicating SOX2 in a network of tumorigenesis and progression though its expression in a cancer cell subpopulation [109,110].
From our results we present an expanded network of miRNA interactions, directly and indirectly regulated by SOX2, that could govern EMT during embryonic devel-opment and in CSCs. The significant representation of known and putative miRNA inhibitors of EMT with vali-dated EMT targets (200b, 200c, 30c, miR-148a and miR-26a) provides functional significance to the wider SOX2-regulated miRNA-target network re-vealed in this study. Furthermore, independent from the statistical target analysis, miR-9/9*, a highly charac-terised promoter of EMT and upregulated in 2102Ep cells, has a SOX2-binding site in its promoter region (Table 3), further revealing a SOX2-linked miRNA EMT network [80].
This network includes highly characterised mesenchy-mal markers such as ZEB2, LEF1, FN1 (fibronectin), CDH2 (N-cadherin), SNAI1 (Snail) and SNAI2 (Slug). Nearly all genes in this upregulated group of genes are promoters or effectors of EMT. The exception is CDH1/ E-cadherin in NTera-2 cells, which normally downregu-lates during EMT, while it is upregulated in our dataset. The latter cannot be fully explained without further ex-perimentation. Overall, the results demonstrate a miRNA link between SOX2 and EMT-related genes in 2102Ep cells. In a recent study, Cimadamore et al. demonstrate that the differentiation of hESCs to sensory neurons rely on a transient up- and downregulation of SOX2 expres-sion [22]. SOX2 expresexpres-sion reduces during the initial dif-ferentiation and EMT of hESCs to neural crest cells after which SOX2 is re-expressed during the differentiation of these cells towards neuronal progenitors. The induction of EMT genes in 2102Ep cells represent the first phase of this differentiation program and the detailed network of miRNA-target interactions we present in our study could assist this process. Furthermore, despite their pluripo-tency, NTera-2 cells appear have a limited capacity of undergoing this transformation or perhaps represent a more progressed phenotype along this differentiation pro-gram as suggested by the upregulation of CDH1/E-cad-herin and the downregulation of NRP1. The induction of a combined gene and miRNA EMT programme by SOX2 knock-down in 2102Ep cells suggest the activation of a form of Type 1 EMT.
MiRNA promoter analysis links SOX2 transcriptional function to validated EMT miRNAs
The characterisation of a miRNAs with SOX2 binding sites in their promoter region yielded a subset of deregu-lated miRNAs in 2102Ep and NTera-2 that are highly probable to be transcriptionally regulated by SOX2. 9 miRNAs have been previously validated as functional ac-tivators or inhibitors of EMT or MET. In 2102Ep cells, inhibitors of EMT, miR-9 and miR-424, and an activator of MET, miR-182, are all upregulated. Conversely, an in-hibitor of EMT, miR-183, is downregulated. This further supports the hypothesis of SOX2 as a regulator and an inhibitor of Type 1 EMT in 2102Ep cells. In NTera-2 cells, miR-124-3p, miR-7, miR-22 and miR-181a are downregulated. However, only miR-124-3p and miR-7 are inhibitors of EMT, while miR-22 and miR-181a are activators. As indicated by the differential expression of certain genes in NTera-2 cells, this could be representa-tive of a more progressed phenotype. This has been sug-gested before, for despite their pluripotent nature, NTera-2 cells appear to be intrinsically primed towards neural differentiation, a process also governed by SOX2 [22,111,112]. Unbiased screening of the miRNAs in Table 3 with validated targets from miRTarBase yielded only few genes that were deregulated in 2102Ep and NTera-2 cells. It is possible that functional response of targets of these miRNAs is delayed or that these miRNAs confer their functionality through translational repres-sion. Furthermore, curated databases such as miRTarBase only represent a fraction of the results in the literature and, as such, several validated targets may been missed.
A direct association between master regulator miR-NAs (Table 2) and miRmiR-NAs with SOX2 binding sites in their promoter regions (Table 3) could not be found. This may be due to the high stringency of statistical ap-proach to identifying master regulator miRNAs taken in this study rather than an alternative SOX2 binding pro-file to miRNA promoter regions. Despite this, the master regulators, miR-200b, miR-200c and miR-367, have been previously established transcriptional targets of SOX2, indicating that this transcription factor could have a large influence on the targets of these miRNAs through their genomic regulation [88-90].
Conclusion
In this study we profiled the SOX2-linked miRNAome and its associated regulatory network in pluripotent and nullipotent cancer stem cells. The findings add to a growing body of results that map the cell and context specific multifunctionality of SOX2 in the maintenance and direction of stem cell phenotypes. The results pre-sented in this study suggest a miRNA link between SOX2 and Type 1 EMT markers in the 2102Ep ECC line. The apparent role of SOX2 as an inhibitor of EMT
during embryonic development is opposite of its role as a promoter EMT in metastatic neoplasms, even though many of the same miRNAs are involved. Future research could further and individually validate the presented miRNAs and targets in relation to SOX2-linked EMT, embryonic development and cancer.
Methods
Cell culture and functional transfections
For this study we compared two hECC lines; 2102Ep and NTera-2 (kind gifts from Prof. Peter Andrews, Uni-versity of Sheffield). These cell lines have a high turn-over and remain in an undifferentiated state at high density. The cells were grown in growth medium contain-ing high-glucose DMEM supplemented with 10% FCS and 2% penicillin-streptomycin (Lonza, Switzerland). For ex-perimentation, six-well plates were seeded 24 hours prior to oligonucleotide transfection in growth medium without antibiotics. This study did not involve human samples or data and as such did not require ethical approval.
SOX2 knock-down was performed with a pre-designed Silencer® Select siRNA (s13295, Life Technologies, USA) with a sense sequence of AGUGGAAACUUUUGUCG GATT and an anti-sense sequence of UCCGACAAAA GUUUCCACUCG. In NTera-2 cells, functional trans-fections were performed as per manufacturers’ protocols with 30 nM siRNA and Lipofectamine® RNAiMAX® (Life Technologies, USA). For 2102Ep cells, 15 nM siRNA with Lipofectamine ® 2000 (Life Technologies, USA) was suffi-cient. As a negative control, samples transfected with the non-targeting siRNA, Silencer® Select Negative Con-trol #1 were included. Vehicle conCon-trols, absent of any siRNA, and non-transfected controls, absent of any transfection agent or siRNA, were also included to test the effects of the transfection components. The cells were forward transfected in a serum-free medium con-taining Opti-MEM® I, transfection agent and siRNA for 6 hours at 37°C. The medium was replaced with normal growth medium and the cells were incubated in appro-priate conditions for 72 hours with a daily medium re-fresh after which the cells were harvested for Western blot and RNA expression analysis.
Validation of SOX2 knock-down
Successful knock down of SOX2 by siRNA was assessed by measuring relative mRNA and protein levels with qRT-PCR and Western blot respectively. Briefly, total RNA and protein samples were isolated and purified from the cells using the miRVANA® PARIS system (Ambion, USA). MRNA expression was determined using the the TaqMan® qRT-PCR system (Applied Bio-systems, USA) as per manufacturer’s protocols. Relative quantification with the 2-ΔΔCtmethod, as summarised by Livak and Schmittgen [113], was used to compare mRNA
expression in the functional samples compared to the negative controls. Primer/probe pairs were used to meas-ure the expression of SOX2 (Hs00602736_s1, Applied Bio-systems, USA) and an endogenous normalisation control, GAPDH (4331182, Applied Biosystems, USA). The RNA samples were used for down-stream gene and miRNA analysis. Western blot was performed with standard methods, using the enhanced chemiluminescence devel-oped previously by Haan and Behrmann [114]. For prob-ing, primary antibodies were used against SOX2 (ab75485, AbCam, UK)and the endogenous normalisation control, GAPDH (ab8245, AbCam, UK).
MicroRNA expression analysis
Whole-miRNAome analsysis was performed with the TaqMan® Array Human microRNA system (Applied Bio-systems, USA)as per manufacturer’s protocols. This pro-vided a high-throughput method to quantitatively screen the expression of 754 unique miRNAs, covering the broad majority of human miRNAs in the Sanger miR-Base v14 miRNA database [44]. For this, cDNA prepared from the sample RNA underwent qRT-PCR on a pair of 384-well plates containing lyophilised primer/probe pairs. Three biological replicates were analysed for both func-tional and negative control samples. To enhance the de-tection of low-concentration miRNAs, a pre-amplification step was included using the TaqMan PreAmp Master Mix with the Megaplex PreAmp Primers (Applied Biosystems, USA). The manufacturer’s DataAssist 3.0 software was used to batch-analyse the expression results. MiRNAs that were deregulated with a P-value of≤0.05 were included in the final dataset.
Gene array analysis
The Affymetrix GeneChip Human Gene 1.0 ST array platform was used to study the differential expression of 28,132 transcripts. RNA integrity was measured with the 2100 Bioanalyzer microfluidics station (Agilent, USA) ac-cording to manufacturer’s protocols. The preparation and labelling of sense cDNA was performed to manufac-turers’ protocols with the WT Expression Kit (Ambion,
USA) and the GeneChip WT Terminal Labeling kit
(Affymetrix, USA). Hybridisation, washing and staining was performed with Hybridization, Wash and Stain Kit (Affymetrix, USA). Scanning and quality control analysis was performed on the GeneChip Scanner 3000 7G (Affy-metrix, USA)with the manufacturer’s propriety software using the robust multi-array average analysis. Three bio-logical replicates were performed with both the func-tional and negative control samples. Computafunc-tional expression analysis was performed using the open-source R (CRAN) package, Bioconductor 2.9 with the limma (Linear Models for Microarray Data) add-on [115]. Gene array results were subsequently validated
with qRT-PCR. To reduce the chance of false positive results from downstream analysis, differentially ex-pressed genes included in the final dataset were those that were ≥2-fold deregulated with a P-value of ≤0.01 and false discovery rate value of≤0.05.
Gene and miRNA annotation analysis and network mapping
To categorise genes by function, we primarily performed gene ontology analysis using DAVID Bioinformatics Re-sources 6.7 [49]. On significant findings from DAVID and on unannotated genes we performed further litera-ture searches for gene functionality using a defined list of MeSH terms which included those related to ESCs, EC cells, CSCs, differentiation, embryonic development, EMT and cancer. Figure 3C was compiled from miRNA-target interactions and SOX2 binding sites predicted in this study. Figure 3C was further enriched with previ-ously validated transcriptional and post-transcriptional interactions between miRNAs, EMT genes and SOX2 as described in Table 2, Table 3 and the text.
Integrated gene and miRNA cross-analysis
To find a functionally enriched set of miRNAs that are predicted to target the set of significantly deregulated genes, we adapted a Monte Carlow algorithm previously successfully used by Stone et al. and Bulik-Sullivan et al. [47,79]. Briefly, genes with at least one miRNA target site in TargetScan 6.0 were randomly selected from the human genome. The number of random genes selected was equal to the size of each group of upregulated or downregulated genes in 2102Ep and NTera-2 cells. From this set the number of genes that each human miRNA in the TargetScan 6.0 database was predicted to target was calculated. From this a weighted score was calculated based on the number of predicted target site per 3′UTR, the distance between target sites and the type of pre-dicted hybridisation. This simulation was repeated 10,000 times to calculate a background distribution of the number of genes each human miRNA is predicted to target. This distribution was subsequently used to calcu-late an empirical p-value for the predicted number of upregulated or downregulated target genes in 2102Ep and NTera-2 cells. To account for the differences in average 3′UTR length between these four groups and their respective groups of randomly selected genes, the number of predicted target genes was normalised against the average 3′UTR length of the randomly selected genes. To establish additional confidence in the prob-ability of the generated miRNA-target interactions, all miRNAs were further screened for their targets using the microT-CDS and miRanda (August 2010 release) computational target prediction tools [56,57]. For
‘medium-good’ setting according to the authors), while for mi-Randa a mirSVR maximum of ≥0.1 (a ‘good’ setting ac-cording to the authors) was applied.
Supporting data
The data sets supporting the results of this article are in-cluded within the article and its Supplementary Tables.
Additional files
Additional file 1: Table S1. Differentially regulated miRNAs in 2102Ep and NTera-2 cells. All differentially regulated miRNAs after SOX2 knock-down in 2102Ep and NTera-2 cells.
Additional file 2: Table S2. MiRNA expression in undifferentiated NTera-2 cells compared to undifferentiated 2102Ep cells. All differentially regulated miRNAs between the two hECC cell lines in their undifferentiated, unaltered state.
Additional file 3: Table S3. Genes deregulated in 2102Ep and NTera-2 cells after SOX2 knock-down. All genes differentially regulated in 2102Ep and NTera-2 cells three days after SOX2 knock-down. Including a table with genes deregulated in both cell lines.
Additional file 4: Table S4. DAVID Bioinformatics Resources 6.7 Output for 2102Ep and 2102Ep cells. Gene annotation analysis of all deregulated genes in 2102Ep and NTera-2 cells by DAVID Bioinformatics Resources 6.7. Additional file 5: Table S5. Predicted miRNA-target interactions by master regulator miRNAs. Master regulator miRNAs and their targets as predicted by our statistical analysis and further enhanced by microT-CDS and miRanda prediction with prediction scores included.
Additional file 6: Table S6. MiRNAs with proximal SOX2 TFBSs. All miRNAs with TSSs close to SOX2 TFBSs as defined by the criteria outlined in the study. The table includes miRNA TSS coordinates and SOX2 TFBS coordinates.
Abbreviations
ChIP:Chromatin immunoprecipitation; ChIP-seq: ChIP-sequencing; CSC: Cancer stem cell; ECC: Embryonal carcinoma cell; EMT: Epithelial-to-mesenchymal transition; ESC: Embryonic stem cell; GBM: Glioblastoma multiforme; hECC: Human embryonal carcinoma cell; hESC: Human embryonic stem cell; iPSC: Induced pluripotent stem cells; MET: Mesenchymal-to-epithelial transition; NC: Non-targeting siRNA; NTC: Non-transfected control; oncomiR: Oncogenic miRNA; qRT-PCR: Quantitative real-time PCR; siSOX2: SOX2 siRNA; SOX: SRY-related HMG-box; TFBS: Transcription factor binding site; TSS: Transcription start site; VC: Vehicle control.
Competing interests
The authors declare that they have no competing interests.
Authors’ contribution
SFV participated in study design and coordinated the study, performed gene knock-down experiments, profiling experiments, participated in genomic analysis, drafted the manuscript and generated conclusions. PS performed bioinformatic cross-analysis and participated in genomic analysis. GB performed bioinformatic analysis of gene arrays. CS aided in gene and microRNA array experiments. SB participated in gene knock-down experiments. OS participated in study design. MFG and JJOL participated in study design and helped draft the manuscript. All authors read and approved the final manuscript.
Acknowledgements
Professor Peter Andrews, Department of Biomedical Science, University of Sheffield for kindly providing the cell lines used in this study.
This study has been funded by a Cancer Research Ireland grant from the Irish Cancer Society.
Author details
1
Department of Histopathology, Trinity College Dublin, Sir Patrick Dun Research Laboratory, St. James’s Hospital, Dublin, Ireland.2The Coombe
Women and Infants University Hospital, Dublin, Ireland.3Department of Genetics, University of North Carolina at Chapel Hill, Chapel Hill, North Carolina, USA.
Received: 12 January 2014 Accepted: 15 July 2014 Published: 25 August 2014
References
1. Fang X, Yoon J-G, Li L, Yu W, Shao J, Hua D, Zheng S, Hood L, Goodlett DR, Foltz G, Lin B: The SOX2 response program in glioblastoma multiforme: an integrated ChIP-seq, expression microarray, and microRNA analysis. BMC Genomics 2011, 12:11.
2. Fang X, Yu W, Li L, Shao J, Zhao N, Chen Q, Ye Z, Lin S-C, Zheng S, Lin B: ChIP-seq and functional analysis of the SOX2 gene in colorectal cancers. OMICS 2010, 14:369–384.
3. Han X, Fang X, Lou X, Hua D, Ding W, Foltz G, Hood L, Yuan Y, Lin B: Silencing SOX2 induced mesenchymal-epithelial transition and its expression predicts liver and lymph node metastasis of CRC patients. PLoS One 2012, 7:e41335.
4. Clark AT: The stem cell identity of testicular cancer. Stem Cell Rev 2007, 3:49–59.
5. Girouard SD, Laga AC, Mihm MC, Scolyer RA, Thompson JF, Zhan Q, Widlund HR, Lee C-W, Murphy GF: SOX2 contributes to melanoma cell invasion. Lab Invest 2012, 92:362–370.
6. Mak VCY, Siu MKY, Wong OGW, Chan KKL, Ngan HYS, Cheung ANY: Dysregulated stemness-related genes in gynecological malignancies. Histol Histopathol 2012, 27:1121–1130.
7. Liu K, Lin B, Zhao M, Yang X, Chen M, Gao A, Liu F, Que J, Lan X: The multiple roles for Sox2 in stem cell maintenance and tumorigenesis. Cell Signal 2013, 25:1264–1271.
8. Masui S, Nakatake Y, Toyooka Y, Shimosato D, Yagi R, Takahashi K, Okochi H, Okuda A, Matoba R, Sharov AA, Ko MSH, Niwa H: Pluripotency governed by Sox2 via regulation of Oct3/4 expression in mouse embryonic stem cells. Nat Cell Biol 2007, 9:625–635.
9. Ivanova N, Dobrin R, Lu R, Kotenko I, Levorse J, DeCoste C, Schafer X, Lun Y, Lemischka IR: Dissecting self-renewal in stem cells with RNA interference. Nature 2006, 442:533–538.
10. Sun C, Sun L, Li Y, Kang X, Zhang S, Liu Y: Sox2 expression predicts poor survival of hepatocellular carcinoma patients and it promotes liver cancer cell invasion by activating Slug. Med Oncol 2013, 30:503. 11. Boyer LA, Lee TI, Cole MF, Johnstone SE, Levine SS, Zucker JP, Guenther MG,
Kumar RM, Murray HL, Jenner RG, Gifford DK, Melton DA, Jaenisch R, Young RA: Core transcriptional regulatory circuitry in human embryonic stem cells. Cell 2005, 122:947–956.
12. Lister R, Pelizzola M, Dowen RH, Hawkins RD, Hon G, Tonti-Filippini J, Nery JR, Lee L, Ye Z, Ngo Q-M, Edsall L, Antosiewicz-Bourget J, Stewart R, Ruotti V, Millar AH, Thomson JA, Ren B, Ecker JR: Human DNA methylomes at base resolution show widespread epigenomic differences. Nature 2009, 462:315–322.
13. Takahashi K, Yamanaka S: Induction of pluripotent stem cells from mouse embryonic and adult fibroblast cultures by defined factors. Cell 2006, 126:663–676.
14. Sperger JM, Chen X, Draper JS, Antosiewicz JE, Chon CH, Jones SB, Brooks JD, Andrews PW, Brown PO, Thomson JA: Gene expression patterns in human embryonic stem cells and human pluripotent germ cell tumors. Proc Natl Acad Sci U S A 2003, 100:13350–13355.
15. Kashyap V, Rezende NC, Scotland KB, Shaffer SM, Persson JL, Gudas LJ, Mongan NP: Regulation of stem cell pluripotency and differentiation involves a mutual regulatory circuit of the NANOG, OCT4, and SOX2 pluripotency transcription factors with polycomb repressive complexes and stem cell microRNAs. Stem Cells Dev 2009, 18:1093–1108.
16. Otsubo T, Akiyama Y, Yanagihara K, Yuasa Y: SOX2 is frequently downregulated in gastric cancers and inhibits cell growth through cell-cycle arrest and apoptosis. Br J Cancer 2008, 98:824–831.
17. Li X-L, Eishi Y, Bai Y-Q, Sakai H, Akiyama Y, Tani M, Takizawa T, Koike M, Yuasa Y: Expression of the SRY-related HMG box protein SOX2 in human gastric carcinoma. Int J Oncol 2004, 24:257–263.
18. Otsubo T, Akiyama Y, Hashimoto Y, Shimada S, Goto K, Yuasa Y: MicroRNA-126 Inhibits SOX2 Expression and Contributes to Gastric Carcinogenesis. PLoS One 2011, 6:e16617.
19. Bartel DP: MicroRNAs: genomics, biogenesis, mechanism, and function. Cell 2004, 116:281–297.
20. Gunaratne PH: Embryonic stem cell microRNAs: defining factors in induced pluripotent (iPS) and cancer (CSC) stem cells? Curr Stem Cell Res Ther 2009, 4:168–177.
21. Palmer RD, Murray MJ, Saini HK, van Dongen S, Abreu-Goodger C, Muralidhar B, Pett MR, Thornton CM, Nicholson JC, Enright AJ, Coleman N: Malignant Germ Cell Tumors Display Common MicroRNA Profiles Resulting in Global Changes in Expression of Messenger RNA Targets. Cancer Res 2010, 70:2911–2923.
22. Cimadamore F, Fishwick K, Giusto E, Gnedeva K, Cattarossi G, Miller A, Pluchino S, Brill LM, Bronner-Fraser M, Terskikh AV: Human ESC-Derived Neural Crest Model Reveals a Key Role for SOX2 in Sensory Neurogenesis. Cell Stem Cell 2011, 8:538–551.
23. Greber B, Lehrach H, Adjaye J: Silencing of core transcription factors in human EC cells highlights the importance of autocrine FGF signaling for self-renewal. BMC Dev Biol 2007, 7:46.
24. Peterson KA, Nishi Y, Ma W, Vedenko A, Shokri L, Zhang X, McFarlane M, Baizabal J-M, Junker JP, van Oudenaarden A, Mikkelsen T, Bernstein BE, Bailey TL, Bulyk ML, Wong WH, McMahon AP: Neural-specific Sox2 input and differential Gli-binding affinity provide context and positional information in Shh-directed neural patterning. Genes Dev 2012, 26:2802–2816. 25. Bergsland M, Ramsköld D, Zaouter C, Klum S, Sandberg R, Muhr J:
Sequentially acting Sox transcription factors in neural lineage development. Genes Dev 2011, 25:2453–2464.
26. Marson A, Levine SS, Cole MF, Frampton GM, Brambrink T, Johnstone S, Guenther MG, Johnston WK, Wernig M, Newman J, Calabrese JM, Dennis LM, Volkert TL, Gupta S, Love J, Hannett N, Sharp PA, Bartel DP, Jaenisch R, Young RA: Connecting microRNA genes to the core transcriptional regulatory circuitry of embryonic stem cells. Cell 2008, 134:521–533. 27. Guo H, Ingolia NT, Weissman JS, Bartel DP: Mammalian microRNAs
predominantly act to decrease target mRNA levels. Nature 2010, 466:835–840.
28. Baek D, Villén J, Shin C, Camargo FD, Gygi SP, Bartel DP: The impact of microRNAs on protein output. Nature 2008, 455:64–71.
29. Guimbellot JS, Erickson SW, Mehta T, Wen H, Page GP, Sorscher EJ, Hong JS: Correlation of microRNA levels during hypoxia with predicted target mRNAs through genome-wide microarray analysis. BMC Med Genomics 2009, 2:15.
30. Nunez-Iglesias J, Liu C-C, Morgan TE, Finch CE, Zhou XJ: Joint Genome-Wide Profiling of miRNA and mRNA Expression in Alzheimer’s Disease Cortex Reveals Altered miRNA Regulation. PLoS One 2010, 5:e8898. 31. Shahab SW, Matyunina LV, Mezencev R, Walker LD, Bowen NJ, Benigno BB,
McDonald JF: Evidence for the Complexity of MicroRNA-Mediated Regulation in Ovarian Cancer: A Systems Approach. PLoS One 2011, 6:e22508. 32. Ambs S, Prueitt RL, Yi M, Hudson RS, Howe TM, Petrocca F, Wallace TA, Liu
C-G, Volinia S, Calin GA, Yfantis HG, Stephens RM, Croce CM: Genomic Profiling of MicroRNA and Messenger RNA Reveals Deregulated MicroRNA Expression in Prostate Cancer. Cancer Res 2008, 68:6162–6170.
33. Selbach M, Schwanhäusser B, Thierfelder N, Fang Z, Khanin R, Rajewsky N: Widespread changes in protein synthesis induced by microRNAs. Nature 2008, 455:58–63.
34. Dmitriev P, Barat A, Polesskaya A, O’Connell MJ, Robert T, Dessen P, Walsh TA, Lazar V, Turki A, Carnac G, Laoudj-Chenivesse D, Lipinski M, Vassetzky YS: Simultaneous miRNA and mRNA transcriptome profiling of human myoblasts reveals a novel set of myogenic differentiation-associated miRNAs and their target genes. BMC Genomics 2013, 14:265. 35. Ma L, Huang Y, Zhu W, Zhou S, Zhou J, Zeng F, Liu X, Zhang Y, Yu J: An
Integrated Analysis of miRNA and mRNA Expressions in Non-Small Cell Lung Cancers. PLoS One 2011, 6:e26502.
36. Su W-L, Kleinhanz RR, Schadt EE: Characterizing the role of miRNAs within gene regulatory networks using integrative genomics techniques. Mol Syst Biol 2011, 7:490.
37. Pal R, Ravindran G: Assessment of pluripotency and multilineage differentiation potential of NTERA-2 cells as a model for studying human embryonic stem cells. Cell Prolif 2006, 39:585–598.
38. Josephson R, Ording CJ, Liu Y, Shin S, Lakshmipathy U, Toumadje A, Love B, Chesnut JD, Andrews PW, Rao MS, Auerbach JM: Qualification of
embryonal carcinoma 2102Ep as a reference for human embryonic stem cell research. Stem Cells 2007, 25:437–446.
39. Schwartz CM, Spivak CE, Baker SC, McDaniel TK, Loring JF, Nguyen C, Chrest FJ, Wersto R, Arenas E, Zeng X, Freed WJ, Rao MS: NTera2: a model system to study dopaminergic differentiation of human embryonic stem cells. Stem Cells Dev 2005, 14:517–534.
40. Hovatta O, Jaconi M, Töhönen V, Béna F, Gimelli S, Bosman A, Holm F, Wyder S, Zdobnov EM, Irion O, Andrews PW, Antonarakis SE, Zucchelli M, Kere J, Feki A: A Teratocarcinoma-Like Human Embryonic Stem Cell (hESC) Line and Four hESC Lines Reveal Potentially Oncogenic Genomic Changes. PLoS One 2010, 5:e10263.
41. Andrews PW, Fenderson B, Hakomori S: Human embryonal carcinoma cells and their differentiation in culture. Int J Androl 1987, 10:95–104. 42. Yang S, Lin G, Deng L, Lu G-X: Tumourigenic characteristics of embryonal
carcinoma cells as a model for studying tumour progression of human embryonic stem cells. Cell Prolif 2012, 45:299–310.
43. Liu Y, Shin S, Zeng X, Zhan M, Gonzalez R, Mueller F-J, Schwartz CM, Xue H, Li H, Baker SC, Chudin E, Barker DL, McDaniel TK, Oeser S, Loring JF, Mattson MP, Rao MS: Genome wide profiling of human embryonic stem cells (hESCs), their derivatives and embryonal carcinoma cells to develop base profiles of U.S. Federal government approved hESC lines. BMC Dev Biol 2006, 6:20.
44. Kozomara A, Griffiths-Jones S: miRBase: integrating microRNA annotation and deep-sequencing data. Nucleic Acids Res 2011, 39(Database issue):D152–D157.
45. Stadler B, Ivanovska I, Mehta K, Song S, Nelson A, Tan Y, Mathieu J, Darby C, Blau CA, Ware C, Peters G, Miller DG, Shen L, Cleary MA, Ruohola-Baker H: Characterization of microRNAs involved in embryonic stem cell states. Stem Cells Dev 2010, 19:935–950.
46. Xie B, Ding Q, Han H, Wu D: miRCancer: a microRNA-cancer association database constructed by text mining on literature. Bioinformatics 2013, 29:638–644.
47. Stone N, Pangilinan F, Molloy AM, Shane B, Scott JM, Ueland PM, Mills JL, Kirke PN, Sethupathy P, Brody LC: Bioinformatic and Genetic Association Analysis of MicroRNA Target Sites in One-Carbon Metabolism Genes. PLoS One 2011, 6:e21851.
48. Vickers KC, Shoucri BM, Levin MG, Wu H, Pearson DS, Osei-Hwedieh D, Collins FS, Remaley AT, Sethupathy P: MicroRNA-27b is a regulatory hub in lipid metabolism and is altered in dyslipidemia. Hepatology 2013, 57:533–542. 49. Huang DW, Sherman BT, Lempicki RA: Systematic and integrative analysis
of large gene lists using DAVID bioinformatics resources. Nat Protoc 2009, 4:44–57.
50. Takemoto T, Uchikawa M, Yoshida M, Bell DM, Lovell-Badge R, Papaioannou VE, Kondoh H: Tbx6-dependent Sox2 regulation determines neural or mesodermal fate in axial stem cells. Nature 2011, 470:394–398. 51. Tellez CS, Juri DE, Do K, Bernauer AM, Thomas CL, Damiani LA, Tessema M,
Leng S, Belinsky SA: EMT and Stem Cell–Like Properties Associated with miR-205 and miR-200 Epigenetic Silencing Are Early Manifestations during Carcinogen-Induced Transformation of Human Lung Epithelial Cells. Cancer Res 2011, 71:3087–3097.
52. Cieply B, Riley P 4th, Pifer PM, Widmeyer J, Addison JB, Ivanov AV, Denvir J, Frisch SM: Suppression of the epithelial-mesenchymal transition by Grainyhead-like-2. Cancer Res 2012, 72:2440–2453.
53. Matsumata M, Uchikawa M, Kamachi Y, Kondoh H: Multiple N-cadherin enhancers identified by systematic functional screening indicate its Group B1 SOX-dependent regulation in neural and placodal development. Dev Biol 2005, 286:601–617.
54. Thomson M, Liu SJ, Zou L-N, Smith Z, Meissner A, Ramanathan S: Pluripotency Factors in Embryonic Stem Cells Regulate Differentiation into Germ Layers. Cell 2011, 145:875–889.
55. Sharov AA, Masui S, Sharova LV, Piao Y, Aiba K, Matoba R, Xin L, Niwa H, Ko MSH: Identification of Pou5f1, Sox2, and Nanog downstream target genes with statistical confidence by applying a novel algorithm to time course microarray and genome-wide chromatin immunoprecipitation data. BMC Genomics 2008, 9:269.
56. Paraskevopoulou MD, Georgakilas G, Kostoulas N, Vlachos IS, Vergoulis T, Reczko M, Filippidis C, Dalamagas T, Hatzigeorgiou AG: DIANA-microT web server v5.0: service integration into miRNA functional analysis workflows. Nucleic Acids Res 2013, 41(Web Server issue):W169–W173.
57. Betel D, Wilson M, Gabow A, Marks DS, Sander C: The microRNA.org resource: targets and expression. Nucl Acids Res 2008, 36:D149–D153.