LBL-41021 SLAC-PUB-7692 Nov 1997
Java Online Monitoring Framework
1M. Ronan
Lawrence Berkeley National Laboratory
D. Kirkby
Stanford University
A.S. Johnson, N. de Groot
Stanford Linear Accelerator Center
Abstract
An online monitoring framework has been written in the Java Language Environment to develop applications for monitoring special purpose detectors during commissioning of the PEP-II Interaction Region. PEP-II machine parameters and signals from several of the commissioning detectors are logged through VxWorks/EPICS and displayed by Java display applications. Remote clients are able to monitor the machine and detector performance using graphical displays
and analysis histogram packages. In this paper, the design
and implementation of the object-oriented Java framework
is described. Illustrations of data acquisition, display and
histograming applications are also given.
I. I
NTRODUCTIONHigh-level graphical user interfaces (GUI’s) are used extensively in operating and monitoring High Energy Physics
accelerators and detectors. Their use allows operators and
scientists to quickly interpret the state and performance of the machine or experiment. Integrated control system architectures require that these processes communicate effectively with several different concurrent processes which coordinate various activities, such as occurrence reporting, database transfers or
other operations. Performance, modularity, portability and
ease of use are important issues in designing effective tools; and, in commissioning applications, seamless integration of a collection of distributed systems is critical.
Figure 1 illustrates a typical arrangement of monitor screens, each with a number of display windows, receiving data from different sources. In this case, the sources are fully
compatible Internet servers. To minimize network traffic,
a framework allows for the coordination of the different displays within each application. After being instantiated by the package manager, which determines their appearance, the window processes pass their monitor data requests to a broker that retrieves the data from the appropriate servers.
1
Work supported by Department of Energy contracts DE-AC03-76SF00098 (LBNL), DE-AC03-76SF00515 (SLAC), and NSF contract PHY-9513999-001 (Stanford).
Win 1 Client 1
Win 3
Win 2
Win 4 Win 5
Server 1 Server 2 Server 3
App 1 App 2
Win Client 2
10–97 8363A4
Fig. 1 Illustration of several servers providing monitor data to different client applications, each with a number of display windows. A framework coordinates the actions of the processes within each application.
A. Commissioning Monitor Applications
During the commissioning of the PEP-II High Energy Ring (HER) in Fall 1997 and of the BaBar Interaction Region (IR) in 1998, a number of PEP-II parameters are being monitored as the machine is brought into operation, while an extensive suite of particle detectors are being employed to measure
beam backgrounds. A good understanding and reduction
of the backgrounds and the attendant radiation exposure will be achieved through validation of detailed Monte Carlo simulations and through dedicated machine experiments. For example, backgrounds due to synchrotron radiation and beam losses in the IR straight section are being measured using an array of PIN Diode detectors. Several other devices, in many cases with their own independent data acquisition systems, are now in place or will be installed to measure different aspects of these backgrounds. In addition, environmental quantities will be measured within a central detector monitoring system. Several monitor display screens have been provided to allow the experimenters to correlate background measurements with machine conditions, to develop and integrate beam loss monitors, and to calibrate and protect the instruments themselves.
Intranet
DAQ Monitor Servers
EPICS Database Other
Monitor Processes 10–97 8363A1 ... ... ... Internet Histograms Applets Analysis Studio (JAS) Other Monitor Processes Web Browser Requests Data Retreival
Analysis Engine Server Histograms
Monitor Processes OnlineWindow's
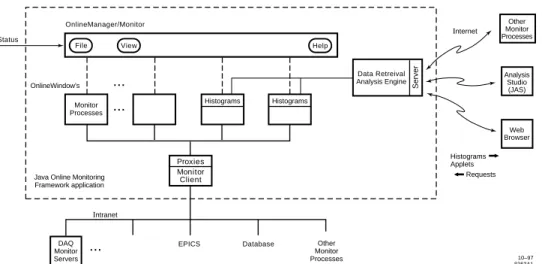
Java Online Monitoring Framework application Status Proxies Monitor Client Histograms File OnlineManager/Monitor View Help
Fig. 2 Conceptual diagram of a complete Java Online Monitoring application, whose components are shown within the dashed box.
framework described here have been written to integrate the monitoring tasks and to provide common graphical representations. The Java language allows these applications to operate anywhere on the Internet, on almost any platform, with little programming overhead and no porting obstacles.
B. Java Language Environment
The Java Language Environment, developed by Sun Microsystems, offers several advantages in implemented such a disperse data acquisition system. It’s object-oriented methodology allows the development of reusable components, graphical user interfaces are easy to implement and it’s distributed techniques (such as Remote Method Invocation) provide an excellent software environment for building multitiered network applications.
The Java language itself has the look and feel of
C/C++, and is fully object-oriented (see Ref. 1,2). As
an interpreted language it allows for quick turn around during program development and for complete platform
independence. Graphical components, separate threads of
execution, and easy-to-use, highly sophisticated interfaces to the network are all built into the language, allowing the straight-forward implementation of broadly-distributed client/server applications and informative graphical user interfaces.
Portable Java display applications, called Applets, can be executed on any Java-enabled browser. The Java Virtual Machine (JVM) embedded in the browsers allows the Applets to operate on any platform. Similar JVM’s have been provided by Sun, Microsoft or machine vendors to interpret compiled Java classes, which are machine-independent. Just-In-Time compilers, available for most platforms to provide machine level code, allow Java to reach computing speeds of established languages such as Fortran, C and C++.
II. O
NLINEM
ONITORINGF
RAMEWORK The Java Online Monitoring Framework has been written to satisfy some of the real-time requirements for machinecommissioning and to provide for remote monitoring. This modular framework allows personalized applications to be assembled with different collections of standard displays. Within the framework one class is used to coordinate the data requests for the different displays and to retrieve the data from several different servers as illustrated in Fig. 2. The framework
schedules updates, imposing any control system status
requirements, and monitors and reports errors in satisfying system requirements. Multiple servers can be created within a monitor application to provide extended remote monitoring.
A. Conceptual Design
A modular framework for multithreaded real-time processes has been chosen; an architectural diagram is shown in Fig. 2. A typical Online Monitoring application consists of the following
components. A monitor thread (OnlineMonitor) to interact
with the local control system and to monitor the performance
of update threads within each display processes. A client
thread (MonitorClient) to gather requests for monitoring quantities and to retrieve them from the real-time system. And, several modules coordinated and displayed by the framework (OnlineManager) and its screen manager (ScreenManager). Each module (OnlineWindow) provides a separate interface and display to the user, but with a common (inherited) appearance and behaviour. As a separate subprocess, it updates
displays and checks for errors at regular intervals. These
windows include simple display or dialog windows, standard history plots, and histogram or histogram summary windows. A server process (MonitorServer) can be employed for remote monitoring over the Internet.
B. Java Implementation
The modelling, prototyping and implementation of the Online Monitoring framework is in progress. The following base classes, reference applications and utilities, described in this and the following sections, have been implemented.
The OnlineManager class provides the template for the
top-level framework coordinators. Sub-classes for different
are used to define the contents of each package; that is, the collection of monitor threads and display windows within an application. The standard constructor creates a screen manager, a monitor to sequence operations within the package, and the requested number of windows. The ScreenManager sets the location and size of selected windows from predetermined layouts, and in the future will allow resizing and saving of modified layouts using the Java Bean component technology.
The OnlineMonitor thread of standard Online Monitoring packages: recognizes the state of the local data acquisition system in controlling the operation of framework windows and threads, outputs any reportable occurrences to the local logging system, provides a common time stamp and maintains a continually responsive thread of execution.
Following specifications defined in an AbstractWindow interface, the OnlineWindow class defines standard monitoring display objects, their appearance and their action responses
and update methods. The standard constructor creates a
new window, incrementing the window count, displays the window and starts up the window’s update thread. Normally each window thread updates its display every few seconds at reduced priority compared to the application’s OnlineMonitor thread.
The data transport for the monitor is organized in two classes, a subscriber [”MonitorClient”] and a publisher
[”MonitorServer”]. These classes take care of the
communication and bookkeeping of data requests within the framework. A monitoring program then uses the MonitorClient class to subscribe to various remote channels, and to serve all OnlineWindow’s within the application. Online tasks can use the MonitorServer to publish current monitor readings or
their accumulated history data. Data that can be published
has to implement the MonitorData interface. This interface provides a ToStream function to serialize the data and add some bookkeeping information (time-stamp, sequence no,...).
The following classes inherit from OnlineWindow: The
OnlineFrame class provides an interface for Applet’s to
operate within the framework, while maintaining the Applet’s ability to be displayed within compatible browsers. Methods include: display() to get a screen location and display the frame, getNumber() to return the OnlineWindow number, as well as thread init,start,stop and run methods. OnlineHistory objects display online history plots. The OnlineHistogram class displays continuously updating histogram displays. Standard interfaces allow online monitoring classes to book and fill histograms which can be accessed and viewed remotely.
HistogramSummary objects display a summary of the
histograms being accumulated.
III. R
EFERENCEA
PPLICATIONSWe give two reference applications for the PEP-II
subsystem: One is a pure visual monitoring package,
IRMonitor, which displays several windows in providing
different views of the data. It includes instantaneous
readings, graphical charts, and history plots of different time-averaged quantities. The other is a histograming package,
PEPHistogram, which accumulates histograms and serves
them up to remote analysis clients, with an optional histogram summary display.
A. An IR Monitor Display Package
In the sense of modular Online Monitoring applications,
packages are collections of existing OnlineWindows’s
for individual subsystems (e.g. PEP-II, PIN Diode, Straw
Chamber, etc.). An IR Monitor package might include windows displaying PEP-II quantities and different commissioning detector summary windows to allow the correlation of detector effects with machine operation. Other packages might include different PEP-II quantities, detector windows or might just present a different focus. Different packages might actually be different representations of the same software collection. For this example we chose a PEP-II summary display, an Applet client display and two history plot windows, two PIN Diode history plots and a Straw Chamber points and line event display.
The IRMonitor class inherits OnlineManager methods and creates an IR Monitor package with the following OnlineWindow’s. A PEPWindow object uses the Java AWT TestArea class to display instantaneous readings of PEP-II parameters. The PEPFrame class displays a PEPApplet which charts the readings of several PEP-II parameters in different colors that can be high-lighted by selecting the corresponding label. PEPHistory plots record the time-averages of PEP-II
readings. Two PINHistory plots display raw temperature
sensor or leakage current readings from the PIN Diode detectors, and a SCWindow object shows different views of the points and lines fittted to hits in the Straw Chamber. The PEP-II readings are obtained as PEPData objects from a Java RMI server, PEPServer. The PIN Diode data packets and Straw Chamber event types are provided by DAQ
Monitor servers described below. In a running application,
the OnlineManager, OnlineMonitor, ScreenManager and
OnlineHelp can be accessed through a menu bar window.
B. A PEP-II Histograming Package
This package accumulates histograms and serves them up to remote display and analysis clients. An online histogram summary showing the contents and under/overflows is provided
for quick visual checks of the accumulation process. The
OnlineMonitor thread is designed to allow the control of histograming during machine fills.
The PEPHistogram class inherits OnlineManager
methods and creates a PEP-II histogrammer process and a
histogram summary window, with no other displays. The
PEPHistogrammer books several histograms and fills them as
updates become available. A HistogramServer is created to allow the histograms to be accessed remotely using the Java
Analysis Studio described below. The PEPHistSummary
inherits methods from HistogramSummary to display the
booked histogram contents. Normally, once the histogram
accumulation has been checked, the PEPHistSummary display
can be dismissed at any time. Using the remote interface,
may request that new histograms be booked and filled as monitoring continues or that new histograms be made from recorded quantities.
IV. DAQ
ANDM
ONITORINGS
YSTEMS Remote monitoring has been provided for some of the PEP-II commissioning devices. The data acquisition and monitoring systems for the PIN diode detectors and the straw tube chambers are described below.A. PIN Diode Data Acquisition and Monitoring
A sophisticated data acquisition and monitoring system has been written in Java for the PIN Diode detectors, Ref. 3. The detectors and associated temperature sensors are read out by a VxWorks based system which sends out data on a TCP/IP socket, Fig. 3. The data acquisition system receives the packets, provides real-time HistoryPlot displays and writes the data to a local file on a Solaris UltraSparc station. The DAQ process includes servers which respond to remote run control commands and which transmit data packets to remote clients. Clients can be used remotely to check the DAQ status, to print ongoing message logs, to display real-time HistoryPlot’s or to access processed data files.
srv01 10–97 8363A3 PEP "dm" Screens EPICS PEP EPICS Remote Clients Remote Run Control Local Storage Java Applications ... ... Server Monitor bc–diode IOC IOC Diodes +PEP PIN Diode Router PEP LAN BaBar LAN IOC IOC
Fig. 3 PIN Diode Data Acquisition and Monitoring System
B. Straw Chamber Data Acquisition and Monitoring
The data acquistion for the Straw Chambers, written in C, reads hardware through a GPIB bus, fits for tracks and writes both the raw and reconstructed data to a local file on an AIX/3.2 RS6000 platform, Fig. 4. Besides the in-line monitoring, a forked subprocess pipes a sample of the data through a TCP/IP
socket for remote monitoring. The StrawChamber DAQ
Monitoring system, written entirely in Java, consists of a client monitor process which connects to the DAQ child process to receive the event sample and then creates servers to handle
individual requests from remote clients. Clients which request different types of StrawChamber data, over the network, have been written to provide various event displays. For each event, only the requested data packets are sent. The remote clients perform event handeling and display on Sun, IBM, HP, Dec, Windows PC or Apple platforms.
Monitor 10–97 8363A2 Data Storage DAQ
Process DAQMonitor
Process Clients Servers Java applications Server (inner classes) DAQ Buses Remote Monitoring Data Acquisition ... ... ...
Fig. 4 Straw Chamber Data Acquisition and Monitoring System
V. J
AVAU
TILITIESThe following utilities have been developed as separate Java class libraries, called packages.
A. History Plots
The facility for making time history plots, Ref. 3, consists of classes to both maintain and graph a history record. In their constructor method, HistoryRecord objects are divided into time slices and attached to a particular graph. The size and title of HistoryGraph objects are set by their constructor, while appropriately named methods set the grid spacing and label the ordinate axis.
B. Histogram Facility
A hep/analysis package, Ref. 4, is used to partition, book and fill histograms. A named HistogramServer object is created to allow remote access to the histograms. Each histogram, booked by constructing a labeled Histogram object, is then filled with an appropriately named method.
C. Java Analysis Studio
The Java Analysis Studio is being developed, Ref. 4,
to allow remote viewing of histograms and Applets. A
JAS HistogramServer, such as the one included in the Java Online Monitoring Framework shown in Fig. 2, makes histograms available remotely during online monitoring or analysis processes. Histogram objects can then be accessed and displayed using the Java Analysis Studio which allows
rebinning and fits to the histogrammed data. Requests for
new histograms or for reanalysis of recorded data can be sent back from the analysis studio to the server which may employ an analysis engine to reanalyze data. Applets which present histograms or real-time data can be obtained from the remote
server and displayed. DAQ Process 10–97 8363A5 ... ... Machine Monitors
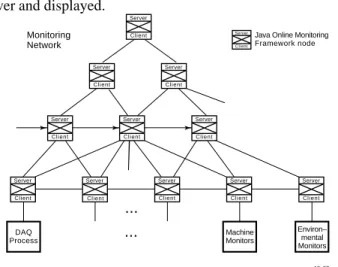
Java Online Monitoring Framework node Monitoring Network Environ– mental Monitors Server Client Server Client Server Client Server Client Server Server Client Client Server Client Server Client Server Client Server Client Server Client Server Client
Fig. 5 Network configuration for a Java Online Monitoring application with a multitiered client/server architecture.
VI. F
URTHERA
PPLICATIONSClient/server applications, built within the framework described here, make efficent access to multiple sources of incoming data, and handle requests from any number of remote clients. At each node of a multitiered client/server architecture, such as shown in Fig. 5, these client/server applications may each have multiple data monitoring and display processes. At any level, the framework may impose common state conditions to insure a uniform monitoring environment. Such a design provides a scalable model for developing complete real-time monitoring or processing solutions.
VII. A
CKNOWLEDGEMENTSThe straw tube chamber Java DAQ Monitoring
system was written by K. Benabed and N. Treps, Ecole Polytechnique LPNHE. We can be reached at [email protected],
[email protected], [email protected] or
VIII. R
EFERENCES[1] Java in a Nutshell, D. Flanagan, O’Reilly & Associates Inc., May 1996; and later publications covering JDK 1.1.
[2] The Java Tutorial, M. Campione and K. Walrath, ordered through amazon.com, is also available online at http://java.sun.com/docs/books/tutorial/index.html.
[3] D. Kirkby et al, PIN Diode Commissioning Data Acquisition and Monitoring, to be published.
[4] See for example, Java Analysis Studio, A.S. Johnson, Proceedings of the 1997 CHEP Conference, Berlin, Germany, April 7-11, 1997.