Electrical and Computer Engineering Publications
Electrical and Computer Engineering
5-2015
Mining maximal cliques from a large graph using
MapReduce: Tackling highly uneven subproblem
sizes
Michael Svendsen
Iowa State University
Arko Provo Mukherjee
Iowa State University
Srikanta Tirthapura
Iowa State University
, [email protected]
Follow this and additional works at:
http://lib.dr.iastate.edu/ece_pubs
Part of the
Electrical and Computer Engineering Commons
The complete bibliographic information for this item can be found at
http://lib.dr.iastate.edu/
ece_pubs/145
. For information on how to cite this item, please visit
http://lib.dr.iastate.edu/
howtocite.html
.
This Article is brought to you for free and open access by the Electrical and Computer Engineering at Iowa State University Digital Repository. It has been accepted for inclusion in Electrical and Computer Engineering Publications by an authorized administrator of Iowa State University Digital Repository. For more information, please [email protected].
Mining maximal cliques from a large graph using MapReduce: Tackling
highly uneven subproblem sizes
Abstract
We consider Maximal Clique Enumeration (MCE) from a large graph. A maximal clique is perhaps the most
fundamental dense substructure in a graph, and MCE is an important tool to discover densely connected
subgraphs, with numerous applications to data mining on web graphs, social networks, and biological
networks. While effective sequential methods for MCE are known, scalable parallel methods for MCE are still
lacking.
We present a new parallel algorithm for MCE, Parallel Enumeration of Cliques using Ordering (PECO"
role="presentation" style="box-sizing: border-box; display: inline-block; line-height: normal; font-size:
14.4px; word-spacing: normal; word-wrap: normal; white-space: nowrap; float: none; direction: ltr;
max-width: none; max-height: none; min-max-width: 0px; min-height: 0px; border: 0px; padding: 0px; margin: 0px;
position: relative;">PECO), designed for the MapReduce framework. Unlike previous works, which required
a post-processing step to remove duplicate and non-maximal cliques, PECO" role="presentation"
style="box-sizing: border-box; display: inline-block; line-height: normal; font-size: 14.4px; spacing: normal;
word-wrap: normal; white-space: nowrap; float: none; direction: ltr; max-width: none; max-height: none;
min-width: 0px; min-height: 0px; border: 0px; padding: 0px; margin: 0px; position: relative;">PECOenumerates
only maximal cliques with no duplicates. The key technical ingredient is a total ordering of the vertices of the
graph which is used in a novel way to achieve a load balanced distribution of work, and to eliminate redundant
work among processors. We implemented PECO" role="presentation" style="box-sizing: border-box; display:
inline-block; line-height: normal; font-size: 14.4px; word-spacing: normal; word-wrap: normal; white-space:
nowrap; float: none; direction: ltr; max-width: none; max-height: none; min-width: 0px; min-height: 0px;
border: 0px; padding: 0px; margin: 0px; position: relative;">PECO on Hadoop MapReduce, and our
experiments on a cluster show that the algorithm can effectively process a variety of large real-world graphs
with millions of vertices and tens of millions of maximal cliques, and scales well with the degree of available
parallelism.
Keywords
Graph mining, Maximal clique enumeration, Enumeration algorithm, MapReduce, Hadoop, Parallel
algorithm, Clique, Load balancing
Disciplines
Electrical and Computer Engineering
Comments
This is a manuscript of an article from Svendsen, Michael, Arko Provo Mukherjee, and Srikanta Tirthapura.
"Mining maximal cliques from a large graph using mapreduce: Tackling highly uneven subproblem sizes."
Journal of Parallel and Distributed Computing 79 (2015): 104-114. DOI:
10.1016/j.jpdc.2014.08.011
. Posted
with permission.
Contents lists available atScienceDirect
J. Parallel Distrib. Comput.
journal homepage:www.elsevier.com/locate/jpdc
Mining maximal cliques from a large graph using MapReduce:
Tackling highly uneven subproblem sizes
Michael Svendsen
,
Arko Provo Mukherjee
,
Srikanta Tirthapura
∗Department of Electrical and Computer Engineering, Iowa State University, Coover Hall, Ames, IA, 50011, USA
h i g h l i g h t s
• Scalable method for enumerating maximal cliques in a graph using MapReduce.
• Effective solution to load balancing.
• Experimental evaluation of our solution on large real world graphs.
• Outperforms previous MapReduce solutions by orders of magnitude.
a r t i c l e i n f o
Article history:
Received 19 November 2013 Received in revised form 2 June 2014
Accepted 17 August 2014 Available online 10 September 2014 Keywords:
Graph mining
Maximal clique enumeration Enumeration algorithm MapReduce Hadoop Parallel algorithm Clique Load balancing
a b s t r a c t
We consider Maximal Clique Enumeration (MCE) from a large graph. A maximal clique is perhaps the most fundamental dense substructure in a graph, and MCE is an important tool to discover densely connected subgraphs, with numerous applications to data mining on web graphs, social networks, and biological networks. While effective sequential methods for MCE are known, scalable parallel methods for MCE are still lacking.
We present a new parallel algorithm for MCE, Parallel Enumeration of Cliques using Ordering (PECO), designed for the MapReduce framework. Unlike previous works, which required a post-processing step to remove duplicate and non-maximal cliques,PECOenumerates only maximal cliques with no duplicates. The key technical ingredient is a total ordering of the vertices of the graph which is used in a novel way to achieve a load balanced distribution of work, and to eliminate redundant work among processors. We implementedPECOon Hadoop MapReduce, and our experiments on a cluster show that the algorithm can effectively process a variety of large real-world graphs with millions of vertices and tens of millions of maximal cliques, and scales well with the degree of available parallelism.
©2014 Elsevier Inc. All rights reserved.
1. Introduction
We consider the enumeration of dense substructures in a large graph. Large Graphs of the order of millions or billions of nodes and edges arise during the analysis of the web [29], social net-works [27], and scientific applications [35]. These graphs typically do not fit in the memory of a single machine and even if they do, the computational demands of analyzing such graphs are so high that it is necessary to process them in parallel to achieve a reasonable turnaround time.
Perhaps the most elementary dense substructure in a graph, also probably the most commonly used, is a maximal clique.
∗Corresponding author.
E-mail addresses:[email protected](M. Svendsen),[email protected] (A.P. Mukherjee),[email protected](S. Tirthapura).
Enumerating all maximal cliques in a graph is known as the max-imal clique enumeration problem (MCE). MCE is a fundamen-tal problem in graph analysis, and has been used widely, for instance, in clustering and community detection in social and bi-ological networks [35], in the study of the co-expression of genes under stress [37], in integrating different types of genome map-ping data [19], and other applications in bio-informatics and data mining [6,15,22,33,46,20,44].
We consider parallel methods for enumerating all maximal cliques in a graph. While our algorithm maybe more broadly applicable, in this work we focus our implementation on the widely usedMapReduce[10,11,17] framework for cluster comput-ing. While MCE is widely studied in the sequential setting [4,5,8,25,
13,23,21,31,40,41], there is relatively less work on parallel meth-ods [45,12,38,43,30].
In processing a large graph, it is natural to try breaking up the graph into subgraphs and process the subgraphs by parallel tasks. http://dx.doi.org/10.1016/j.jpdc.2014.08.011
This approach presents some challenges in the context of MCE. First, it is necessary to avoid overlap among different coordinating tasks. The difficulty is that in almost any method of dividing a graph for parallel processing for MCE, subgraphs assigned to different tasks will overlap. However, the algorithm should be careful in not repeating the same work among different tasks, at the same time enumerating all maximal cliques. The second challenge is that the distribution of work among different processors (reducers) should beload balanced. In the absence of load balancing, the time taken by different processors could be widely different, so that the parallel resources are not used efficiently, leading to a poor parallel runtime. The above challenges arise in parallelizing any computation using MapReduce, but are especially acute in parallel MCE, since straightforward methods of task division can lead to workloads that are extremely imbalanced.
Our contributions
We present a novel parallel MCE algorithm calledPECO(Parallel
Enumeration ofCliques usingOrdering). To our knowledge, this is currently the fastest parallel algorithm for MCE using MapReduce, and improves on prior work in the following ways.
Prior algorithms using MapReduce [43] follow the strategy of first enumerating a set of cliques that are not necessarily maximal, but include all maximal cliques in the graph. This is then followed by a post-processing step that removes non-maximal cliques and duplicates. This post-processing step can be expensive, since the presence of non-maximal cliques and duplicates can make the intermediate output much larger than the final output size. In contrast,PECOoutputs only maximal cliques without duplicates, and does not need an additional post-processing step.
Second,PECOprovides the first effective solution toload balance
among parallel tasks, in the MapReduce framework. This is a challenging problem in case of parallel MCE, due to non-uniform subproblem sizes, and the unbalanced lengths of search paths in different subproblems [38]. In our experiments, we found load balance to be one of the most important factors contributing to total runtime of enumeration. The technical ingredient in our algorithm is a carefully chosen ordering among all vertices in the graph, and the use of this ordering in load balancing and eliminating overlapping work among subproblems.
Experimental results. We implementedPECOon a Hadoop MapRe-duce cluster, and our experiments with a variety of large real world graphs showed thatPECOcan enumerate maximal cliques within large graphs of millions of vertices and tens of millions of maximal cliques, and that it scales well with an increasing number of re-ducers. Our experiments revealed thatPECOoutperforms previous solutions [43] by orders of magnitude, especially for large graphs.
2. Preliminaries
LetG
=
(
V,
E)
be an undirected unweighted graph whereVis the set of vertices andEthe set of edges. We assume every vertex inVhas a unique identifier, chosen from a totally ordered set. This is not a restrictive assumption in practice. For example, if each vertex represented a webpage, then the vertices can be ordered using the lexicographic ordering among the respective URLs. For
v
∈
V, letΓ
(v)
denote the set of all vertices that are adjacent tov
inG; we refer to this as the neighborhood ofv
. A subsetC⊆
Vis acliqueinGif for every pair of verticesu
, w
∈
Cthe edge(
u, w)
exists inE. A cliqueCismaximalinGif no vertexu∈
V−
Ccan be added toCto form a larger clique. In the remainder of this paper, any reference to a clique refers to a maximal clique, unless otherwise specified. The MCE problem is:Given an undirected graph G,enumerate all maximal cliques in G.MapReduce. MapReduce [10] is a popular framework designed for processing large data sets on a cluster of computers. A MapReduce program is written through specifying map and reduce functions. The map function takes as input a key–value pair
(
k, v)
and emits zero, one, or more new key–value pairs(
k′, v
′)
. All tuples with the same key are grouped together and passed to a reduce function, which processes a particular keykand all values that are associated withk, and outputs a final list of key–value pairs. The outputs of one MapReduce round can be the input to the next round. The MapReduce system takes care of scheduling the map and reduce tasks in parallel. Further details on the framework are available in [10,14].The rest of this paper is organized as follows. We present related work in Section3, describe our algorithm and analysis in Section4, and results from Experiments in Section5.
3. Related work
We first discuss related work on sequential MCE and then on parallel MCE.
Sequential MCE. An early work due to Bron and Kerbosch [4] is an al-gorithm based on depth-first-search with good experimental per-formance on typical inputs, but whose worst case behavior is poor. Other algorithms stemming from this work include [23,40,5,13]. Some of these algorithms, especially [40,13], have asymptotically near-optimal worst case performance, and also run fast on typical inputs. The number of maximal cliques in a graph can be exponen-tial in the number of vertices [34], although this is not true in the typical case.
Another branch of enumeration algorithms provide output sen-sitive runtime guarantees, i.e. the runtime is proportional to the size of the output. These algorithms stem from the Tsukiyama et al. [41] algorithm, which has a running time ofO
(
|
V| |
E|
µ)
, whereµ
is the number of maximal cliques. Other output sensi-tive algorithms include [8,25,21,31], with [31] providing one of the best theoretical guarantees. However, these output sensitive rithms tend not to perform as well as the worst case optimal algo-rithms in practice [40,13]. Other works on sequential MCE include Kose et al. [24], who take a breadth first search approach, an exter-nal memory algorithm due to Cheng et al. [7], and pruning strate-gies for enumerating large cliques, due to Modani and Dey [32].Parallel MCE. Early works in the area of parallel MCE include Zhang et al. [45] and Du et al. [12]. Zhang et al. developed an algorithm based on the Kose et al. [24] algorithm. Since these algorithms are based on breadth first search, they are able to enumerate maximal cliques in increasing order of size, but this makes the memory requirements very large. Du et al. [12], present a parallel algorithm based on the output-sensitive class of algorithms. However, as also noted by Schmidt et al. [38], this algorithm suffers from poor load balance; the graphs addressed by these experiments are quite small, they have about 150,000 maximal cliques and a million edges.
Schmidt et al. [38] identify load balancing as a significant issue in parallel MCE and present a parallel algorithm that uses ‘‘work stealing’’ to dynamically distribute load among processors. Their algorithm is designed for use with MPI, where the user can con-trol the actions of a process and the manner of parallelism to a high degree of detail, when compared with MapReduce. In their algorithm, processes explore tasks in parallel until they run out of work, at which point idle processes request for more work from busy processes (work stealing). This continues until all processes are idle. Such types of work stealing and dynamic load balancing are expensive to implement in the MapReduce model, since the processes are synchronized at each stage of Map and Reduce—for
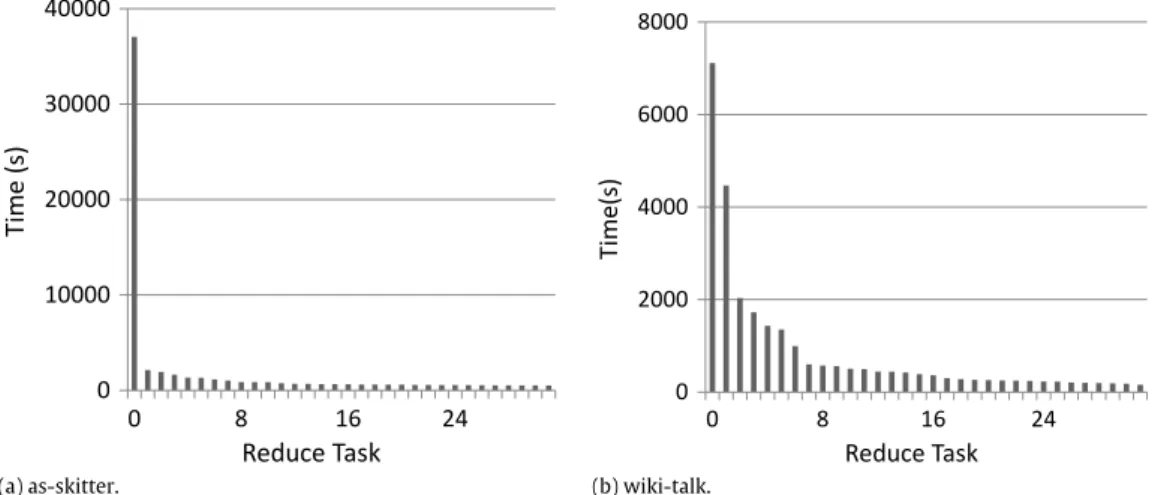
(a) as-skitter. (b) wiki-talk.
Fig. 1. Completion times of reduce tasks for the naïve parallel algorithm, demonstrating poor load balancing. There is one bar for each of 32 reduce tasks, showing the time taken in seconds for the task.
instance, all mappers need to complete before reducers start pro-cessing data. Our algorithm also implements effective load balanc-ing, but in a more pre-determined and static manner.
Wu et al. [43] present an MCE algorithm designed for MapRe-duce. The algorithm splits the input graph into many subgraphs, which are then independently processed to enumerate cliques. However this work does not address load balancing, and in addi-tion, their algorithm may enumerate non-maximal cliques, so that an additional post-processing step is needed to only emit maxi-mal cliques. We compared our algorithm with the algorithm of Wu et al. (which we call as the WYZW algorithm), and present the re-sults in Section5.
dMaximalCliques [30] is another parallel MCE algorithm, based on the sequential algorithm of Tsukiyama et al. [41]. This algorithm works in two phases. The first phase enumerates maximal, du-plicate, and non-maximal cliques, and the second post-processing phase removes duplicate and non-maximal cliques from the out-put. However, this post-processing phase can be very expensive since the output prior to filtering can become much larger than the final output; for instance, on the wiki-talk-3 graph the first enumeration phase takes 7 min (on 20 processors), and the sec-ond post-processing phase takes 228 min (on 80 processors). The algorithm is implemented for the Sector/Sphere [16] framework.
Problems related to MCE. Angel et al. [2] study the problem of dense subgraph maintenance on a dynamic graph defined by an update stream of edges, but their focus is on maintaining cliques, without the constraint that they be maximal. Agarwal et al. [1] also consider dynamic maintenance of dense substructures, but their focus is on subgraphs that are near-cliques (also known as quasi-cliques). Bahmani et al. [3] present multi-pass streaming algorithms for maintaining the densest subgraph in a large graph, and also a MapReduce implementation. Their notion of densest subgraph is a subgraph whose ratio of number of edges to number of vertices is as large as possible, subject to the subgraph having a minimum number of vertices. This problem is different from MCE, since the densest subgraph does not have to be (and is typically not) a clique, let alone a maximal clique.
4. Algorithm
We first discuss a straightforward approach to parallel MCE using MapReduce. For
v
∈
V, letΓ(v)
denote the neighbors ofv
inG, and letGvdenote the subgraph ofGinduced byv
∪
Γ(v)
. The following observation is easy to verify: each maximal cliqueC⊆
Vis also a maximal clique inGvfor any vertex
v
∈
C, and vice versa. A parallel algorithm works as follows: first construct (in parallel)the different subgraphs
{
Gv|
v
∈
V}
and then separately enumerate maximal cliques in each of them using a sequential MCE algorithm, such as the ones in [4,40,13]. The details are as follows.The algorithm takes as input an undirected graph stored as an adjacency list. The adjacency list consists for each vertexu
∈
V, the set of all vertices adjacent tou. During the map phase (described in Algorithm 2), when processing the entry for vertex
v
, the map task will send the tuple⟨
v,
Γ(v)
⟩
to each neighbor ofv
; i.e. the key is a neighbor of the vertex identifierv
, and the value is the neighborhoodΓ(v)
. Thereducetask handling vertexv
(Algorithm 3) will receiveΓ(
u)
from each neighboruofv
, and will construct the subgraphGv. The reduce task then runs a sequential MCE algorithm to enumerate all cliques containingv
inGv. Note that if the input is a list of edges, then the adjacency list can be constructed using a single round of MapReduce.There are three main problems with the straightforward ap-proach.
I. The first is duplication of cliquesin the results. A clique C
with k vertices will be enumerated k times, once for each vertex
v
∈
C. In earlier approaches [43,30], this was handled using a post-processing step that eliminated duplicates. But a post-processing step has two problems; one is that it requires another communication-intensive round of MapReduce. The other is that size of intermediate output, with duplicate cliques, can be much larger than the size of the final output.II. The second is redundant work in computing cliques. The different subgraphs Gv are explored by independent reduce tasks without communication among them, and the work done to enumerate a clique of sizekis repeatedk-fold. This is a major source of inefficiency in parallelization. Note that even if communication were allowed between different tasks exploring the subgraphsGv, it is non-trivial to eliminate this redundant work in clique enumeration.
III. The third is load balancing. This problem arises since the subproblems for different vertices may vastly vary in size. For example, a vertex that is a part of many maximal cliques, or a part of maximal cliques of a relatively large size, will give rise to a more computationally intensive subproblem than a vertex that is part of only a few maximal cliques. Consequently, the distribution of work across subproblems is non-uniform, sometimes to an extreme degree.
To better understand load balance, we implemented the above straightforward algorithm (modified to suppress duplicate maximal cliques) and ran it on several graphs, recording the completion time of each reduce task in each execution. We found that in a typical execution, most reduce tasks finish quickly, while only a few are left running for a long period of time.Fig. 1shows the completion time of the reduce tasks when the algorithm is run
on two different graphs (the wiki-talk and the as-skitter graphs; we refer the reader to Section5for a description of these input graphs). In each case, it can be seen that a single reduce task or a small number of reduce tasks dominate the runtime, so that the load is heavily skewed towards only a few reducers, and the total runtime is not very different from the runtime of a sequential algorithm on a single processor.
The above issues seriously limit the performance of the naive algorithm. We now discuss our approach and how it overcomes these issues.
4.1. Intuition
The key to our approach is an appropriately chosentotal order
among all vertices inV. Let
rank
define a function whose domain is V and which assigns an element from some totally ordered universe to each vertex inV. For u, v
∈
V andu̸=
v
, eitherrank
(
u) >
rank
(v)
orrank
(v) >
rank
(
u)
. The functionrank
implicitly defines a total order among all vertices inV.Eliminating duplicate cliques. Given the
rank
function, Problem I (duplicate cliques) is handled as follows. When a clique C is found by the reduce task for vertexv
,C is output only if∀
u∈
C
,
rank
(v)
≤
rank
(
u)
. i.e.,v
has the smallest rank among all vertices inC. OtherwiseCis simply discarded byv
. Since only one vertex satisfies this condition for each cliqueC, each clique will be output exactly once. This removes the need for post-processing to eliminate duplicates.Eliminating redundant work. However, the above does not as easily solve Problem II (redundant work). Consider a cliqueC that has
k vertices. While the above approach ensures thatC is output only once, it is still computed byk different reduce tasks, and discarded by all but one of them. Eliminating this redundancy is more challenging, especially in a system such as MapReduce, since it is not possible for different reduce tasks to communicate and share state with each other. Our approach to this problem is to use the total ordering on vertices in conjunction with a modification to a sequential algorithm due to Tomita et al. [40], which will allow us to ignore search paths that involve vertices with a smaller value of
rank
. We discuss this further in the following sections.Improving load balance. Let
σ
be a specific ranking function used to order vertices inG. For each vertexv
∈
V, there is a subproblemGv, as defined above. Letζ
vdenote the set of all maximal cliques inGv. With the above approach to reducing redundant work and avoiding duplicates, the reducer responsible for vertexv
(which receivesGvas an input) is not required to enumerate all of
ζ
v. Instead the reducer forv
only has to enumerate those maximal cliquesC∈
ζ
v wherev
is the smallest vertex inC according to the total order induced byσ
. Letζ
v(σ )
⊆
ζ
v be the set of maximal cliquesCsuch that
v
is the smallest vertex inCaccording toσ
;ζ
v(σ)
is the set of maximal cliques that are required to be enumerated from the subproblemGv. A key observation is that we can tailor our sequential algorithm for subproblemGvsuch that it is able to avoid the work done to enumerate cliques that are inζ
vbut not inζ
v(σ)
. As a result of this, the computational cost of subproblemGvdepends on two factors: the number and sizes of cliques in
ζ
v, and the rank ofv
in the total order relative to other vertices inGv. The higher is the rank ofv
in the total order, the fewer cliques inζ
vit is responsible for.In deciding the
rank
function, in order to keep the sizes of subproblems approximately balanced, the intuition is to assign a high value ofrank
for a vertexv
for which|
ζ
v|
is large, and a small value ofrank
if|
ζ
v|
is small. Therefore, we define the ‘‘ideal’’ total order as follows:If|
ζ
u|
>
|
ζ
v|
then u is ranked higher in the total order thanv
. Overall, this increases the work done by vertices with a lower rank (for which the size ofζ
vis small) and decreases thework done by vertices with a larger rank (for which the size of
ζ
v is large), resulting in a more even distribution of work. A difficulty with working with this ideal total order is that computing|
ζ
v|
is an expensive task in itself. It is not reasonable to spend too much effort in computing|
ζ
v|
exactly, since it is only used within an optimization. Instead, we base our ranking of vertices on metrics that are more easily computed, but provide some guidance on the number of cliques a vertex is a part of. We consider the following strategies for approximating the ordering described above.•
TheDegree Orderingis defined through the following function. For vertexv
,rank
(v)
=
(
d, v)
, wheredis the degree ofv
, andv
the vertex identifier. Given two distinct verticesv
1andv
2, andtheir ranks
rank
(v
1)
=
(
d1, v
1)
andrank
(v
2)
=
(
d2, v
2)
:
rank
(v
1) >
rank
(v
2)
if eitherd1>
d2, or ifd1=
d2andv
1> v
2; otherwise,rank
(v
1) <
rank
(v
2)
. Given two vertices,it is easy to evaluate their relative position in the total order, since the degree of each vertex is readily available as the size of the neighbor list of the vertex. One can expect that the higher the degree of
v
, the larger is the size ofζ
v, though this may not always be true.•
TheTriangle Orderingis defined asrank
(v)
=
(
t, v)
, wheretis the number of triangles (cliques of size 3) the vertex is a part of, and
v
is the vertex id. The relative ordering among tuples is defined the same way as in the degree ordering.When compared with the degree ordering, the triangle ordering can be expected to produce a total order that is closer to the ordering produced through the use of
|
ζ
v|
. Hence, it has the advantage that it can be expected to yield better load balance. However, it has the downside that it is an additional overhead to count the number of triangles that a vertex is a part of (another MapReduce task).We also consider two other simple ordering strategies that are agnostic of the number of cliques a vertex is a part of.
•
TheLexicographic Orderingis defined asrank
(v)
=
v
. It is assumed that the vertex ids themselves are unique and are chosen from a totally ordered set.•
TheRandom Orderingis defined asrank
(v)
=
(
r, v)
, wherer is a random number between 0 and 1, and
v
is the vertex id. Note thatris the most significant set of bits, withv
only used as a tiebreaker in the event thervalues of two vertices are equivalent.4.2. Tomita et al. sequential MCE algorithm
PECO uses the Tomita et al. sequential maximal clique enu-meration algorithm (TTT) [40]. The algorithm has a running time of O
(
3n3)
, which is worst case optimal, due to known lower bounds [34]. Although only guaranteed to be optimal in the worst case, in practice, it is found to be one of the fastest on typical inputs. We present a brief description of the TTT algorithm here.TTT is based on the Bron–Kerbosch depth first search algo-rithm [4]. Algorithm 1 shows the
Tomita
recursive function. The function takes as parameters a graphGand the setsK,Cand
, andFini
.Kis a clique (not necessarily maximal), which the function will extend to a larger clique if possible.Cand
is the set{
u∈
V:
u∈
Γ
(v),
∀
v
∈
K}
, or simplyu∈
Cand
must be a neighbor of everyv
∈
K. Therefore, any vertex inCand
could be added toKto make a larger clique.Fini
contains all the vertices which were previously inCand
and have already been used to extend the cliqueK.The base case for the recursion occurs when
Cand
is empty. IfFini
is also empty, thenK is a maximal clique. If not, then a vertex fromFini
could be added toK to form a larger clique. However, each vertex inFini
has already been explored, adding it would re-explore a previously searched path. Therefore, ifFini
isAlgorithm 1:Tomita
(
G,
K,
Cand
,
Fini
)
Input: G- a graph
K- a non-maximal clique to extend
Cand
- the set of vertices that could be used to extendK
Fini
- the set of vertices previously used to extendK1 if
(
Cand
= ∅
)
&(
Fini
= ∅
)
then2 reportKas maximal 3 return
4
pivot
←
u∈
Cand
∪
Fini
that maximizes the intersectionCand
∩
Γ(
u)
5
Ext
←
Cand
−
Γ(
pivot
)
6 forq
∈
Ext
do7 Kq
←
K∪ {
q}
8
Cand
q←
Cand
∩
Γ(
q)
9
Fini
q←
Fini
∩
Γ(
q)
10
Tomita
(G,Kq,Cand
q,Fini
q)11
Cand
←
Cand
− {
q}
12
Fini
←
Fini
∪ {
q}
13 K
←
K− {
q}
non-empty, the function returns without reportingKas maximal. Otherwise, at each level of the recursion, au
∈
Cand
∪
Fini
with the property that it maximizes the size ofΓ(
u)
∩
Cand
is selected to be thepivot
vertex. The setExt
is formed by removingΓ
(
pivot
)
fromCand
. Eachq∈
Ext
is used to extend the current cliqueKby addingqtoKand updating theCand
andFini
sets. These updated sets are then used to recursively call the function. Upon returning,qis removed fromCand
andK, and it is added toFini
. This is repeated for eachq∈
Ext
.Using the vertices from
Ext
instead ofCand
to extend the clique prunes paths from the search tree that will not lead to new maximal cliques. The vertices inΓ(
pivot
)
can be ignored at this level of recursion as they will be considered for extension when processing the recursive call forK∪ {
pivot
}
(for a proof see [40]). One of the key points to note about the TTT algorithm is thatno cliques which contain a vertex in
Fini
will be enumerated by the function.PECOuses this to avoid duplicate enumeration of cliques across reduce tasks.4.3. PECO: parallel enumeration of cliques using ordering
We now provide details of our algorithm. It is assumed that the input is an undirected graphGstored as an adjacency list. For each vertexu, the adjacency list contains the list of vertices adjacent tou. If the input is instead presented as a list of edges, it can be converted into an adjacency list by a single, relatively inexpensive round of Map and Reduce.
Our algorithm consists of a single round of Map and Reduce. Algorithm 2 describes the
map
function ofPECO. The function takes as input a single line of the adjacency list. Upon reading a vertexv
andΓ(v)
, it sends⟨
v,
Γ(v)
⟩
to each neighbor ofv
. This information is enough for the reducer for vertexv
to construct the graphGv.Algorithm 2:PECO Map
(
key
,
value
)
Input:
key
- line number of input filevalue
- an adjacency list entry of the form⟨
v
,Γ(v)
⟩
1
v
←
first vertex invalue
2 Γ
(v)
←
remaining vertices invalue
3 foru
∈
Γ(v)
do 4emit
(
u,
⟨
v
,Γ(v)
⟩
)
Algorithm 3 describes the
reduce
function ofPECO. The reduce task for vertexv
receives as input the adjacency list entry for eachu
∈
Γ(v)
, and constructs the induced subgraphGv. Depending on the ordering selected, the total ordering among vertices inGv is determined (note that in some cases, generating this total order may itself take an additional MapReduce computation, but this does not change the essence of the algorithm). The reduce task then creates the three sets needed to runTomita
:K, the current (not necessarily maximal) clique to extend, begins as{
v
}
, since this task is only required to output cliques that containv
.LetL
(v)
denote the set{
u∈
Γ(v)
|
rank
(
u) <
rank
(v)
}
. Note that the reduce task forv
should not output any maximal clique that contains a vertex fromL(v)
. One way to do this is to enumerate all maximal cliques inGv, and filter out those that contain a vertex fromL(v)
. But this can be expensive, and leads to redundant work, as described in II above.Our approach is to add the entire set of vertices inL
(v)
to theFini
set, so thatTomita
will not search for maximal cliques that contain a vertex fromL(v)
. A subtle point here is that it is not correct to simply delete the verticesL(v)
fromGvand search the residual graph, since this will lead to the enumeration of cliques that may not be maximal inGv, and hence not maximal inG. These steps are described in lines 6–11 of the algorithm below.Algorithm 3:PECO Reduce
(v,
list(
value
))
Input:
v
- enumerate cliques containing this vertexlist(
value
) - adjacency list entries for eachu∈
Γ(v)
1 Gv
←
induced subgraph on vertex setv
∪
Γ(v)
2rank
←
generated according to ordering selected3 K
← {
v
}
4
Cand
←
Γ(v)
5
Fini
← { }
6 foru
∈
Γ(v)
do7 if
rank
(
u) <
rank
(v)
then8
Cand
←
Cand
− {
u}
9
Fini
←
Fini
∪ {
u}
10
Tomita
(
Gv,
K,
Cand
,
Fini
)
4.4. Correctness
We first note that it is easy to verify that thePECOmap function (Algorithm 2) correctly sendsGvto the reduce task responsible for processing vertex
v
.Claim 4.1.The reduce function for vertex
v
(Algorithm3) enumerates every maximal clique C such that(
1) v
is contained in C and(
2)
for every vertex u∈
C ,rank
(v)
≤
rank
(
u)
. Further, no other maximal clique is enumerated by the reduce function forv
.Proof. Note thatGv and a consistent total order on vertices are correctly received as input by the reducer for
v
. LetCbe a maximal clique that satisfies the above two conditions. Sincev
∈
C, the subgraphGvwill containC. Theif
statement in line 7 will never evaluate to true foru∈
Csincev
is the smallest vertex inC. Thus, every vertex inCwill be in theCand
set when a call toTomita
is made. As a result,v
will enumerateC, due to the correctness of theTomita
algorithm. Similarly, it is possible to show that no other maximal clique is output by this reduce function.Claim 4.2.PECO
(
1)
Outputs every maximal clique in G.(
2)
Does not output the same clique more than once.(
3)
Does not output a non-maximal clique.Proof. For (1) and (2). Let
ζ
be the set of all maximal cliques inG. ConsiderC∈
ζ
. FromClaim 4.1,Cis output once by the reducer for vertexv
such thatVis ranked earliest in the total order among all vertices inC. Further,Cis not output by the reducer for any other vertex.Table 1
Statistics of test graphs.
Graph # vertices # edges # cliques Max degree Avg degree
soc-sign-epinion 131,580 711,210 22,067,495 3,558 10.8 loc-gowalla 196,591 950,327 1,005,048 14,730 9.6 soc-slashdot0902 82,168 504,231 642,132 2,552 12.3 soc-epinions 75,879 405,746 1,681,235 3,044 10.7 web-google 875,713 4,322,051 939,059 6,332 9.9 cit-patents 3,774,768 16,518,947 6,061,991 793 8.8 wiki-talk 2,294,385 4,659,565 83,355,058 100,029 3.9 wiki-talk-3 626,749 2,894,276 83,355,058 46,257 9.2 as-skitter 1,696,415 11,095,298 35,102,548 35,455 13.1 as-skitter-3 1,478,016 10,877,499 35,102,548 35,455 14.7 UG100k.003 100,000 14,997,901 4,488,632 380 300 UG1k.30 1,000 149,851 15,112,753 349 299.7
For (3). The reduce task for
v
hasGv, the subgraph induced by{
v
} ∪
Γ(v)
, and outputs all maximal cliques in this subgraph. Consider one such output clique, sayC; we claim thatC is also maximal inG. The proof is by contradiction; suppose thatC was not maximal inG. Then there is a vertexw
̸∈
C that is adjacent to every vertex inC. Then vertexw
∈
Γ(v)
, and hencew
is also present inGv. This implies thatCis not maximal inGv, which is a contradiction.4.5. Analysis
We analyze the communication and memory costs of the algo-rithm.
Communication. The communication cost is equal to the amount of data output by the map tasks, since this data must be sent across the network to the corresponding reduce tasks. Examining the
PECOmap function, it is clear that the adjacency list entry for vertex
v
will be sent to each vertex inΓ(v)
. Let deg(v)
denote the degree ofv
. The communication cost due to transmitting the neighbor list ofv
is proportional to(
deg(v))
2. Hence the total communicationcost is: Comm. Cost
=
Θ
v∈V(
deg(v))
2
.
(1)One way to reduce communication costs is to divide the graph into fewer subgraphs. In contrast with the current method, which makes as many subproblems as the number of vertices, it is possi-ble to divide the graph into fewer overlapping subgraphs, and still apply a similar technique for each individual subgraph, involving ordering of vertices. This will lead to lesser communication; for in-stance, if there is only one subproblem, then the total communica-tion is of the order of the number of edges in the graph. We tried this approach of having fewer subproblems. But there were two issues with this approach: (1) the load balance was worse, and (2) there is a higher overhead to construct the vertex ordering. Overall, it performed much worse than our current algorithm.
Memory. The map function is trivial, and uses memory equal to the size of a single adjacency list entry, which is of the order of the maximum degree of a vertex in the graph. The reduce function for vertex
v
requires space equal to the size of the induced subgraphGv. In the worst case,Gvcan be as large as the input graph, if there is a single vertex that is connected to all other vertices. Fortunately, such cases seldom occur with large graphs, and in typical cases,Gv
is much smaller.
5. Experiments
We ran experiments measuring the performance ofPECOon a Hadoop cluster. The experiments used real-world graphs from the Stanford large graph database [26], as well as synthetic random
Table 2
Clique statistics of test graphs.
Graph Maximum size of a clique Average size of a clique
soc-sign-epinion 94 22.7 loc-gowalla 29 7.4 soc-slashdot0902 27 12.3 soc-epinions 23 9 web-google 44 5.7 cit-patent 11 4.2 wiki-talk-3 26 13.8 as-skitter-3 67 21.1 UG100k.003 4 3 UG1k.30 10 5.8
graphs generated according to the Erdös–Rényi model. The test graphs used are given inTable 1along with some basic properties. The soc-sign-epinion [27], soc-epinion [36], loc-gowalla [9], and soc-slashdot0902 [29] graphs are social networks, where vertices represent users and edges represent friendships. Cit-patents [18] is a citation graph for US patents granted between 1975 and 1999. In the wiki-talk graph [27] vertices represent users and edges represent edits to other users’ talk pages. Web-google [29] is a web graph with pages represented by vertices and hyperlinks by edges. The as-skitter graph [28] is an internet routing topology graph collected from a year of daily traceroutes. For the purpose of clique enumeration, these graphs are all treated as undirected graphs. The wiki-talk-3 and as-skitter-3 graphs are the wiki-talk and as-skitter graphs, respectively, with all vertices of degree less than or equal to 2 removed. Two random graphs are also used in the experiments. UG100k.003 is a random graph with 100,000 vertices and a probability of 0.003 of an edge being present, while UG1k.3 has 1000 vertices and a probability of 0.3.Table 2shows the maximum and average size of the enumerated cliques for every input graph.
The experiments were run on a Hadoop [17,42,39] cluster with 62 HP DL160 compute nodes each with dual quad core CPUs and 16 GB of RAM. Hadoop was configured to use multiple cores so that multiple map or reduce tasks can run in parallel on a single compute node. Note that each reduce task only runs on a single core, so that when we say ‘‘10 reduce tasks’’, the total degree of parallelism (number of cores) in the reduce step is 10. The number of map/reduce tasks that can run on a single compute node can be configured by setting appropriate parameters.
5.1. Comparison of ordering strategies
In order to compare different ordering strategies, each was run on the set of test graphs. To limit the focus to the quality of the orderings produced, the runtimes of different reduce tasks are examined first, ignoring the map and shuffle phases. The different strategies do not vary in their
map
functions and limiting the focus to only the reduce task will remove the impact of network traffic(a) soc-sign-epinion. (b) loc-gowalla.
Fig. 2. A comparison of reduce task completion times between the lexicographic ordering and degree ordering on the soc-sign-epinion and loc-gowalla graphs.
(a) soc-sign-epinion. (b) loc-gowalla.
Fig. 3. A comparison of the total number of maximal cliques emitted by each reducer for the lexicographic ordering and degree ordering on the soc-sign-epinion and loc-gowalla graphs.
Table 3
Completion time (seconds) of the longest reduce task for the combinations of graphs and ordering strategies. ‘‘Lex’’ stands for Lexicographic ordering.
Graph Degree Triangle Random Lex.
soc-sign-epinions 800 784 1843 1615 loc-gowalla 36 29 45 130 soc-slashdot0902 16 16 23 32 soc-epinions 25 21 32 41 web-google 70 65 86 79 cit-patent 64 59 64 63 wiki-talk-3 823 610 2999 7113 as-skitter-3 2091 2326 14009 >37052 UG100k.003 226 223 238 269 UG1k.3 103 101 98 107
on the running times.Table 3shows the completion time of the longest running reduce task for each graph and ordering strategy. It is clear fromTable 3that the degree and triangle orderings are superior to the other two strategies, in their overall impact on the reduce times. This is particularly evident on the more challenging graphs such as soc-sign-epinions, wiki-talk-3, and as-skitter-3 where these orderings see a reduction in time of over 50% when compared to the random or lexicographic orderings.
We note that for graphs where different vertex neighborhoods have a similar structure to each other, the ordering strategy does not matter much. For example, the UG1k.3 graph is a Erdös–Rényi random graph, where different vertices have similar neighbor-hoods. On such graphs, different subproblems are already of a similar size, and such a graph leads similar reducer runtimes,
irrespective of the ordering used. However, on graphs where different neighborhoods are unbalanced, the advantage of the degree and triangle orderings are clear. For example, in the soc-sign-epinions graph, degree and triangle orderings perform much better than lexicographic and random orderings. This graph has different neighborhoods that are unbalanced; to see this, note that the maximum vertex degree is 3558 while the average degree is only 10.8. A similar behavior is observed with the loc-gowalla graph.
Table 4shows the total run time of the algorithm, (i.e. the total time from start to finish, including all map, shuffle, and reduce phases) for each ordering strategy.
When the pre-processing step is also considered, the triangle ordering no longer performs as well as the degree ordering. This is most evident in the wiki-talk-3 and as-skitter-3 completion times, where the map and shuffle phase contribute to a large portion of the total time. As a result, the degree ordering sees the lowest total running times.
5.2. Load balancing
We now present results on the load balancing behavior of different ordering strategies.Fig. 2shows the completion times of different reduce tasks for the degree ordering and the lexicographic ordering on the soc-sign-epinion and loc-gowalla graphs, andFig. 3
shows the number of maximal cliques enumerated by different reducers, for the degree ordering and the lexicographic ordering strategies. For both sets of experiments, we used 8 reducers.
Table 4
Total running times (seconds) for different combinations of graphs and ordering strategies. ‘‘Lex’’ stands for Lexicographic ordering.
Graph # reducers Degree Triangle Random Lex.
soc-sign-epinions 8 840 828 1875 1646 loc-gowalla 8 122 112 211 280 soc-slashdot0902 8 45 50 52 64 soc-epinions 8 55 53 62 70 web-google 8 126 168 144 140 cit-patent 8 113 150 111 109 wiki-talk-3 32 10 667 20465 12229 16647 as-skitter-3 32 8140 17659 20588 >37052 UG100k.003 8 353 503 376 421 UG1k.3 16 135 129 135 136
(a) Degree ordering. (b) Lexicographic ordering.
Fig. 4. Load balancing and time reduction statistics for the soc-sign-epinions graph. It is clear that the distribution of work has better load balance
with the degree ordering than with lexicographic ordering. For in-stance, for the soc-sign-epinion graph (Fig. 3(a)) we see that re-ducer 1 emits about 5 million maximal cliques for lexicographical ordering whereas reducer 8 emits less than 500 thousand maximal cliques, only one tenth of the number that reducer 1 emitted. Sim-ilarly, for the loc-gowalla graph (Fig. 3(b)) with lexicographical or-dering, we note that reducer 1 emits approximately 325 thousand maximal cliques whereas reducer 8 emits only about 70 thousand maximal cliques. Such large differences are not observed when de-gree ordering is used. A similar behavior is observed inFig. 2, which shows that the runtimes of different reducers vary widely for the lexicographic ordering strategy but it is relatively even for the de-gree ordering strategy.
Interestingly, degree ordering also leads to a decrease in the total runtime when compared with lexicographic ordering. So the decrease in runtime is a result of two factors, better load balancing and reduced total work. To evaluate the impact of the two factors, we propose the following measures. The total work for ordering strategy
order
is defined asT(
order
)
=
#Tasksi=1 ti, wheretiis the time taken by reduceri.
To measure load balancing, the first step is to normalize the reduce task running times to determine the proportion of the overall work that each task is responsible for. For reduce taski, let
Pi
(
order
)
represent the proportion of overall workiis responsible for when applying orderingorder
, i.e. Pi(
order
)
=
T(orderti ), and further for each taski, we defineP(
order
)
= {
Pi(
order
)
}
. Then, one way to measure the load balance of an ordering is by the standard deviation of P(
order
)
. Let, L(
order
)
be the load balance of an ordering, defined as:L(
order
)
=
stdev
(
P(
order
))
. Thus, two orderings may have the same load balance but differ in total runtime, because they differ in total work. Alternatively, two orderings may have the same total work, but differ in total runtime, because they differ in load balance.Fig. 4showsTandLfor the degree and lexicographic orderings on the soc-sign-epinions graph. ComparingT
(
deg
)
andT(
lex
)
, it is evident that there is a reduction in enumeration time from lexicographic to degree. Similarly, the degree ordering has a smallerLvalue than lexicographic, indicating a better load balance. Overall, our finding was that on the soc-sign-epinions graph, the degree ordering significantly improves both load balance and enumeration time when compared to the lexicographic ordering. On graph UG1k.3 an improvement is seen in enumeration time, but not in load balancing.5.3. Scalability with number of processors
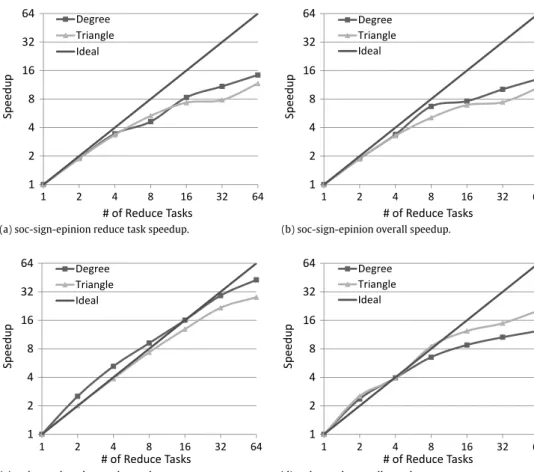
We now present results from experiments on the scalability of PECOwith increasing numbers of processors.PECOis run on several graphs using 1, 2, 4, 8, 16, 32, and 64 reduce tasks.Fig. 5(a) and (c) shows the speedup of the reduce step on the soc-sign-epinions and web-google graphs, respectively. Both graphs show good speedup, with the web-google graph achieving a speedup up of 42 on 64 reduce tasks.Fig. 5(b) and (d) shows the speedup for the two graphs when considering the entire job time. The soc-sign-epinions graph sees little change from the reduce task only graph, as communication costs contribute little to the overall running time. However, the web-google graph sees a larger impact, as the communication cost makes up a larger portion of the total run time. The soc-sign-epinions and web-google graphs are relatively small when compared to the as-skitter graph. In order to better examine the scalability of both the communication and enumeration aspects of the algorithm, the speedup of the degree ordering is examined on the as-skitter-3 graph. Fig. 6(a) shows the speedup of just the reduce tasks. A speedup of 22 with 64 reduce tasks is achieved. When the running time of the entire job is considered (Fig. 6(b)), the speedup increases slightly to 24,
(a) soc-sign-epinion reduce task speedup. (b) soc-sign-epinion overall speedup.
(c) web-google reduce task speedup. (d) web-google overall speedup.
Fig. 5. PECOscalability for the degree and triangle ordering strategies.
(a) as-skitter reduce task speedup. (b) as-skitter overall speedup.
(c) as-skitter reduce and total running times.
(a) loc-gowalla. (b) soc-epinions.
Fig. 7. Runtime analysis ofPECOvs WYZW for different reducer values on various input graphs. Note that the plot is in logarithmic scale.
demonstrating that the communication aspect of the algorithm scales well on large graphs. Fig. 6(c) compares the completion times of the reduce phase to those of the overall running time.
5.4. Comparison with prior work
We implemented the WYZW Algorithm, a parallel algorithm for MCE designed for MapReduce due to Wu et al. [43], and compared its performance with that ofPECO. The WYZW Algorithm divides the input graph into many subgraphs and independently processes each subgraph to enumerate cliques. This can emit non-maximal cliques which have to be filtered away by an additional post-processing step. For these experiments, we used a smaller Hadoop cluster with 50 compute nodes, each a Quad-Core AMD Opteron(tm) Processor 2354 and 8 GB of RAM.
Fig. 7shows the runtimes ofPECOand WYZW when the number of reducers vary from 20 till 120. On the soc-epinions graph with 120 reducers, PECO runs approximately 127 times faster than WYZW, while it is about 42 times faster on 20 reducers, while using the same underlying sequential algorithm for both WYZW andPECO. The advantage ofPECOover WYZW increases with the degree of parallelism (number of reducers). One of the reasons for this is the better load balancing ofPECO, which allows it to use more processors more effectively. With WYZW, there were a few reducers that ran for a long time while the others finished quickly, and the runtime did not get significantly better as the number of reducers was increased.
A similar result was observed with the loc-gowalla graph (see
Fig. 7). Using 120 reducers, other input graphs that were processed byPECOinclude web-google (58 s forPECO), wiki-talk-3 (1013 s), and as-skitter-3 (5930 s). But none of these were completed by WYWZ within 6 h.
6. Conclusion
MCE is an important primitive in mining dense substructures from a graph, with many applications. As a result, sequential enumeration algorithms have been heavily studied. However, as graph sizes have continued to increase, sequential algorithms are no longer sufficient, and a need for parallel algorithms has arisen.
We presentedPECO, a novel parallel algorithm for MCE.PECO
addresses three key issues with parallelizing MCE, load balancing, eliminating redundant work, and eliminating the need for a post processing step. The parallel algorithm uses an appropriately constructed total ordering over the vertices in conjunction with a sequential MCE algorithm; the ordering is used to not only decide which cliques to enumerate within each task, but also to eliminate redundant search paths within the enumeration search tree in the task. By making the ordering sensitive to the size and complexity
of the subgraph assigned to the task, the algorithm improves load balancing. Previous works require post-processing steps to remove duplicate and non-maximal cliques, and do not address the issue of load balancing.
Experiments performed on large real world graphs demonstrate thatPECOcan enumerate cliques in graphs with millions of edges and scales well with the number of processors. A comparison of ordering strategies showed that orderings based on vertex degree and number of triangles perform the best, reducing both enumeration time and improving load balancing.
Acknowledgments
This work was funded in part by the National Science Founda-tion through grants 0834743 and 0831903, and through a gift from Northrop Grumman Corporation. The views and conclusions con-tained in this document are those of the author(s) and should not be interpreted as representing the official policies, either expressed or implied, of the US National Science Foundation or the Northrop Grumman Corporation.
References
[1]M.K. Agarwal, K. Ramamritham, M. Bhide, Real time discovery of dense clusters in highly dynamic graphs: Identifying real world events in highly dynamic environments, The Proceedings of the VLDB Endowment (PVLDB) 5 (10) (2012) 980–991.
[2]A. Angel, N. Koudas, N. Sarkas, D. Srivastava, M. Svendsen, S. Tirthapura, Dense subgraph maintenance under streaming edge weight updates for real-time story identification, VLDB J. (2013) 1–25.
[3]B. Bahmani, R. Kumar, S. Vassilvitskii, Densest subgraph in streaming and mapreduce, The Proceedings of the VLDB Endowment (PVLDB) 5 (5) (2012) 454–465.
[4]C. Bron, J. Kerbosch, Algorithm 457: finding all cliques of an undirected graph, Commun. ACM 16 (1973) 575–577.
[5]F. Cazals, C. Karande, A note on the problem of reporting maximal cliques, Theoret. Comput. Sci. 407 (1–3) (2008) 564–568.
[6]Y. Chen, G.M. Crippen, A novel approach to structural alignment using realistic structural and environmental information, Protein Sci. 14 (12) (2005) 2935–2946.
[7]J. Cheng, Y. Ke, A.W.-C. Fu, J.X. Yu, L. Zhu, Finding maximal cliques in massive networks byh∗-graph, in: Proceedings of the 2010 International Conference
on Management of Data, SIGMOD’10, ACM, 2010, pp. 447–458.
[8]N. Chiba, T. Nishizeki, Arboricity and subgraph listing algorithms, SIAM J. Comput. 14 (1985) 210–223.
[9]E. Cho, S.A. Myers, J. Leskovec, Friendship and mobility: user movement in location-based social networks, in: Proceedings of the 17th ACM SIGKDD International Conference on Knowledge Discovery and Data Mining, KDD’11, ACM, 2011, pp. 1082–1090.
[10]J. Dean, S. Ghemawat, Mapreduce: simplified data processing on large clusters, in: Proceedings of the 6th Conference on Symposium on Opearting Systems Design & Implementation—Volume 6, USENIX Association, 2004, pp. 137–149. [11]J. Dean, S. Ghemawat, Mapreduce: simplified data processing on large clusters,
Commun. ACM 51 (2008) 107–113.
[12] N. Du, B. Wu, L. Xu, B. Wang, X. Pei, A parallel algorithm for enumerating all maximal cliques in complex network, in: Data Mining Workshops, 2006. ICDM Workshops 2006. Sixth IEEE International Conference on, 2006, pp. 320–324. [13]D. Eppstein, M. Loffler, D. Strash, Listing all maximal cliques in sparse graphs in near-optimal time, in: Algorithms and Computation, in: Lecture Notes in Computer Science, vol. 6506, Springer, Berlin, Heidelberg, 2010, pp. 403–414.
[14]S. Ghemawat, H. Gobioff, S.-T. Leung, The google file system, in: Proceedings of the 19th ACM Symposium on Operating Systems Principles, SOSP’03, ACM, 2003, pp. 29–43.
[15]H.M. Grindley, P.J. Artymiuk, D.W. Rice, P. Willett, Identification of tertiary structure resemblance in proteins using a maximal common subgraph isomorphism algorithm, J. Mol. Biol. 229 (3) (1993) 707–721.
[16]Y. Gu, R.L. Grossman, Sector and sphere: the design and implementation of a high-performance data cloud, Phil. Trans. R. Soc. A 367 (1897) (2009) 2429–2445.
[17] Hadoop,http://hadoop.apache.org/.
[18] B.H. Hall, A.B. Jaffe, M. Trajtenberg, The nber patent citation data file: Lessons, insights and methodological tools, Nber Working Papers, National Bureau of Economic Research, Inc. October 2001,
http://ideas.repec.org/p/nbr/nberwo/8498.html.
[19]E. Harley, A. Bonner, Uniform integration of genome mapping data using intersection graphs, Bioinformatics 17 (6) (2001) 487–494.
[20]M. Hattori, Y. Okuno, S. Goto, M. Kanehisa, Development of a chemical structure comparison method for integrated analysis of chemical and genomic information in the metabolic pathways, J. Am. Chem. Soc. 125 (39) (2003) 11853–11865.
[21]D.S. Johnson, M. Yannakakis, C.H. Papadimitriou, On generating all maximal independent sets, Inform. Process. Lett. 27 (3) (1988) 119–123.
[22]P.F. Jonsson, P.A. Bates, Global topological features of cancer proteins in the human interactome, Bioinformatics 22 (18) (2006) 2291–2297.
[23]I. Koch, Enumerating all connected maximal common subgraphs in two graphs, Theoret. Comput. Sci. 250 (1–2) (2001) 1–30.
[24]F. Kose, W. Weckwerth, T. Linke, O. Fiehn, Visualizing plant metabolomic correlation networks using clique-metabolite matrices, Bioinformatics 17 (12) (2001) 1198–1208.
[25]E. Lawler, J. Lenstra, A.R. Kan, Generating all maximal independent sets: Np-hardness and polynomial-time algorithms, SIAM J. Comput. 9 (3) (1980) 558–565.
[26] J. Leskovec, Stanford large network dataset collection,http://snap.stanford. edu/data/index.html (accessed 4.06.12). Downloaded soc-Epinions1.txt.gz, Slashdot0902.txt.gz, Wiki-Talk.txt.gz, cit-Patents.txt.gz, web-Google.txt.gz, as-skitter.txt.gz, soc-sign-epinions.txt.gz, and loc-gowalla_edges.txt.gz. [27]J. Leskovec, D. Huttenlocher, J. Kleinberg, Signed networks in social media,
in: Proceedings of the 28th International Conference on Human Factors in Computing Systems, CHI’10, ACM, 2010, pp. 1361–1370.
[28]J. Leskovec, J. Kleinberg, C. Faloutsos, Graphs over time: densification laws, shrinking diameters and possible explanations, in: Proceedings of the Eleventh ACM SIGKDD International Conference on Knowledge Discovery in Data Mining, KDD’05, ACM, 2005, pp. 177–187.
[29]J. Leskovec, K.J. Lang, A. Dasgupta, M.W. Mahoney, Community structure in large networks: natural cluster sizes and the absence of large well-defined clusters, Internet Math. 6 (1) (2009) 29–123.
[30] L. Lu, Y. Gu, R. Grossman, dmaximalcliques: a distributed algorithm for enumerating all maximal cliques and maximal clique distribution, in: Data Mining Workshops, ICDMW, 2010 IEEE International Conference on, 2010, pp. 1320–1327.
[31]K. Makino, T. Uno, New algorithms for enumerating all maximal cliques, in: Algorithm Theory—SWAT 2004, in: Lecture Notes in Computer Science, vol. 3111, Springer, Berlin, Heidelberg, 2004, pp. 260–272.
[32] N. Modani, K. Dey, Large maximal cliques enumeration in sparse graphs, in: Proceedings of the 17th ACM Conference on Information and Knowledge Management, CIKM’08, 2008, pp. 1377–1378.
[33]S. Mohseni-Zadeh, P. Brézellec, J.-L. Risler, Cluster-c, an algorithm for the large-scale clustering of protein sequences based on the extraction of maximal cliques, Comput. Biol. Chem. 28 (3) (2004) 211–218.
[34]J. Moon, L. Moser, On cliques in graphs, Israel J. Math. 3 (1965) 23–28. [35]G. Palla, I. Derényi, I. Farkas, T. Vicsek, Uncovering the overlapping community
structure of complex networks in nature and society, Nature 435 (7043) (2005) 814–818.
[36]M. Richardson, R. Agrawal, P. Domingos, Trust management for the semantic web, in: The Semantic Web—ISWC 2003, in: Lecture Notes in Computer Science, vol. 2870, Springer, Berlin, Heidelberg, 2003, pp. 351–368. [37]O. Rokhlenko, Y. Wexler, Z. Yakhini, Similarities and differences of gene
expression in yeast stress conditions, Bioinformatics 23 (2) (2007) e184–e190.
[38]M.C. Schmidt, N.F. Samatova, K. Thomas, B.-H. Park, A scalable, parallel algorithm for maximal clique enumeration, J. Parallel Distrib. Comput. 69 (2009) 417–428.
[39] K. Shvachko, H. Kuang, S. Radia, R. Chansler, The hadoop distributed file system, in: 2010 IEEE 26th Symposium on Mass Storage Systems and Technologies, MSST, 2010, pp. 1–10.
[40]E. Tomita, A. Tanaka, H. Takahashi, The worst-case time complexity for generating all maximal cliques and computational experiments, Theoret. Comput. Sci. 363 (2006) 28–42.
[41]S. Tsukiyama, M. Ide, H. Ariyoshi, I. Shirakawa, A new algorithm for generating all the maximal independent sets, SIAM J. Comput. 6 (3) (1977) 505–517. [42]T. White, Hadoop: The Definitive Guide, O’Reilly Media, Inc., 2010.
[43] B. Wu, S. Yang, H. Zhao, B. Wang, A distributed algorithm to enumerate all maximal cliques in mapreduce, in: Frontier of Computer Science and Technology, 2009. FCST’09. Fourth International Conference on, 2009, pp. 45–51.
[44]M.J. Zaki, S. Parthasarathy, M. Ogihara, W. Li, New algorithms for fast discovery of association rules, in: In 3rd Intl. Conf. on Knowledge Discovery and Data Mining, AAAI Press, 1997, pp. 283–286.
[45] Y. Zhang, F. Abu-Khzam, N. Baldwin, E. Chesler, M. Langston, N. Samatova, Genome-scale computational approaches to memory-intensive applications in systems biology, in: Supercomputing, 2005. Proceedings of the ACM/IEEE SC 2005 Conference, 2005, pp. 12–12.
[46]B. Zhang, B.-H. Park, T. Karpinets, N.F. Samatova, From pull-down data to protein interaction networks and complexes with biological relevance, Bioinformatics 24 (7) (2008) 979–986.
Michael Svendsenis a Ph.D. candidate at Iowa State Uni-versity. He received his B.S. in Computer Engineering from Iowa State University in 2011, and his M.S. in Computer Engineering in 2012. He is interested in research on graph data mining.
Arko Provo Mukherjeeis currently a Ph.D. student in Computer Engineering at Iowa State University. He re-ceived his Baccalaureate Degree from National Institute of Technology, Durgapur, India, and worked for 3 years as an application developer at IBM. His research interests are in algorithms for large graph mining and tools for large-scale data analytics.
Srikanta Tirthapurareceived his Ph.D. in Computer Sci-ence from Brown University in 2002, and his B.Tech. in Computer Science and Engineering from IIT Madras in 1996. He is an Associate Professor in the department of Electrical and Computer Engineering at Iowa State Univer-sity. His research is concerned with data-intensive com-puting, stream processing, and distributed computing.