http://msj.sagepub.com/
Multiple Sclerosis Journal
http://msj.sagepub.com/content/17/9/1098
The online version of this article can be found at:
DOI: 10.1177/1352458511404916
2011 17: 1098 originally published online 17 May 2011
Mult Scler
Kappos, Daniel Pelletier, Stephen L Hauser, Paul M Matthews, Frederik Barkhof and Jeroen JG Geurts
Stefan D Roosendaal, Kerstin Bendfeldt, Hugo Vrenken, Chris H Polman, Stefan Borgwardt, Ernst W Radue, Ludwig
Grey matter volume in a large cohort of MS patients: relation to MRI parameters and disability
Published by:
http://www.sagepublications.com
can be found at: Multiple Sclerosis Journal
Additional services and information for
http://msj.sagepub.com/cgi/alerts Email Alerts: http://msj.sagepub.com/subscriptions Subscriptions: http://www.sagepub.com/journalsReprints.nav Reprints: http://www.sagepub.com/journalsPermissions.nav Permissions:
What is This?
- May 17, 2011
OnlineFirst Version of Record
- Aug 16, 2011
Version of Record
Grey matter volume in a large cohort of
MS patients: relation to MRI parameters
and disability
Stefan D Roosendaal
1, Kerstin Bendfeldt
2, Hugo Vrenken
1,
Chris H Polman
1, Stefan Borgwardt
2, Ernst W Radue
2,
Ludwig Kappos
2, Daniel Pelletier
3, Stephen L Hauser
3,
Paul M Matthews
4,5, Frederik Barkhof
1and Jeroen JG Geurts
1Abstract
Background:Although grey matter damage in multiple sclerosis is currently recognized, determinants of grey matter volume and its relationship with disability are not yet clear.
Objectives: The objectives of the study were to measure grey and white matter volumes across different disease phenotypes; identify MRI parameters associated with grey matter volume; and study grey and white matter volume as explanatory variables for clinical impairment.
Methods:This is a cross-sectional study in which MRI data of 95 clinically isolated syndrome, 657 relapsing–remitting, 125 secondary-progressive and 50 primary-progressive multiple sclerosis patients from three centres were acquired. Grey and white matter volumes were determined, together with T2 and T1 lesion volumes. Physical disability was assessed with the Expanded Disability Status Scale, cognitive impairment with the Paced Auditory Serial Addition Task. Data were analysed using multiple regression.
Results: Grey matter volume was lower in relapsing–remitting patients (mean [SD]: 0.80 [0.05] L) than in clinically isolated syndrome patients (0.82 [0.05] L), and even greater relative atrophy was found in secondary-progressive patients (0.77 [0.05] L). In contrast, white matter volume in secondary-progressive patients was comparable to that in relapsing– remitting patients. Grey matter volume was the strongest independent predictor of physical disability and cognitive impairment, and was associated with both T2 and T1 lesion volume.
Conclusions:Our findings show that grey matter volume is lower in secondary-progressive than in relapsing–remitting disease. Grey matter volume explained physical and cognitive impairment better than white matter volume, and is itself associated with T2 and T1 lesion volume.
Keywords
Cognitive decline, grey matter, multiple sclerosis, volumetric MRI
Date received: 11th December 2010; revised: 21st February 2011; accepted: 27th February 2011
Introduction
Multiple sclerosis (MS), a disease commonly diagnosed in the prime of life and often leading to chronic disabil-ity, has until recently been regarded as a typical white matter (WM) disease. This has changed, however, with the introduction of new immunohistochemical staining procedures, which showed that grey matter (GM) demyelination and axonal loss were frequent and abundant.1,2
Clinically, cortical damage is of importance because MRI-visible focal demyelination in the WM cannot
1
VU University Medical Centre, The Netherlands. 2University Hospital Basel, Switzerland.
3University of California San Francisco, USA.
4Department of Clinical Neurosciences, Imperial College London, UK. 5GalxoSmithKline, Clinical Imaging Centre, London, UK.
Corresponding author:
Stefan D Roosendaal, VU University Medical Centre, Department of Radiology, PO Box 7057, 1007 MB Amsterdam, The Netherlands Email: [email protected]
Multiple Sclerosis Journal 17(9) 1098–1106 !The Author(s) 2011 Reprints and permissions:
sagepub.co.uk/journalsPermissions.nav DOI: 10.1177/1352458511404916 msj.sagepub.com
explain the entire array of clinical impairment in MS patients. GM atrophy was significantly associated with physical disability3,4 and with cognitive decline.5,6 To what extent GM atrophy explains disability better than focal WM (or GM) lesions or than WM atrophy has not yet been clearly investigated in patient samples that are representative of the total MS population.
In vivo imaging of focal GM demyelination has been challenging, despite the use of advanced MRI tech-niques7,8and higher field strengths,9and many cortical GM lesions remain undetected on conventional MRI.10 Besides visualization of focal cortical lesions, quantita-tive MR techniques like diffusion tensor imaging (DTI),11 magnetization transfer imaging12 and MR spectroscopy13 have been applied to image the ‘normal appearing’ GM (as defined with MRI). Atrophy measures are regarded to be the most robust quantitative measures for structural damage in MS.14
While it has been suggested that accumulation of demyelination and neuro-axonal damage in the GM occurs secondarily to WM tract damage,15 a number of studies now indicate that an independent and partly overlapping occurrence of GM and WM damage may be more likely.16,17This may also be true for primary-pro-gressive MS (PPMS).3 In a seminal histopathological study of acute relapsing–remitting (RR), secondary-pro-gressive (SP) and PP MS cases, the evolution of grey matter damage over subsequent disease stages was recently illustrated: although GM atrophy exists already early in the disease, it becomes much more prominent in progressive MS.16 In vivo, the finding of grey matter atrophy in early MS cases, with a significant and dispro-portionate increase in patients with more advanced dis-ease, has also been shown.3,18In contrast, WM atrophy showed a relatively constant accrual over time.19
These interesting in vivo findings require further investigation. This in particular accounts for clinically isolated syndrome (CIS) patients in comparison to the other MS patient groups, because previous studies included either CIS patients with a non-representative disease duration of over 20 years18or a small sample of seven CIS patients.19Furthermore, a comparison with a PPMS patient group has not been made. A large cohort of over 900 MS patients, including representa-tive CIS, RR, SP and PP patients, prospecrepresenta-tively assessed through the GeneMSA consortium,20provided the opportunity to further investigate the relationship between disease progression and brain volume. More specifically, we test the hypotheses that decreased GM volumes and not WM volumes are a characteristic of progressive MS, and that it explains clinical disability better. Additionally, we investigate putative MRI deter-minants of GM volume.
Materials and methods
Subjects
Patients were recruited from three clinical centres par-ticipating in the GeneMSA consortium: the VU University Medical Centre in Amsterdam; the University Hospital in Basel; and the University of California San Francisco (UCSF). CIS patients were defined as those with a first neurological event lasting longer than 48 hours and involving optic nerve, spinal cord, brainstem, or cerebellum, with at least two hyperintense lesions present on the T2-weighted MR image. Patients with a diagnosis of clinically definite MS21 were classified either as RRMS, SPMS, defined by at least six months of worsening neuro-logical disability not explained by clinical relapse, or PPMS, defined by progressive clinical worsening for more than 12 months from disease onset with-out any relapses and the presence of more than two oligoclonal bands or an elevated IgG index in the cerebrospinal fluid (CSF). A group of progressive relapsing patients was excluded from the current anal-ysis because of its small size (n¼12). Patients with a clinical relapse or glucocorticosteroids treatment within the month previous to enrolment were excluded. The concomitant use of disease modifying therapies (DMTs) for MS was permitted. In all included subjects, disability was assessed with the Expanded Disability Status Scale (EDSS)22 and the Paced Auditory Serial Addition Task (PASAT),23and brain MRI scans were performed. The study protocol was approved by the institutional ethics review boards of the clinical centres and all patients gave written informed consent prior to participation.
Magnetic resonance imaging protocol
MR imaging was performed on two 1.5 T MR systems (Amsterdam: Siemens Vision; Basel: Siemens Avanto) and one 3.0 T MR system (UCSF: GE Excite). For brain volume measurement, 3D-T1 images were acquired (TR: 7–20.8 ms; TE: 2–4 ms; TI: 300–400 ms), consisting of isotropic 111 mm3 voxels. Additionally, dual echo proton density (PD)-T2-weighted images (TR: 2000–4000 ms; TE: 14–20/80–108 ms), with interleaved axial 3.0 mm-thick slices and an in-plane resolution of 1.01.0 mm2 or 0.50.5 mm2 (UCSF), were acquired. Lastly, post-contrast T1-weighted spin-echo images (TR: 467–650 ms; TE: 8–17 ms; axial 3.0 mm-thick slices with an in-plane resolution of 1.01.0 mm2 or 0.90.9 mm2 [UCSF]) were obtained.
MRI measurements
Brain volume analyses were performed at the Image Analysis Centre in Amsterdam. SIENAX24 (version 2.2) from the FMRIB Software Library was used to esti-mate normalized grey matter volume (NGMV) and nor-malized white matter volume (NWMV). For this purpose, SIENAX registers each individual scan to MNI-152 standard space, using the skull as a scaling constraint. The volumetric scaling factor is then used to correct GM and WM volumes obtained from the automated tissue segmentation, to volumes normalized for head size. Scans of all subjects and the resulting segmentation maps were visually inspected for scan quality (such as noise, artefacts and tissue contrast) and segmentation quality (tissue misclassification), respectively.
Marking and measurement of focal WM lesions was performed at the University Hospital in Basel, using commercial semi-automatic software (AMIRA 3.1.1; Mercury Computer Systems Inc.). T2 hyperintense lesions and T1 hypointense lesions (black holes) were manually outlined on the PD images and on post con-trast T1-weighted spin-echo images, respectively. Subsequently, volumes were calculated for these lesion categories.
Statistical analysis
Statistical analyses in this study were performed using SPSS version 15.0 for Windows (SPSS, Chicago, USA). Comparisons of the demographical data between the disease types were made using the Mann–Whitney U
test or the Student’s t-test when appropriate. Values are reported as mean [SD], unless indicated otherwise. Statistically adjusted brain volumes are specifically referred to as ‘adjusted volumes’. Statistical models in this paper were always adjusted for centre.
We examined disease type differences for NGMV and NWMV using two multiple regressions adjusting for age, sex and centre. The adjusted means were pair-wise compared between the disease types; both post-hoc Bonferroni corrected and the p-values without Bonferroni correction are provided. Possible effects of centre were further explored by performing additional multiple regression analyses separately for each centre. Associations between NGMV and the other vari-ables were assessed, statistically adjusting for centre. Subsequently, an explanatory multiple linear regression model for NGMV was constructed by entering the other MRI variables together and removing them one by one using manual backward stepwise exclusion until the remaining variables were significant atp<0.1. This multiple linear regression model was adjusted for age, sex, disease duration and centre, and it was repeated for
the disease types separately. A high correlation of rho¼0.9 existed between T2 lesion volume and T1 hypointense lesion volume. To avoid collinearity in the models T2 lesion volume and T1 hypointense lesion volume were separately used in the multiple regression models, whereby it is not possible to estab-lish their relative strength. Before entering the regres-sion models, T2 and T1 hypointense leregres-sion volumes were transformed to improve normality using the log-arithm with base 10 (logT2LV and logT1LV).
The relative predictive value of GM and WM brain volumes, together with logT2LV, on EDSS and on PASAT was assessed using ordinal logistic regression and multiple linear regression, respectively. Again, this was done separately for each variable adjusting for centre, and subsequently by entering the independent variables together and removing them one by one using manual backward stepwise exclusion until the remain-ing MRI variables were significant at p<0.1. For this purpose, EDSS was categorized into four classes:<2.0;
2.0 and<4.0;4.0 and<6.0;6.0. Odds ratios (ORs) resulting from the ordinal logistic regression are reported per standard deviation for each independent variable. PASAT was transformed to normality using a square-root transformation (sqrtPASAT). Similar to the multiple regression model used for NGMV, age, sex, disease duration and centre were included as covariates for the EDSS and PASAT models. The regression models were repeated for each disease type separately.
To rule out that the final models were biased by the phenomenon called ‘pseudo-atrophy’, all model analy-ses were repeated without the patients who started their DMT within one year before the investigation.
Results
Patient descriptives
A total of 977 MS patients with CIS, RR, PP or SP disease type were included in the study. Slightly more than half of the patients were enrolled at UCSF; Amsterdam and Basel contributed equally. The descrip-tive data provided in Table 1 account for the 927 patients (95%) for whom reliable brain volume measurements could be obtained. The majority of these patients had an RR disease type (657 patients; 70.9%); there were 125 (13.5%) SP patients, 95 (10.2%) CIS patients and 50 (5.4%) PP patients. In Amsterdam, relatively more progressive patients were included compared with the other sites, whereas 80 of the 95 CIS patients were from UCSF. DMT (Avonex, Rebif, Betaseron or Copaxone) was received by 450 (48.7%) out of the total of 927 patients; 105 patients had started their DMT within the year before the investigation.
Clinical disease types and brain volumes
Whereas NGMV and NWMV were not significantly different between patients from Amsterdam (NGMV: 0.77 [0.06] L; NWMV: 0.78 [0.06] L) and Basel (NGMV: 0.77 [0.07] L; NWMV: 0.78 [0.05] L), mean NGMV of patients from UCSF was significantly higher (0.83 [0.06] L; p<0.001) and mean NWMV signifi-cantly lower (0.69 [0.04] L;p<0.001) compared with the other two sites.
In all centres, NGMV values were lower in RRMS patients than in CIS patients, further decreasing in SPMS patients (Figure 1A). While NWMV also dif-fered significantly between CIS patients and RRMS patients, it did not differ between RRMS and SPMS patients (Figure 1B). The NGMV adjusted for age, sex and centre (Figure 1C) was highest in CIS (0.82 [0.05] L), decreasing in RR (0.80 [0.05] L) and PP (0.80 [0.05] L), and further decreasing in SP patients (0.77 [0.05] L). Post-hoc pair-wise comparisons showed significance surviving Bonferroni’s correction between all disease subtypes, except for PP vs. RR and CIS patients. Bonferroni correctedp-values are as follows (without Bonferroni correction): CISvs. RR: 0.05 (0.008); CIS
vs.PP: 0.5 (0.08); CIS vs. SP:<0.001 (<0.001); PP vs.
SP: 0.006 (0.001); RRvs.SP:<0.001 (<0.001); RRvs.
PP: 1.0 (0.7). Adjusted NWMV was also highest in CIS patients (0.77 [0.05] L), in the other disease types the adjusted NWMV had the same value and SD (0.75 [0.05] L). Differences in NWMV were significant sur-viving Bonferroni’s correction between CISvs.RR, and
CISvs.SP (Figure 1D). Bonferroni corrected p-values are as follows (without Bonferroni correction): CISvs.
RR: 0.005 (0.001); CIS vs. PP: 0.3 (0.05); CIS vs. SP: 0.03 (0.005); PPvs. SP: 1.0 (0.5); RRvs. SP: 1.0 (0.7); RRvs.PP: 1.0 (0.3). The analyses repeated for the cen-tres separately showed similar results; importantly, in each centre adjusted NGMV of SP patients is signifi-cantly lower than that of RR patients, whereas in none of the centres does adjusted NWMV differ significantly between these disease types.
Predictors of GM volume
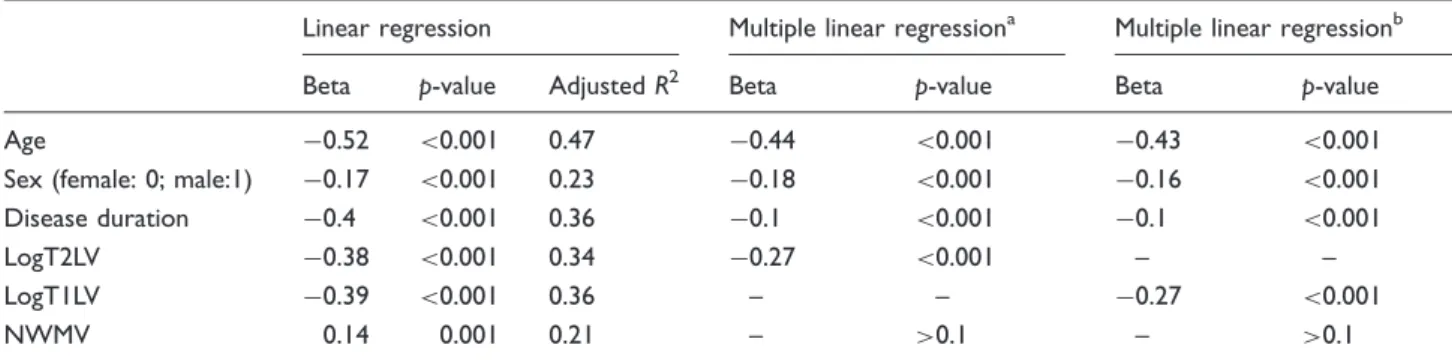
NWMV, logT2LV and logT1LV were each significantly associated with NGMV (Table 2). Multiple regression analysis (Table 2) revealed that, after adjusting for age, gender, disease duration and centre, logT2LV was a significant explanatory MRI variable of NGMV (beta: 0.27; p<0.001). The multiple regression model with logT1LV instead of logT2LV did not differ substantially. NWMV was not included in the model, because its p-value was higher than 0.1. The model accounted for 59% (adjusted R2¼0.59) of the variance in NGMV. Subsequent analyses for the dis-ease types separately showed no substantial differences.
Predictors of disability
Associations between EDSS and MRI variables (Table 3) were significant for both NGMV and NWMV, as well as for logT2LV and logT1LV. In the
Table 1. Disease type descriptives
CIS RR SP PP
N(% of total patient group) 95 (10.2) 657 (70.9) 125 (13.5) 50 (5.4) Mean age, years (SD)a 41.8 (9.4) 42.1 (9.8) 50.0 (13.5) 50.4 (8.4)
Male:female ratio 1: 1.8 1: 2.5 1: 1.4 1: 0.9
Proportion originating from UCSF/BAS/AMS 0.84/0.10/0.06 0.53/0.26/0.21 0.33/0.33/0.34 0.28/0.24/0.48 Mean disease duration, years (SD)b 2.2 (3.3) 10.0 (8.0) 18.9 (9.0) 10.3 (8.4) Mean EDSS (SD)c 1.3 (1.0) 2.2 (1.4) 5.2 (1.4) 4.8 (1.6) Median PASAT (IQR)d 51 (45–56) 49 (40–56) 43.5 (33.3–51) 50.5 (38.3–55) Median T2 lesion volume, ml (IQR)e 0.8 (1.4–2.2) 2.3 (0.8–6.1) 4.0 (1.8–12.6) 1.7 (0.5–4.8)
Median T1 black hole volume, ml (IQR)f 0.3 (0–0.9) 0.7 (0.2–2.2) 1.7 (0.5–5.5) 0.4 (0.1–1.5) No. of patients on DMT (%) 28 (29.5) 373 (56.9) 46 (36.8) 3 (6.0)
Significant differences between groups (p<0.05): aCISvs. (SP, PP), RRvs. (SP, PP)
bCISvs. (RR, SP, PP), SPvs. (PP, RR) cCISvs. (SP, PP), RRvs. (SP, PP)
d,e,fBetween all groups except between RR and PP
CIS: clinically isolated syndrome, RR: relapsing–remitting, SP: secondary-progressive, PP: primary-progressive, EDSS: Expanded Disability Status Scale, PASAT: Paced Auditory Serial Addition Task, UCSF: San Francisco, BAS: Basel, AMS: Amsterdam, SD: standard deviation, IQR: interquartile range.
multiple ordinal regression model (Nagelkerke’s
R2¼0.40), NGMV was the strongest MRI predictor of EDSS (OR: 0.67; p<0.001), logT2LV was a weaker predictor (Table 3). A similar model was obtained with logT1LV instead of logT2LV. The OR of NGMV can also be expressed as an odds increase of 1.49 in having greater disability per 1 SD smaller NGMV. NWMV was excluded from the model, because its p-value was higher than 0.1. Subsequent analyses for each disease type showed that in the RR
patient group all MRI variables were included in the final model with NGMV being the strongest predictor, whereas in the other disease types none of the MRI variables were retained.
Also for the PASAT, correlations with all MRI var-iables (Table 4) were significant. The multiple linear regression model had an adjusted R2of 0.11 and con-tained NGMV as the strongest predictor (Table 4, beta: 0.19; p<0.001), and contained NWMV as well (beta: 0.11; p¼0.02). LogT2LV was (just) not significant in
Figure 1. A. NGMV is shown for each disease type and each centre. In each centre, NGMV can be seen to be lower in RR
patients than CIS patients, and to further decrease in SP patients. B. NWMV is shown for each disease type and each centre. C. NGMV is shown here, adjusted for age, sex and centre. Comparisons that are significant after Bonferroni correction are indi-cated by: **p<0.001; *p<0.01. D. The NWMV adjusted for age, sex and centre is shown here. Comparisons that are significant after Bonferroni correction are indicated by: **p<0.001; *p<0.01. CIS: clinically isolated syndrome, RR: relapsing–remitting, SP: secondary-progressive, PP: primary-progressive, SF: San Francisco, AMS: Amsterdam, BAS: Basel.
the multiple regression model, whereas logT1LV was a significant predictor (beta:0.07;p¼0.05). Subsequent analyses showed that in both the RR and the SP cohorts NWMV and NGMV are retained in the final multiple regression model, with NGMV as the stron-gest predictor. In contrast, in the PPMS group the mul-tiple regression model contained only logT2V, and in the CIS group none of the MRI variables were retained. Results of all of the above-described model analyses did not change materially when the 105 patients who started their DMT less than one year before the inves-tigation were excluded.
Discussion
Our cross-sectional study, involving a large cohort of CIS, RR, SP and PP patients, shows that in contrast to
WM volume, GM volume is significantly lower in sec-ondary-progressive MS than in relapsing–remitting MS. Moreover, GM volume explains physical disability and cognitive impairment, as measured by the EDSS and the PASAT respectively, better than WM volume. BothT2 and T1 hypointense lesion volumes in the WM were better MRI predictors of GM volume than WM volume.
Cortical involvement has been demonstrated even in the early phase of MS and was related to conversion from CIS to clinically definite MS.25,26 Demyelination of axons in the GM was shown in both RRMS and acute MS,16 although it is more prominent in later, chronic progressive stages. Recent studies demon-strated that the progression of GM atrophy over time is much larger than the progression of WM atro-phy.18,19 Although cross-sectional, our results support
Table 3. (Multiple) ordinal regression for EDSS, adjusted for centre
Ordinal regression Multiple ordinal regressiona Multiple ordinal regressionb
PE OR p-value R2 PE OR p-value PE OR p-value
Age 0.72 2.05 <0.001 0.32 0.31 1.36 <0.001 0.32 1.37 <0.001 Sex (female: 0; male: 1) 0.26 1.30 0.05 0.21 – – >0.1 – – >0.1 Disease duration 0.80 2.23 <0.001 0.34 0.48 1.62 <0.001 0.43 1.53 <0.001 NGMV 0.87 0.42 <0.001 0.34 0.40 0.67 <0.001 0.35 0.70 0.001 NWMV 0.29 0.75 <0.001 0.22 – – >0.1 – – >0.1 LogT2LV 0.44 1.55 <0.001 0.25 0.15 1.16 0.06 – – – LogT1LV 0.53 1.70 <0.001 0.27 – – – 0.23 1.25 0.003 a
LogT2LV is used as the single lesion variable in the model because of the collinearity problem. b
LogT1LV is used as the single lesion variable. When centre was the only independent variable, Nagelkerke’sR2was 0.21. Nagelkerke’sR2of both final multiple ordinal regression models was 0.40.
EDSS: Expanded Disability Status Scale, PE: parameter estimate, OR: odds ratio, NGMV: normalized grey matter volume, NWMV: normalized white matter volume, LogT2LV: normal-transformed T2 lesion volume, LogT1LV: normal-transformed T1 lesion volume
PE and OR are reported per standard deviation for each independent variable, except for sex, where the OR of 1.30 indicates a lower EDSS in females compared with males.
Table 2. (Multiple) linear regression for NGMV, statistically adjusted for centre
Linear regression Multiple linear regressiona Multiple linear regressionb
Beta p-value AdjustedR2 Beta p-value Beta p-value
Age 0.52 <0.001 0.47 0.44 <0.001 0.43 <0.001 Sex (female: 0; male:1) 0.17 <0.001 0.23 0.18 <0.001 0.16 <0.001 Disease duration 0.4 <0.001 0.36 0.1 <0.001 0.1 <0.001
LogT2LV 0.38 <0.001 0.34 0.27 <0.001 – –
LogT1LV 0.39 <0.001 0.36 – – 0.27 <0.001
NWMV 0.14 0.001 0.21 – >0.1 – >0.1
a
LogT2LV is used as the single lesion variable in the model because of the collinearity problem. b
LogT1LV is used as the single lesion variable. When centre was the only independent variable,R2was 0.20. AdjustedR2-values of both final models were 0.59.
NGMV: normalized grey matter volume, NWMV: normalized white matter volume, LogT2LV: normal-transformed T2 lesion volume, LogT1LV: normal-transformed T1 lesion volume.
these findings in a large group of patients. An interest-ing and more novel aspect of our study is the inclusion of patients with PPMS. They appear to have higher GM volume, but a similar low WM volume, compared with SPMS patients. Interestingly, in contrast to RRMS and SPMS patients, NGMV is not a significant predictor for PASAT in PPMS patients.
The pathological substrate of GM atrophy as mea-sured with in vivo MRI is largely unknown. Clues that GM atrophy may mostly be based on neuronal and glial damage come from a post mortem study,27 in which strict regional associations between cortical demyelination and atrophy were not found. Relations between GM atrophy and T2 lesion volume have been reported previously,3,28 and in our study T2 lesion volume was an independent predictor of NGMV. Although this finding may be an argument for the hypothesis that GM damage results from damage to WM tracts, an equally likely possibility is that GM atrophy and T2 lesion volume occur independently but mirror the general disease process in certain phases of the disease. Unfortunately, our data did not allow a distinction between the effect of T1 hypointense and T2 lesions on GM volume.
GM volume explained physical disability as sured by the EDSS and cognitive impairment, mea-sured by the PASAT, better than WM volume or T2 lesion volume. Associations between GM volume and EDSS scores have been reported by several previous studies.19,29,30The PASAT measures working memory and sustained attention, and is often used as a measure of cognitive impairment in MS.31,32 Our finding that GM volume is the strongest predictor of both physical disability and cognitive impairment emphasizes the clinical relevance of GM damage. This has also been
recognized in recent longitudinal studies investigating atrophy as well as cortical lesions.33,34 Unfortunately, MR sequences to specifically investigate cortical lesions, such as double inversion-recovery (DIR), have not been acquired in our study.
Now that it is becoming increasingly clear that MS involves not only inflammatory demyelination but also substantial and early neurodegeneration, new neuro-protective and reparative treatments are sought. Clinical trials necessary for these treatments rely on imaging markers as surrogate outcomes.35 Although whole-brain atrophy has proven to be a reproducible and sensitive marker of disease it lacks pathological specificity. GM atrophy may be a more specific marker of neurodegenerative processes, as it accrues faster with progressing disease, than WM atrophy.19 Furthermore, GM atrophy could be a more specific marker than WM atrophy,36since it has been suggested to be less influenced by the so-called pseudo-atrophy phenomenon,37 which may occur supposedly by the lessening of oedema when interferon or corticosteroid therapy is initiated.38 In our study, this potential nui-sance was not likely to have an effect, because our results did not change when patients who started inter-feron therapy within one year of the investigation were excluded. Furthermore, none of our patients used cor-ticosteroids in the month prior to the investigation.
Measurement of brain volume using SIENAX has been shown to be consistent across centres39and is rel-atively insensitive to different MR systems of the same field strength. In our study, NWMV was lower and NGMV was higher in patients from UCSF when com-pared with those of patients from the other two sites. A 3 T MR system was used at UCSF and 1.5 T MR systems were used in the other two centres; this field
Table 4. (Multiple) linear regression for PASAT, adjusted for centre
Linear regression Multiple linear regressiona Multiple linear regressionb
Beta p-value AdjustedR2 Beta p-value Beta p-value
Age 0.22 <0.001 0.06 0.05 0.23 0.06 0.16 Sex 0.06 0.07 0.02 0.07 0.03 0.08 0.02 Disease duration 0.26 <0.001 0.08 0.14 <0.001 0.13 0.001 LogT2LV 0.15 <0.001 0.03 – >0.1 – – LogT1LV 0.19 <0.001 0.05 – – 0.07 0.05 NWMV 0.19 <0.001 0.03 0.11 0.02 0.09 0.05 NGMV 0.28 <0.001 0.08 0.19 <0.001 0.15 0.002 a
LogT2LV is initially used as the single lesion variable because of the collinearity problem, but is not in the final model becausep>0.1. b
LogT1LV is used as the single lesion variable in this model. When centre was the only independent variable,R2was 0.01. The adjustedR2of both final models was 0.11.
PASAT: Paced Auditory Serial Addition Task, NGMV: normalized grey matter volume, NWMV: normalized white matter volume, logT2LV: normal-transformed T2 lesion volume, logT1LV: normal-normal-transformed T1 lesion volume.
strength difference may be responsible. The trend within centres was the same and the between-centre differences were limited as much as possible by correct-ing all models in our study for centre effects; neverthe-less these effects are still likely to have been of influence. Some studies have reported that frontal and temporal cortical areas may exhibit more severe pathology than others.40–42Such regional atrophy or thickness studies might have the advantage of an increased sensitivity, since the results are not hindered by cortical areas that do not suffer from damage. However, post mortem studies indicate that in advanced disease the cortex is globally affected, up to 68% of the cortical area;16therefore it may well be that regional GM mea-sures do not have added value in the progressive phase. A limitation of our study was that discrimination between cortical and deep GM volumes was not made. In addition to cortical GM atrophy, recent stud-ies have shown that deep GM structures,43such as the thalamus, and mixed WM–GM structures such as the hippocampus, are involved in MS. The relation between deep GM atrophy and cortical GM atrophy remains to be elucidated, as well as the accrual of deep GM atrophy over the disease types. Another potential limitation of our study is that we did not adjust for lesion misclassification. In the automated segmentation process some of the WM lesions may have been mis-classified as CSF or as GM, which can result in too low WM and too high GM volume estimates. However, since our results are opposing the effect one would expect from WM lesion misclassification, i.e. GM volume is further decreased in SPMS, our results are unlikely to be false-positive due to this phenomenon.
In conclusion, our study has shown that, in a large group of MS patients, GM pathology in (secondary) progressive MS is clearly dominant of WM volume loss. In addition, we have shown that GM volume explains clinical disability better than WM volume, and is itself better predicted by T2 or T1 hypointense lesion volume than WM volume. These findings are important for our understanding of MS and for future clinical trial design.
Acknowledgements
The authors would like to thank all people involved in the GeneMSa consortium.
Funding
GlaxoSmith&Kline sponsored data acquisition of the multi-national GeneMSA study, but were not involved in data interpretation for the current research.
Conflict of interest statement None declared.
References
1. Bo L, Vedeler CA, Nyland HI, Trapp BD and Mork SJ. Subpial demyelination in the cerebral cortex of multiple sclerosis patients. J Neuropathol Exp Neurol 2003; 62: 723–732.
2. Peterson JW, Bo L, Mork S, Chang A and Trapp BD. Transected neurites, apoptotic neurons, and reduced inflammation in cortical multiple sclerosis lesions. Ann Neurol2001; 50: 389–400.
3. De Stefano N, Matthews PM, Filippi M, Agosta F, De Luca M, Bartolozzi ML, et al. Evidence of early cortical atrophy in MS: relevance to white matter changes and disability.Neurology2003; 60: 1157–1162.
4. Tedeschi G, Lavorgna L, Russo P, Prinster A, Dinacci D, Savettieri G, et al. Brain atrophy and lesion load in a large population of patients with multiple sclerosis.
Neurology2005; 65: 280–285.
5. Rudick RA, Lee JC, Nakamura K and Fisher E. Gray matter atrophy correlates with MS disability progression measured with MSFC but not EDSS.J Neurol Sci2009; 282: 106–111.
6. Amato MP, Portaccio E, Goretti B, Zipoli V, Battaglini M, Bartolozzi ML, et al. Association of neocortical volume changes with cognitive deterioration in relaps-ing–remitting multiple sclerosis. Arch Neurol 2007; 64: 1157–1161.
7. Geurts JJ, Pouwels PJ, Uitdehaag BM, Polman CH, Barkhof F and Castelijns JA. Intracortical lesions in mul-tiple sclerosis: improved detection with 3D double inver-sion-recovery MR imaging.Radiology2005; 236: 254–260. 8. Bagnato F, Butman JA, Gupta S, Calabrese M, Pezawas L, Ohayon JM, et al. In vivo detection of cortical plaques by MR imaging in patients with multiple sclerosis.AJNR Am J Neuroradiol2006; 27: 2161–2167.
9. Geurts JJ, Blezer EL, Vrenken H, van der Toorn A, Castelijns JA, Polman CH, et al. Does high-field MR imaging improve cortical lesion detection in multiple scle-rosis?J Neurol2008; 255: 183–191.
10. Geurts JJ, Bo L, Pouwels PJ, Castelijns JA, Polman CH and Barkhof F. Cortical lesions in multiple sclerosis: combined postmortem MR imaging and histopathology.
AJNR Am J Neuroradiol2005; 26: 572–577.
11. Vrenken H, Pouwels PJ, Geurts JJ, Knol DL, Polman CH, Barkhof F, et al. Altered diffusion tensor in multiple sclerosis normal-appearing brain tissue: cortical diffusion changes seem related to clinical deterioration. J Magn Reson Imaging2006; 23: 628–636.
12. Cercignani M, Bozzali M, Iannucci G, Comi G and Filippi M. Magnetisation transfer ratio and mean diffu-sivity of normal appearing white and grey matter from patients with multiple sclerosis. J Neurol Neurosurg Psychiatry2001; 70: 311–317.
13. Chard DT, Griffin CM, McLean MA, Kapeller P, Kapoor R, Thompson AJ, et al. Brain metabolite changes in cortical grey and normal-appearing white matter in clinically early relapsing–remitting multiple sclerosis.
Brain2002; 125: 2342–2352.
14. Miller DH, Barkhof F, Frank JA, Parker GJ and Thompson AJ. Measurement of atrophy in multiple
sclerosis: pathological basis, methodological aspects and clinical relevance.Brain2002; 125: 1676–1695.
15. Henry RG, Shieh M, Amirbekian B, Chung S, Okuda DT and Pelletier D. Connecting white matter injury and tha-lamic atrophy in clinically isolated syndromes.J Neurol Sci2009; 282: 61–66.
16. Kutzelnigg A, Lucchinetti CF, Stadelmann C, Bruck W, Rauschka H, Bergmann M, et al. Cortical demyelination and diffuse white matter injury in multiple sclerosis.Brain
2005; 128: 2705–2712.
17. Bo L, Geurts JJ, van der Valk P, Polman C and Barkhof F. Lack of correlation between cortical demyelination and white matter pathologic changes in multiple sclerosis.
Arch Neurol2007; 64: 76–80.
18. Fisniku LK, Chard DT, Jackson JS, Anderson VM, Altmann DR, Miszkiel KA, et al. Grey matter atrophy is related to long term disability in multiple sclerosis.Ann Neurol2008; 64: 247–254.
19. Fisher E, Lee JC, Nakamura K and Rudick RA. Gray matter atrophy in multiple sclerosis: a longitudinal study.
Ann Neurol2008; 64: 255–265.
20. Baranzini SE, Wang J, Gibson RA, Galwey N, Naegelin Y, Barkhof F, et al. Genome-wide association analysis of susceptibility and clinical phenotype in multiple sclerosis.
Hum Mol Genet2009; 18: 767–778.
21. Polman CH, Reingold SC, Edan G, Filippi M, Hartung HP, Kappos L, et al. Diagnostic criteria for multiple scle-rosis: 2005 revisions to the ‘McDonald Criteria’. Ann Neurol2005; 58: 840–846.
22. Kurtzke JF. Rating neurologic impairment in multiple sclerosis: an expanded disability status scale (EDSS).
Neurology1983; 33: 1444–1452.
23. Gronwall DM. Paced auditory serial-addition task: a measure of recovery from concussion. Percept Mot Skills1977; 44: 367–373.
24. Smith SM, Zhang Y, Jenkinson M, Chen J, Matthews PM, Federico A, et al. Accurate, robust, and automated longitudinal and cross-sectional brain change analysis.
Neuroimage2002; 17: 479–489.
25. Dalton CM, Chard DT, Davies GR, Miszkiel KA, Altmann DR, Fernando K, et al. Early development of multiple sclerosis is associated with progressive grey matter atrophy in patients presenting with clinically iso-lated syndromes.Brain2004; 127: 1101–1107.
26. Calabrese M, Atzori M, Bernardi V, Morra A, Romualdi C, Rinaldi L, et al. Cortical atrophy is relevant in multi-ple sclerosis at clinical onset. J Neurol 2007; 254: 1212–1220.
27. Wegner C, Esiri MM, Chance SA, Palace J and Matthews PM. Neocortical neuronal, synaptic, and glial loss in mul-tiple sclerosis.Neurology2006; 67: 960–967.
28. Furby J, Hayton T, Altmann D, Brenner R, Chataway J, Smith KJ, et al. Different white matter lesion character-istics correlate with distinct grey matter abnormalities on magnetic resonance imaging in secondary progressive multiple sclerosis.Mult Scler2009; 15: 687–694. 29. Chen JT, Narayanan S, Collins DL, Smith SM,
Matthews PM and Arnold DL. Relating neocortical
pathology to disability progression in multiple sclerosis using MRI.Neuroimage2004; 23: 1168–1175.
30. Charil A, Dagher A, Lerch JP, Zijdenbos AP, Worsley KJ and Evans AC. Focal cortical atrophy in multiple sclerosis: relation to lesion load and disability.
Neuroimage2007; 34: 509–517.
31. Chiaravalloti ND and DeLuca J. Cognitive impairment in multiple sclerosis.Lancet Neurol2008; 7: 1139–1151. 32. Rogers JM and Panegyres PK. Cognitive impairment in
multiple sclerosis: evidence-based analysis and recom-mendations.J Clin Neurosci2007; 14: 919–927.
33. Calabrese M, Agosta F, Rinaldi F, Mattisi I, Grossi P, Favaretto A, et al. Cortical lesions and atrophy associ-ated with cognitive impairment in relapsing–remitting multiple sclerosis.Arch Neurol2009; 66: 1144–1150. 34. Calabrese M, Rinaldi F, Mattisi I, Grossi P, Favaretto A,
Atzori M, et al. Widespread cortical thinning character-izes patients with MS with mild cognitive impairment.
Neurology2010; 74: 321–328.
35. Barkhof F, Calabresi PA, Miller DH and Reingold SC. Imaging outcomes foar neuroprotection and repair in multiple sclerosis trials.Nat Rev Neurol2009; 5: 256–266. 36. Horakova D, Cox JL, Havrdova E, Hussein S, Dolezal O, Cookfair D, et al. Evolution of different MRI mea-sures in patients with active relapsing–remitting multiple sclerosis over 2 and 5 years: a case-control study.J Neurol Neurosurg Psychiatry2008; 79: 407–414.
37. Zivadinov R, Reder AT, Filippi M, Minagar A, Stuve O, Lassmann H, et al. Mechanisms of action of disease-mod-ifying agents and brain volume changes in multiple scle-rosis.Neurology2008; 71: 136–144.
38. Hardmeier M, Wagenpfeil S, Freitag P, Fisher E, Rudick RA, Kooijmans M, et al. Rate of brain atrophy in relaps-ing MS decreases durrelaps-ing treatment with IFNbeta-1a.
Neurology2005; 64: 236–240.
39. Jasperse B, Valsasina P, Neacsu V, Knol DL, De Stefano N, Enzinger C, et al. Intercenter agreement of brain atro-phy measurement in multiple sclerosis patients using manually-edited SIENA and SIENAX. J Magn Reson Imaging2007; 26: 881–885.
40. Sailer M, Fischl B, Salat D, Tempelmann C, Schonfeld MA, Busa E, et al. Focal thinning of the cerebral cortex in multiple sclerosis.Brain2003; 126: 1734–1744. 41. Morgen K, Sammer G, Courtney SM, Wolters T,
Melchior H, Blecker CR, et al. Evidence for a direct asso-ciation between cortical atrophy and cognitive impair-ment in relapsing–remitting MS. Neuroimage 2006; 30: 891–898.
42. Bendfeldt K, Kuster P, Traud S, Egger H, Winklhofer S, Mueller-Lenke N, et al. Association of regional gray matter volume loss and progression of white matter lesions in multiple sclerosis – a longitudinal voxel-based morphometry study.Neuroimage2009; 45: 60–67. 43. Tao G, Datta S, He R, Nelson F, Wolinsky JS and
Narayana PA. Deep gray matter atrophy in multiple scle-rosis: a tensor based morphometry. J Neurol Sci 2009; 282: 39–46.