HIGH TEMPERATURE CREEP-FATIGUE BEHAVIOR OF ALLOY 617 AND ALLOY 230
BY XIANG CHEN
DISSERTATION
Submitted in partial fulfillment of the requirements for the degree of Doctor of Philosophy in Nuclear Engineering
in the Graduate Collage of the
University of Illinois at Urbana-Champaign, 2012
Urbana, Illinois Doctoral Committee:
Professor James F. Stubbins, Chair Associate Professor Brent J. Heuser Associate Professor Jian Ku Shang Professor Rizwan Uddin
ii
ABSTRACT
The Very High Temperature Reactor (VHTR) is one of the Gen-IV reactor design concepts which embody a common goal of providing safe, longer lasting, proliferation-resistant, and economically viable nuclear energy. One of the biggest challenges in the research and development of Gen-IV reactor systems is the performance and reliability issues involving structural materials for both in-core and out-of-core applications.
Currently, Ni-based superalloy alloy 617 (Inconel 617) and alloy 230 (Haynes 230) are considered as the leading metallic candidate materials for applications in the VHTR because of their favorable mechanical properties at elevated temperatures. The major damage mechanism for materials used in the VHTR is predicted to be creep-fatigue damage, which arises due to startup and shutdown or power transients during normal operation. The mechanism of synergic interaction between creep and fatigue is not well understood and there are no effective modeling methods for predicting the creep-fatigue life of both alloys at present. To better understand and address these issues, Low Cycle Fatigue (LCF) and creep-fatigue tests of alloy 617 and alloy 230 were conducted in this study. Creep-Fatigue life prediction methods, such as linear damage summation and frequency-modified tensile hysteresis energy modeling, were evaluated. In addition, various microanalysis techniques were used to identify the underlying damage mechanism of alloy 617 and alloy 230 under LCF and creep-fatigue tests. The experiment and analysis results lead to the following conclusions:
1. Under all LCF test conditions, alloy 230 performed slightly better than alloy 617. 2. Compared to the LCF results, the cycles to failure for both materials were reduced
iii
life than alloy 617. It was also found that longer hold time at the maximum tensile strain would cause a further decrease in both materials creep-fatigue life.
3. The linear damage summation failure criterion was able to predict the creep-fatigue life of alloy 617 for limited test conditions, but considerably underestimated the creep-fatigue life of alloy 230. In contrast, frequency-modified tensile hysteresis energy modeling showed promising results.
4. Creep-fatigue test conditions tended to transform the transgranular cracking mode observed in LCF tests of both materials to intergranular cracking mode especially for the creep-fatigue tests with longer dwell time at peak tensile strain. Moreover, alloy 230 demonstrated better resistances to intergranular cracking than alloy 617 under the fatigue deformation. For both materials, additional creep damage in creep-fatigue testing was also manifested by material interior intergranular cracking.
5. During the LCF tests, the deformation tended to concentrate in the original grain boundary (GB) region especially for tests done at higher total strain range. The localized deformation near original GB region was enhanced for both materials during creep-fatigue tests due to the additional creep deformation and grain boundary sliding process incurred at the strain hold period.
6. Similar to the case of Stress Corrosion Cracking (SCC), oxidation-assisted crack propagation along GB promoted intergranular cracking of alloy 617 and resulted in faster crack growth rate in the creep-fatigue test of alloy 617 at small total strain range.
7. The higher volume fraction of carbide precipitates and better oxidation resistance of alloy 230 contributed to its dominance in LCF and creep-fatigue life over alloy 617.
iv
8. GB cellular precipitation formed by discontinuous precipitation reaction in alloy 230 might have a deleterious effect on the LCF and creep-fatigue properties of alloy 230 and can be avoided by appropriate heat treatment and chemistry control to further improve the mechanical properties of alloy 230.
v
ACKNOWLEDGEMENTS
The work was supported by the U.S. Department of Energy (DOE) grants DE-FC07-07ID14819 and NEUP 09-516. The microstructural analysis was carried out in part in the Frederick Seitz Materials Research Laboratory Central Facilities, University of Illinois. The remaining microanalysis was carried out in the Shared Research Equipment (ShaRE) User Facility at Oak Ridge National Laboratory (ORNL) which is supported by the Scientific User Facilities Division of the Office of Science, U.S. DOE.
I would like to acknowledge the following individuals for their help during the long process. First, many thanks to my advisor, Prof. Stubbins, who gave me lots of advice and encouragement. Without his patience and support, it would be very difficult, if not impossible, for me to accomplish this study. My appreciations also go to the committee members for the final exam of my doctoral degree: Prof. Uddin, Prof. Heuser, and Prof. Shang. I appreciate their time and efforts to make this study better. I am also grateful to my colleague, Dr. Mo and Hsiao-Ming Tung, who shared much of their research experience with me and we had numerous meaningful discussions together.
Thanks to Dr. Sokolov, Dr. Sham, Dr. Tan, Dr. Nanstad, and Dr. Busby from ORNL, who provided funding support and coaching advice during my stay at ORNL. I also would like to acknowledge Eric Manneschmidt, Christopher Stevens, and Dr. Erdman III from ORNL for their technical support for my work.
Special thanks to Dr. Yang from Institute of Metal Research of Chinese Academy of Science for his help with some TEM experiments aimed for future studies.
vi
I am also thankful for Dr. Wright and Dr. Carroll from Idaho National Laboratory for providing alloy 617 for testing and Dr. White from Haynes International Inc. for providing alloy 230 for testing.
Finally, I would like to express my gratitude to my wife, Wenzhe Su, who always accompanies me with support and love.
vii
TABLE OF CONTENTS
CHAPTER 1 : INTRODUCTION ...1
CHAPTER 2 : LITERATURE REVIEW ...4
CHAPTER 3 : EXPERIMENTAL...33 CHAPTER 4 : RESULTS ...44 CHAPTER 5 : DISCUSSION ...141 CHAPTER 6 : CONCLUSIONS ...161 REFERENCE ...164 APPENDIX A: ABBREVIATIONS...171
1
CHAPTER 1: INTRODUCTION
The VHTR is a Gen-IV reactor concept which uses a graphite-moderated nuclear reactor with a once-through uranium fuel cycle. Helium gas is proposed as the leading candidate for the coolant used in this type of reactor. In order to maintain its economic advantage over early generation reactor systems, the VHTR has a goal of utilizing helium at temperatures higher than 900 ºC and pressures up to 7 MPa for a design life of 60 years [1-2]. Besides producing electricity, the high operation temperatures of the VHTR enable applications such as process heat and hydrogen production via the thermochemical cycle. Figure 1.1 illustrates the layout and application of the VHTR for hydrogen production. In this case, the heat generated in the reactor core is transferred to the hydrogen production plant via the heat exchanger. Despite these benefits of the VHTR, the high temperatures and high neutron dose of the VHTR impose tremendous challenges to materials used in this reactor system. For instance, most commercial reactors in operation today hardly see a coolant temperature higher than 350 ºC [3]. Murty et al. identified that to be suitable for the VHTR application structural materials should possess the following characteristics [3]:
1) Dimensional stability against thermal and irradiation creep, void swelling, etc.
2) Favorable mechanical properties at elevated temperatures such as tensile strength, ductility, creep resistance, fatigue strength, etc.
3) Desirable resistance to radiation damage under high neutron doses, helium embrittlement, etc.
2
Currently, Ni-based superalloy alloy 617 and alloy 230 are considered as the leading metallic candidate materials for applications in the VHTR because of their favorable mechanical properties at elevated temperatures. The major damage mechanism for materials used in the VHTR is predicted to be creep-fatigue damage, which arises due to startup and shutdown or power transients during normal operation. In particular, it was found that the allowable number of cycles of the materials (fatigue life) was significantly reduced when hold times at peak tensile strain (creep damage) was introduced. The current database regarding the mechanical properties of both alloys, especially creep-fatigue data, is incomplete. The mechanism of synergic interaction between creep and fatigue is not well understood and there are no effective modeling methods for predicting the creep-fatigue life of both alloys at present. To better understand and address these issues, LCF and creep-fatigue tests of alloy 617 and alloy 230 were conducted in air at 850 ºC. Tests were performed with fully reversed axial strain control at a total strain range of 0.5% to 1.5% and hold time at maximum tensile strain from 3 to 30 min. Creep-Fatigue life prediction methods, such as linear damage summation and frequency-modified tensile hysteresis energy modeling, were evaluated. In addition, various microanalysis techniques, including Scanning Electron Microscopy (SEM), Energy-dispersive X-ray Spectroscopy (EDS), and Electron Backscattered Diffraction (EBSD), were used to identify the underlying damage mechanism of alloy 617 and alloy 230 under LCF and creep-fatigue tests.
3
Figures
4
CHAPTER 2 : LITERATURE REVIEW
In this chapter, literature review is given to cover topics such as material properties of alloy 617 and alloy 230, existing experimental results of the creep-fatigue behavior of both materials, prediction method of the creep-fatigue life, microstructural features associated with high temperature creep-fatigue deformation of alloy 617 and alloy 230, and applications of EBSD in materials science.
2.1 Materials Properties of Alloy 617 and Alloy 230
2.1.1 Alloy 617
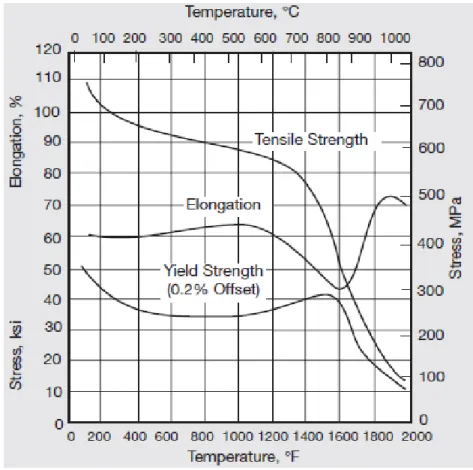
Alloy 617 is a Ni-based superalloy developed by Special Metals Corporation. Table 2.1 shows the chemical composition of this alloy [4]. It is a solid-solution strengthened, nickel-chromium-cobalt-molybdenum alloy with an exceptional combination of high-temperature strength and oxidation resistance. The high nickel and chromium contents make the alloy resistant to a variety of both reducing and oxidizing media. The aluminum together with chromium provides oxidation resistance at high temperatures. Solid-solution strengthening is caused by cobalt and molybdenum. The three-dimensional etched microstructure of the material is illustrated in Figure 2.1 which shows bands of carbide stringers and grain structure [5]. The fine grains are close to the carbide stringers and coarse grains are between the carbide stringers. Alloy 617 has favorable mechanical properties over a wide range of temperatures. One of this alloy’s outstanding characteristics is its ability to maintain high strength level at elevated temperatures. As shown in Figure 2.2, yield strength of solution-anneal, hot-rolled rod is nearly constant from room temperature to 850 ºC. Alloy 617 also exhibits exceptionally high levels of creep-rupture strength, even at temperatures of 980 ºC and above, as
5
manifested in Figure 2.3. The superior high temperature creep strength, in conjunction with good resistance to oxidizing and carburizing atmospheres, makes this alloy especially suitable for long-term, high-stress use at elevated temperatures. The LCF life of as-received alloy 617 is given in Figure 2.4 for reference. [6]
2.1.2 Alloy 230
As a competing material of alloy 617, alloy 230 is developed by Haynes International Corporation with lower cobalt content and higher tungsten content. As shown in Table 2.2, alloy 230 is a solid-solution strengthening nickel-chromium-tungsten-molybdenum alloy [7]. Similar to alloy 617, the nickel content together with chromium in alloy 230 imparts great resistance to high temperature corrosion in various environments. Addition of rare earth element lanthanum further improves oxidation resistance. Tungsten and molybdenum combined with carbon in alloy 230 are largely responsible for the strength of the material. In addition, optimized ductility and creep resistance in alloy 230 are achieved by controlling the boron content in the alloy [8-9]. The typical microstructure of alloy 230 in the solution-annealed condition is shown in Figure 2.5 [10]. Small tungsten-rich M6C carbides dispersing inside the matrix and twinning boundaries are frequently found. Table 2.3 summarizes the creep performance of alloy 230 at different temperatures which is comparable to alloy 617. Alloy 230 also exhibits excellent LCF properties at elevated temperatures shown in Figure 2.6.
2.2 Experimental Results of the Creep-Fatigue Behavior of Alloy 617 and Alloy 230
Based on experience gained with plants operating at high temperatures, materials are subject to both a high temperature environment and temperature-induced cyclic strains arising during startup and shutdown or power transients [11]. The resulting
6
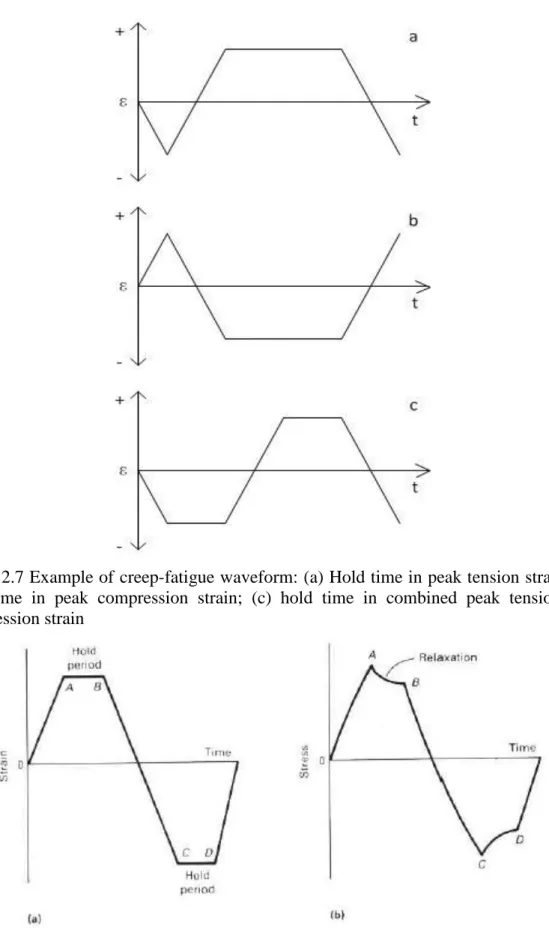
damage mechanism is called creep-fatigue which is the primary deformation mechanism expected for structural materials in the VHTR. To simulate and study the creep-fatigue damage in materials, strain controlled LCF tests with hold time in peak tension strain or compression strain or combined case are usually used. Figure 2.7 illustrates the wave form for the aforementioned three cases, respectively [12]. Figure 2.8 shows the normal stress response during the strain hold period [13]. The combined creep-fatigue action adversely affects the mechanical properties of structural materials, resulting in a much shorter component life compared to the sum of creep damage and fatigue damage incurred separately [14]. For instance, a pronounced reduction in fatigue life was found in alloy 617 and alloy 230 when hold time was introduced into LCF tests. Figure 2.9 shows that irrespective of the position of hold at peak strain in a cycle, the hold time always reduced the fatigue life in comparison with pure fatigue tests of alloy 617 [15]. Similar observations were found in alloy 230 in which the fatigue life of tests with hold time reduced dramatically with respect to the fatigue life of continuous cycling tests at all of the total strain range as shown in Figure 2.10 [10]. In addition, the position of hold at peak strain could also influence the creep-fatigue life. There is no definitive conclusion about what position of hold at peak strain is most dangerous, but for the austenitic stainless steels tensile holds were found to be most detrimental to the fatigue life followed by either compression hold or tension-plus-compression hold [13]. Figure 2.11 illustrates this conclusion where hold period in only the compression portion of the cycle led to a slight reduction in fatigue resistance and a slightly greater reduction was observed when hold periods were used in both the tension and compression portions of the cycle. A significant reduction was observed for a hold period in only the tension
7
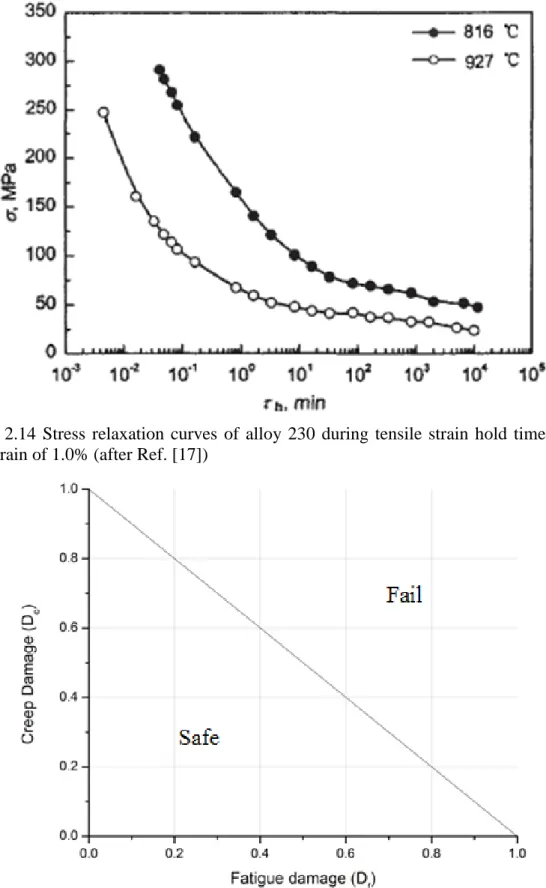
portion of the cycle. Since alloy 617 and alloy 230 have the same Face-centered Cubic (FCC) crystal structure as austenitic stainless steels, similar creep-fatigue response could be found for these two alloys. Indeed, Figure 2.9 demonstrates that holding only in the tension portion of the cycle led to extensive material damage and drastically reduced fatigue life for alloy 617. Besides, the length of hold time also has a strong influence on the material fatigue life as shown in Figure 2.9 for alloy 617 and Figure 2.12 for alloy 230. The fatigue life showed a monotonic decrease with increasing hold time and in some cases hold time effect would saturate, namely no future reduction in fatigue life with additional increase in the hold time [16]. During the hold time, stress relaxation is usually found as shown in Figure 2.13 and Figure 2.14 for alloy 617 and alloy 230, respectively [16-17]. The stress relaxation results in the development of creep strain, and increases the accumulated strain in the crack-tip region. This would cause intergranular crack growth and accelerate the propagation of fatigue crack, leading to shorter fatigue life [14]. The underlying reason for the reduced fatigue life in creep-fatigue testing is rather complex. In general the fatigue life is influenced by the following factors: test temperature, test environment, the fatigue waveform, the imposed total strain range, and the duration of hold time, etc.
2.3 Prediction Method of the Creep-Fatigue Life of Alloy 617 and Alloy 230
The cyclic behavior of materials at high temperatures is more complicated than its low-temperature equivalent, because both the creep and fatigue component of the cycle cause material damage [18]. There are a large number of competing theories for explaining the causes of creep/fatigue interaction and how to predict it. A review paper from Halford has listed many of these theories [19]. In this section, one of those theories,
8
called linear damage summation, is described, since it is the simplest and earliest approach and more importantly it has been adopted by a few design codes, such as French Code RCC-MR, ASME N47, and British R5 [18]. In addition, the frequency-modified tensile hysteresis energy modeling method is introduced as an alternative creep-fatigue life prediction method.
2.3.1 Linear damage summation
Linear damage summation assumes that damage, irrespectively whether it results from creep or fatigue, is cumulative in a linear fashion. The failure criterion of linear damage summation is given by:
Df Dc total damage (Equation 2.1) where the total damage is usually assumed to be equal to one. Df is the damage caused by fatigue and Dc is the creep damage. The fatigue damage can be calculated as [20]: f f N D N (Equation 2.2)
in which N are cycles to failure in the creep-fatigue test and Nf are cycles to failure in the LCF test with same test conditions as the creep-fatigue test. The creep damage which is introduced during the strain hold period is equal to:
( ) 0 0
( )
o o N t t c r rd
t
D
dN
t
t
(Equation 2.3) where t is the creep time at certain stress level, ( )tr is the creep rupture time at the stress of , dt is the incremental time interval at instantaneous stress , and No is the instantaneous cycle number. During the strain hold period, stress relaxation is obvious and materials are subject to varying stress levels. Therefore for one creep-fatigue cycle9
with a strain hold period of to, the creep damage is equal to the integration of ( )
t r
d
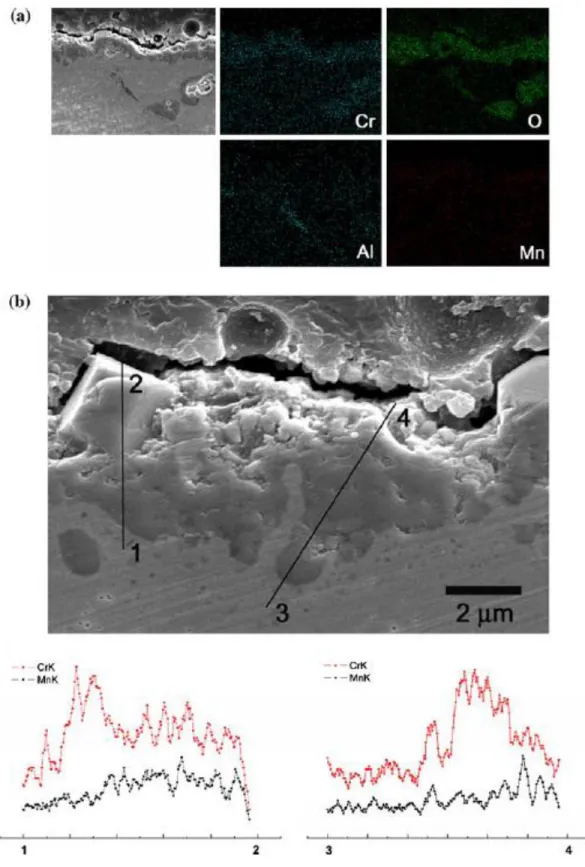
t over time to. The total creep damage should be summed over all the creep-fatigue cycles N . The failure criterion can be represented by a straight line on the creep/fatigue interaction diagram, as shown in Figure 2.15. Linear damage summation works reasonably well for some alloys, such as Incoloy 800H. However for other cases, creep rupture in the presence of cyclic load, or fatigue failure under slow cycling or with a hold period, can both occur at damage fractions considerably less than one. Figure 2.16 illustrates this situation for stainless steel 316 from the work of Campbell [20]. To account for this synergic interaction between creep and fatigue, some design codes, such as ASME N47, replace the straight failure line with a concave bilinear line as a conservative lower bound on experimental data for some materials, such as stainless steel 316 and 304 [18]. The red bilinear line in Figure 2.16 illustrates this case approximately. The draft code for alloy 617 also recommends (0.1, 0.1) as the deflection point for the bilinear line in the creep/fatigue interaction diagram, which further reduces the already low allowable stress level for alloy 617 in the VHTR and imposes huge challenge from a structural designer’s point of view. Hence a more accurate method is needed for predicting the creep/fatigue interaction.
2.3.2 Frequency-modified tensile hysteresis energy
In this model the tensile hysteresis energy is postulated as a measure of fatigue damage and can be calculated as [21-22]:
Uin Tin (Equation 2.4) where Uin--- tensile hysteresis energy per cycle;
10 --- numerical constant;
T--- maximum tensile stress of the cycle; in--- inelastic strain range of the cycle.
Mathew et al. used the form 1/ (1n') for alloy 230 where n' is the cyclic strain hardening exponent and can be obtained from the equation describing the cyclic stress-strain behavior [23-24]: 1 ( ) 2 2 2 n E K (Equation 2.5)
in which is total strain range, is stress range, E is material’s young’s modulus, and K is cyclic strength coefficient. By employing pure LCF tests, all the parameters on the right hand side of Equation 2.4 can be obtained and hence Uin can be calculated. The relationship between the fatigue life and tensile hysteresis energy can be expressed by a power law similar to the Coffin-Manson equation:
Uin (Nf) C1
(Equation 2.6) where and C1 are material constants. Based on the LCF tests which give the value of
in U
and Nf , and C1 can be obtained via a linear fitting of Equation 2.6. When creep is introduced into a LCF test, such as a creep-fatigue test, the time-dependent damage needs to be taken into account. Therefore a frequency modified term is introduced into Equation 2.6 yielding:
1 2 ( k ) in f U N C (Equation 2.7) where k and C2 are material constants and v is given by 1/ ( c h). c is the time for continuous cycling and h is the hold time per cycle. k and C2 can be obtained by
11
conducting some benchmarking creep-fatigue tests and then Equation 2.7 can be applied for predicting creep-fatigue life Nf using Uin and v as input.
2.4 Microstructural Characterization of Creep-Fatigue Damage in Alloy 617 and Alloy 230
2.4.1 Surface interaction
Because of high temperatures and extended operational periods, materials subjected to creep-fatigue conditions also experience degradation due to corrosion phenomena, such as oxidation, decarburization. Figure 2.17 shows surface oxidation on alloy 617 tested in air. There were external oxide scales formed on specimens; beneath the external scale a zone of internal oxidation along GB was also observed. In addition, cracks initiated at oxidized GB; a typical secondary crack initiated at surface oxide is also shown in Figure 2.17. For alloy 230, Kim et al. found that a duplex oxide structure, composed of outer MnCr2O4 and inner Cr2O3, formed on the material surface as shown in Figure 2.18. The formation of MnCr2O4 prevented the oxygen from penetrating into the Cr2O3 layer, consequently reducing the oxidation rate of alloy 230 compared with alloy 617 at the same test condition [25].
2.4.2 Fracture morphology
The fatigue process consists of two phases: crack initiation and crack propagation. There are three possible fracture modes, namely transgranular, intergranular, and mixed inter/trans-granular, for the two phases. As shown in Figure 2.19, Bhanu Sankara Rao et al. discovered that in creep-fatigue testing of alloy 617 when the tensile hold time was increased from 1 min to greater than 10 min, crack initiation mode changed from transgranular to intergranular [15]. Further, a fairly large number of GB cracks formed in
12
the interior of the specimens for tensile hold periods of longer than 1 min. Similar observations were found in alloy 230, too. Lu et al. noticed that the introduction of a hold time and/or the increase of the test temperature tended to change the fracture mode from transgranular to mixed, and then to intergranular for alloy 230 [14]. Figure 2.20 illustrates the change of the fracture mode with increasing tensile dwell time. Since increasing hold time means more creep damage is imposed to the material and intergranular cracking is a manifestation of the creep damage, the observed change of fracture mode seems reasonable.
2.4.3 Cavitation
Besides changing the fracture mode, creep damage during the strain hold period manifests itself by causing cavities inside the materials. For instance, the carbide stringers in alloy 617 became sites for cavity initiation when tensile hold periods were introduced into the test as shown in Figure 2.21 [16]. High cavity densities were found ahead of large cracks and the degree of cavitation qualitatively increased with dwell time. This is probably due to the strain accumulation ahead of the crack tip and more pronounced creep damage with increasing hold time.
2.5 Applications of EBSD in Materials Science
EBSD has experienced rapid acceptance in metallurgical, materials and geophysical fields due to its ability to provide crystallography information, such as grain orientation, texture, material phases, GB orientation, and strain measurement using cross-correlation to determine small shifts in the EBSD patterns with respect to a reference pattern [26-28]. In this section four case studies meant to demonstrate the applications of EBSD in materials science are presented.
13 2.5.1 Grain orientation and texture measurement
Materials properties are controlled by their microstructure to some extent. For instance, many effective tensor properties of materials (e.g., elasticity coefficients) as well as inherently anisotropic, nonlinear properties at the single crystal level (e.g., plasticity and cracking) are primarily governed by the texture of, or the orientation distribution within, a polycrystal [26]. Hence it is necessary to examine the orientations of the crystalline grains to fully characterize the materials properties. EBSD enables individual grain orientations and local texture to be determined on the surfaces of bulk materials. As shown in Figure 2.22, raw alloy 617 alloy showed random grain orientation initially. After the tensile test, predominant {111} texture developed in alloy 617 alloy manifesting the grain reorientation to facilitate the plastic flow [29].
2.5.2 Phase detection
The distribution, morphology, and stability of material phases govern the bulk properties of almost all the engineering materials. Thus, phase identification and characterization become critical to the development and use of practical materials. Given its diffraction-based origins, the EBSD technique can directly determine the structure component of phase identification. When supplemented with quantitative chemical characterization techniques such as EDS or Wave-length Dispersive X-ray Spectroscopy (WDS), EBSD can be applied for comprehensive phase identification. Furthermore, EBSD has much higher spatial resolution than the conventional XRD and it permits the study of previously inaccessible aspects of multi-phase materials such as simultaneous phase identification and distribution, volume fraction of different phases, microstructure, and orientation relationships. Figure 2.23 illustrates a successful case of simultaneous
14
EBSD/EDS phase discrimination on Ni-based superalloy Inconel 718 [26]. All the phases, such as Ni matrix, carbide and nitride precipitates, are able to be identified along the element distribution information from EDS mapping. The relationship between the microstructure and the distribution and morphology of different phases can be established. 2.5.3 GB orientation measurement
Traditional texture measurement represents only “one-point” statistics, and does not capture microstructural geometry or topology. In the contrast, EBSD permits the study of the topological aspects of the microstructural elements, and connectivity among elements related by their orientations or crystallography. For instance, networks of GB of related orientation can be identified and quantified. Inspired by the development of EBSD, materials scientists have increasing interest on the significance of microstructural topology in controlling materials properties [26]. Examples in this regard include grain-boundary engineering which incorporates a high frequency of special GB in materials to have favorable properties such as corrosion resistance, mechanical strength, etc. For example, Mo et al. performed high temperature tensile tests on alloy 617 and found that special boundaries, like twinning boundaries in Figure 2.24, did not suffer dynamic recrystallization which greatly reduced the high temperature strength for alloy 617 [29-30].
2.5.4 Strain mapping
In structural materials local strain measurement near microstructural features, such as inclusions, precipitates, and GB, needs to be made in order to understand the deformation and failure process. There are a few competing strain mapping techniques illustrated in Figure 2.25 [26]. EBSD provides a means of determining local strains with
15
an attractive combination of high spatial resolution and high strain sensitivity. In addition, specimen preparation for EBSD is relatively easier than its counterpart for TEM. The most mature EBSD strain measurement method is based on the cross-correlation pattern shift analysis [31]. The principle of this approach is that elastic strains and small rotations cause small shifts in features, e.g. zone axes, within the EBSD patterns and that these can be measured using cross-correlation techniques and related to the strain and rotation tensor [26]. Based on the measurement of the maximum misorientation in a grain, strain contouring of individual grains of alloy 617 during plastic deformation was done by Mo et al [32]. It was found that for the short transverse specimen, the highly strained area was near the large cracks generated by the rupture of the inclusion particles as shown in Figure 2.26.
16
Figures
Figure 2.1 Three-dimensional etched microstructure of alloy 617 illustrating grain structure and bands of carbide stringers. The rolling direction (RD), short transverse (ST) direction, long transverse (LT) direction, rolling plane (RP), transverse plane (TP) and longitudinal plane (LP) are noted (after Ref. [5])
17
Figure 2.2 High-temperature tensile properties of solution-annealed, hot-rolled rod (after Ref. [4])
Figure 2.3 Rupture strength of solution-annealed alloy 617. Arrows denote tests discontinued before fracture (after Ref. [4])
18
(a)
(b)
Figure 2.4 LCF life for alloy 617. Tests were done with fully reversed strain (R=-1) and a strain rate of 1E-3/s. (a) 800 ºC; (b) 1000 ºC (after Ref. [6])
19
Figure 2.5 The microstructure of alloy 230 in solution-annealed condition (after Ref. [10])
Figure 2.6 LCF properties of alloy 230 in the temperature range of 427 to 982 ºC. Tests were run with fully reversed strain (R=-1) at a frequency of 0.33 Hz (after Ref. [7])
20
Figure 2.7 Example of creep-fatigue waveform: (a) Hold time in peak tension strain; (b) hold time in peak compression strain; (c) hold time in combined peak tension and compression strain
Figure 2.8 Strain-controlled fatigue cycle with hold periods. (a) Imposed strain over time; (b) stress response over time (after Ref. [13])
21
Figure 2.9 The life reduction factor R against the cycle period for different load conditions. R is defined as the ratio of NF/NF0 where NF is the fatigue life for a given strain rate or wave shape and hold time and NF0 is the reference life value for continuous cycling with a strain rate of 4x10⁻³ s-1. Test temperature: 950 ºC (after Ref. [15])
Figure 2.10 The fatigue life at different strain levels with or without hold time (after Ref. [10])
22
Figure 2.11 Effect of hold period and strain waveform on the low-cycle fatigue resistance of AISI Type 304 Stainless Steel tested in air at 650 ºC and at a strain rate of 4x10⁻³ s-1 (after Ref. [13])
Figure 2.12 The effect of hold time on the fatigue life of alloy 230 at the total strain range of 1.0% and temperature of 816 ºC and 927 ºC. The fatigue-life fraction is defined as the ratio of cycles to failure in hold time test (NfH) to that in continuous cycling test (NfC) (after Ref. [14])
23
Figure 2.13 Stress relaxation for alloy 617 during 60 and 1800 s tensile hold in air at (a) εtot=0.3% and (b) εtot=1.0% (after Ref. [16])
24
Figure 2.14 Stress relaxation curves of alloy 230 during tensile strain hold time with a total strain of 1.0% (after Ref. [17])
Figure 2.15 Linear damage summation failure Criterion. The region below the line is safe region while materials would fail in the region above
25
Figure 2.16 Experimental creep-fatigue data of stainless steel 316. The red bilinear line shows the conservative lower bound on experimental data (after Ref. [20])
Figure 2.17 Surface oxide and secondary cracks formed on alloy 617 specimen. Test was conducted at 1000 ºC with1.0% total strain range and 180 s tensile dwell time in air (after Ref. [16])
26
Figure 2.18 Cross-sectional SEM micrograph and EDS analysis for alloy 230 oxidized for 1000 h in air at 900 ºC. (a) SEM micrograph with EDS mapping; (b) EDS linescan (after Ref. [25])
27
Figure 2.19 (a) Fracture surface of a 1 min tensile hold sample showing transgranular stage I crack initiation and stage II propagation; (b) mixed-mode crack propagation in the interior of a 1 min tensile hold specimen; (c) intergranular crack initiation for a 120 min tensile hold sample. Test was done on alloy 617 with a total strain range of 0.6% and strain rate of 4x10⁻³ s-1 in impure helium environment at 950 ºC (after Ref. [15])
Figure 2.20 Three different fracture models for alloy 230. (a) Cracks initiated and propagated transgranular. Test was done at 816 ºC with 0.5% total strain range and no hold time; (b) mixed inter/trans-granular crack propagation. Test was done at 927 ºC with 2.0% total strain range and 2 min hold time; (c) Intergranular crack initiation and propagation. Test was done at 816 ºC with 0.5% total strain range and 10 min hold time (after Ref. [14])
28
Figure 2.21 Cavities initiated at carbide stringers in alloy 617 in a test performed at 0.3% total strain range with 180 s tensile hold time (after Ref. [16])
Figure 2.22 Grain orientation mapping and texture measurement. (a) Grain orientation of raw alloy 617 alloy showed random orientation distribution; (b) after tensile tests a {111} texture developed in alloy 617 (after Ref. [29])
29
Figure 2.23 EBSD phase detection with EDS mapping (after Ref. [26])
Figure 2.24 Twinning boundaries of alloy 617 in the as-received condition (after Ref. [30])
30
Figure 2.25 Approximate strain sensitivity and length scale of a number of competing strain measurement techniques (after Ref. [26])
Figure 2.26 EBSD analyses of an alloy 617 specimen in the short-transverse direction after tensile testing at room temperature: (a) crystal orientation mapping and (b) strain contouring (after Ref. [32])
31
Tables
Table 2.1 Chemical composition of alloy 617 (wt%) (after Ref. [4])
32
33
CHAPTER 3 : EXPERIMENTAL
3.1 Creep-Fatigue Test Specimen
Creep-fatigue tests are usually performed on uniform gage section test specimens. ASTM standard E 2714-09, Standard Test Method for Creep-Fatigue Testing, specifies the geometry and dimension of specimens used for creep-fatigue testing [12]. In accordance with that standard, two specimen designs for two different test frames were used in this study. Specimens were made from as-received materials in the solution-treatment condition with the long axis aligned with the rolling direction of raw materials. Figure 3.1 and Figure 3.2 illustrate the detailed schematic of two specimen designs used for creep-fatigue testing.
3.2 Test Matrix
High temperature creep-fatigue behavior of materials is usually influenced by many different factors, such as temperature, environment, strain rate, total strain range, creep-fatigue waveform, strain hold time, etc. This study focuses on the effect of total strain range and duration of hold time on the creep-fatigue behavior of materials. In addition, LCF tests at the same strain level as the creep-fatigue tests are done to serve as a benchmark for determining the extent of reduced fatigue life under creep-fatigue tests. To realize these goals, a test matrix as shown in Table 3.1 was proposed. Further, the test matrix was designed to generate enough data for developing modeling for creep-fatigue life prediction. The test temperature was controlled in the following fashion; the specimen was first heated to the target temperature at a heating rate of 10 ºC per min, and then the specimen was held at that temperature with zero load for about 45 min to allow
34
temperatures to stabilize before the commencement of the test. The end-of-test criterion is defined as the attainment of 40% decrease in the cyclic maximum tensile stress.
3.3 Creep-Fatigue Test Frame
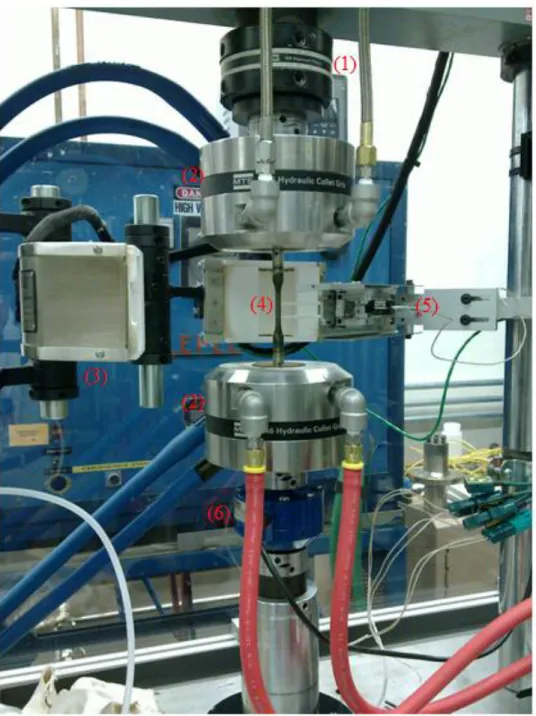
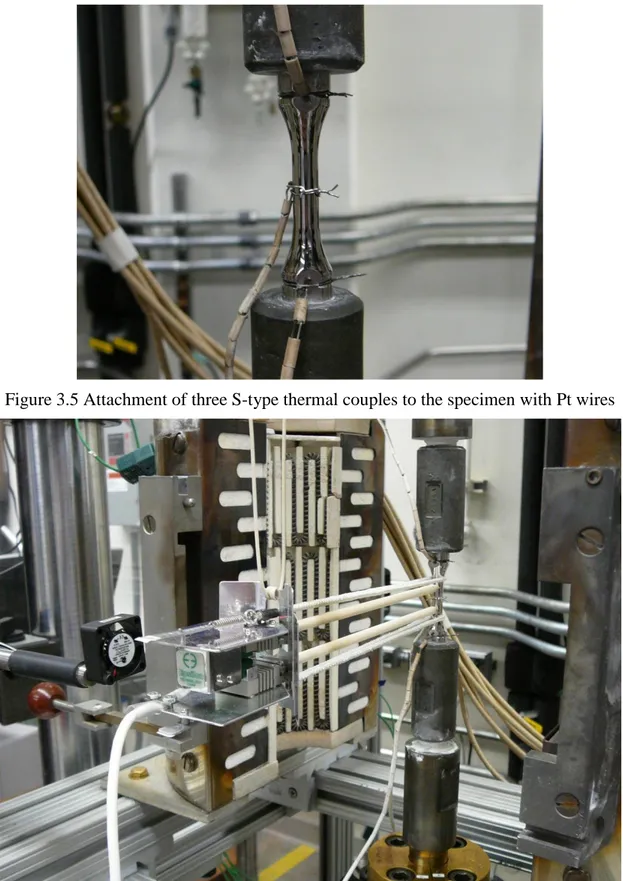
Two creep-fatigue test frames were established at ORNL as shown in Figure 3.3 and Figure 3.4. Both frames used servo-hydraulic power to perform the creep-fatigue test in air. The controller for the frame in Figure 3.3 was an Instron Model 8500 testing system. The temperature control was accomplished using a three-zone resistance furnace with three S-type thermocouples attached to the gauge section of the specimen with Pt wires as illustrated in Figure 3.5. An Epsilon Model 3448 high temperature extensometer was used to measure the axial strain of the specimen. The working principle of the high temperature extensometer is that the central gauge part of the specimen is in direct contact with the ceramic feeler arms of the extensometer (as shown in Figure 3.6); hence the elongation or contraction of the gauge part can be tracked and measured. In order to attach the extensometer to the specimen, two spring-loaded ceramic wires were used and the extensometer was also supported from a fixture via a glass fiber wire. In this way the extensometer could maintain a relatively stable and horizontal position during the whole duration of the test. Forced air flow was also applied for cooling the extensometer during high temperature creep-fatigue testing to yield a more stable strain reading. The second set of creep-fatigue test frame used more up-to-date hardware compared with the first one and provided easier operation and better repeatability. It consisted of MTS 646 hydraulic grips for clamping the specimen ends, a MTS 407 controller for controlling the test waveform, a one-zone resistance furnace, and a MTS 632.53 high temperature extensometer for strain control and measurement. Figure 3.7 shows the picture of a
35
straight sided specimen installed in the second set of creep-fatigue test frame. Since the furnace of the second load frame had one-zone control, one S-type thermal couple was tied to the middle of gauge section of the specimen. The high temperature extensometer was pushed against the specimen by a spring gadget of the extensometer housing so that the ceramic feeler arm of the extensometer was in firm contact with the specimen gauge. Normally a temperature gradient exists inside the furnace at elevated temperatures and it is necessary to know the magnitude of this gradient and make necessary adjustment to the original target temperature (850 ºC) to make sure the whole gauge section of the specimen is within the allowable temperature range per ASTM Standard E2714-09. To realize this, one specimen with three S-type thermal couples attached at the upper, middle, and lower part of the gauge section was firstly used. The reading of the middle thermal couple was for controlling the temperature while the readings of upper and lower thermal couples were used for determining the temperature gradient. Once the temperature gradient inside the furnace at the original target temperature was determined, adjustments were made to the original control temperature. All the following tests were done with this adjusted temperature and only one S-type thermal couple attached to the middle gauge section of the specimen was used. For the purpose of yielding high quality results, major components of both test frames, such as the load cell, extensometer, and the load frame LVDT sensor, were all calibrated to satisfy the relevant ASTM standards. The alignment of both load frames was also checked with strain-gaged specimens and the alignment fixture was adjusted to insure that the maximum bending strain was less than 5.0% of the axial strain.
36
3.4 Microanalysis
Post-test specimens were firstly cut into small strips with a size of 4 mm by 4 mm along longitude direction. The strip sample was polished up to 0.05 µm finish with alumina suspensions. To remove the polishing damage and reveal the grain structure, polished specimens were etched with a solution consisting of 10 ml nitric acid, 10 ml acetic acid, and 15 ml hydrochloric acid between 1 to 2 min. JEOL 6500F at the SHaRE User Facility of ORNL was used for carrying out SEM, EDS, and EBSD examinations on the specimens in this study. It makes use of a field emission gun for electron source, Si drift detector for X-ray microanalysis. It is also equipped with high speed EBSD detector and Orientation Imaging Microscopy (OIM) data collection and analysis software from TSL for making EBSD analysis. The detailed EBSD data acquisition conditions are summarized in Table 3.2.
37
Figures
38
39
Figure 3.3 First set of creep-fatigue test frame. Detailed item description: (1) alignment fixture; (2) load cell; (3) specimen grips; (4) specimen; (5) furnace; (6) high temperature extensometer
40
Figure 3.4 Second set of creep-fatigue test frame. Detailed item description: (1) alignment fixture; (2) hydraulic grips; (3) furnace; (4) specimen; (5) high temperature extensometer; (6) load cell
41
Figure 3.5 Attachment of three S-type thermal couples to the specimen with Pt wires
Figure 3.6 Attachment of an Epsilon Model 3448 high temperature extensometer to the specimen
42
Figure 3.7 A straight sided specimen installed in the hydraulic grips with one S-type thermal couple and the high temperature extensometer installed
43
Tables
Table 3.1 Test matrix for LCF and creep-fatigue testing of alloy 617 and alloy 230
Material Temperature(ºC) Environment Total Strain Range and Hold Time
0.5% 1.0% 1.5% Alloy 617 850 Air 2.5E-4/s No Hold 3 min in PT* No Hold 3, 10, 30 min in PT* No Hold 3 min in PT* Alloy 230
*PT: Peak tensile strain
Table 3.2 EBSD data acquisition condition summary
Sample tilt angle Electron accelerating voltage Working distance Image binning Scan rate
44
CHAPTER 4 : RESULTS
4.1 LCF Results
4.1.1 LCF life
The LCF life of both alloys is compared in this section. Based on ASTM Creep-Fatigue Test Standard E2714-09 [12], a few options are available for defining the failure criterion. Two failure criteria are adopted here for comparison purpose, namely 40% decrease in the cyclic maximum tensile stress and 20% reduction in the ratio of peak tensile to peak compressive stress (referred as stress ratio hereafter) after the stress ratio apparently deviates from its initial trend. The second failure criterion based on stress ratio allows changes in peak stresses because of cyclic work hardening or softening to be differentiated from changes due to crack formation and propagation [15,33]. In Figure 4.1, LCF test results of alloy 617 and alloy 230 based on two different criteria at different total strain levels are compared. The LCF life from both criteria is quite similar to each other, which indicates both criteria can be used as the failure criterion. Under all test conditions, alloy 230 performed slightly better than alloy 617.
4.1.2 Materials cyclic fatigue behavior
Figure 4.2 shows the cyclic maximum stress and stress ratio of alloy 617 and alloy 230 at different total strain levels. Both materials displayed similar cyclic behavior, namely cyclic hardening during the initial few cycles followed by steady state cyclic softening and final accelerated crack growth manifested via fast load drop. Since the as-received material was in solution-treatment condition, the dislocation density should be low initially. As a result of repeating cyclic deformation, dislocation slip and multiplication occurred rapidly, causing significant strain hardening [34-35,39]. At some
45
point, the newly formed dislocation structure stabilized for that material and for the magnitude of cyclic strain imposed during the test. The ensuing cyclic softening phenomenon may be attributed to the dislocation recovery process occurring during strain cycling [21]. The dislocation recovery is a thermal-driven process during which dislocations can annihilate or rearrange themselves causing polygonization. The elevated test temperature created a favorable condition for the recovery of dislocations. Under the same test condition, the cyclic maximum stress and cyclic stress ratio curves presented different behaviors. Namely changes in maximum tensile stress due to initial cyclic work hardening and following steady state cyclic softening were not seen in the stress ratio. The stress ratio remained relatively constant for the most part of LCF test. Once macrocrack initiation started, manifested by a negative deviation from the linear plot of maximum stress verse cycles [36], the cyclic stress ratio curve also dropped heftily. The difference between cyclic maximum stress and stress ratio can be explained by the following argument: cyclic work hardening or softening would cause an approximately equal effect on peak tensile and compressive stress while crack initiation and growth would selectively reduce net section peak tensile stress [37]; therefore, cyclic work hardening or softening shouldn’t cause significant changes in stress ratio as cracking would. It is worth noting that the cycles to macrocrack initiation accounted for the major part of the LCF life for both materials meaning both materials had good resistance to crack initiation and the fraction of LCF life consumed in the formation of macrocrack decreased with increasing total strain range. This is because cyclic stress correlates with total strain range in LCF tests and smaller cyclic stress associated with lower total strain range shifted the LCF test towards the direction of a high cycle fatigue (HCF) test in
46
which usually most of the material fatigue life is spent in crack initiation rather than crack propagation [38]. In the related study of Smith and Yates, they conducted LCF tests on alloy 617 and had the same observation [39]. Despite the similarity between these two materials, Figure 4.2 also reveals that higher flow stress was needed for deforming alloy 230 than alloy 617 to the same strain level. The higher strength of alloy 230 may contribute to its slightly superior fatigue property over alloy 617 [40]. The major differences among tests at different total strain range are that for the small total strain range test, e.g. 0.5%, the load drop during the steady state cyclic softening stage was less than its counterpart at higher total strain range tests, i.e., 1.0% and 1.5%, and the maximum stress scattering at the steady state cyclic softening stage was more obvious for the small total strain range test. The mid-life hysteresis loops, illustrated in Figure 4.3, demonstrated smaller plastic strain range for alloy 230 than alloy 617 at various strain levels. In addition, mid-life plastic strain amplitude, p / 2, versus the number of reversals to failure, 2Nf, is plotted in Figure 4.4. The data points reveal a good match with the straight linear fitting line in the double logarithmic plot. The linear relationship between log(p / 2) and log(2Nf) conform to the theory first noted by Coffin [41-43]: p / 2'f(2Nf)c (Equation 4.1) where 'f is known as the fatigue ductility coefficient, the failure strain for a single reversal and c, known as fatigue ductility exponent, equals to the negative of the slope of the straight line in Figure 4.4.
4.1.3 Dynamic Strain Aging (DSA)
DSA, also known as Portevin-LeChatelier effect, describe the interaction between impurity atoms and the dislocation motion during deformation. It typically appears as
47
serrated plastic flow in a uniaxial tensile test due to locking and releasing of the dislocations by the solute atoms [44]. In fatigue testing, DSA was manifested as sudden load drop with accompanying shock wave sound. Figure 4.5 illustrates the DSA phenomena present during the LCF tests of alloy 617 and alloy 230 at various total strain levels. The total strain range can influence the extent of DSA phenomena. When the test total strain range ≥ 1.0%, DSA usually did not last for more than 10 cycles, while for the smallest total strain range test, 0.5%, DSA could last for hundreds of cycles before the serrated flow disappeared. This could explain the existence of low cyclic softening rate and large maximum stress scattering in the 0.5% total strain range LCF test as described in section 4.1.2. It is known that if other conditions are same, small strain fatigue favors planer slip character of dislocations while large strains fatigue would promote wavy slip or nonplanar dislocation arrangements [45]. DSA normally tends to favor planar slip character, thus affecting the LCF test at 0.5% total strain range to more extent [46].
4.2 Creep-Fatigue Results
4.2.1 Creep-fatigue life
The cycles to failure at different total strain range with various durations of the dwell time at maximum strain level are shown in Figure 4.6. Compared to the LCF results, the cycles to failure for both materials got reduced at creep-fatigue test conditions. Again, no apparent differences were found in the cyclic creep-fatigue life for the two failure standard described previously. Numeric data of LCF and creep-fatigue life of alloy 617 and 230 based on 40% cyclic maximum tensile strength drop is shown in Table 4.1. Similar to the LCF results, alloy 230 exhibited longer creep-fatigue life than alloy 617, especially for the creep-fatigue tests with the smallest total strain range, i.e., 0.5%,
48
and longer dwell time, e.g. 10 and 30 min at 1.0% total strain range. The greatest fatigue life reduction was found in the creep-fatigue test of alloy 617 with 0.5% total strain range and 3 min dwell time at peak tensile strain, i.e., 40% reduction in the fatigue life compared with the LCF test at the same condition. In the related work of Meurer et al. [11] and Totemeier [33], they also observed that the largest fatigue life reductions were found when strain hold period was introduced into low total strain range LCF tests of alloy 617. It is clear from Figure 4.6 that longer hold time at the maximum tensile strain would cause a further decrease in both materials’ creep-fatigue life. In previous studies some authors discovered a saturation effect of hold time at peak strain on the reduction of fatigue life in alloy 617 [11,33] and stainless steel 304 [19]. Figure 4.7 can be indicative of such saturation effect although creep-fatigue tests at hold time longer than 30 min are needed to verify this.
4.2.2 Materials cyclic creep-fatigue behavior
In Figure 4.8, the cyclic maximum stress and stress ratio of alloy 617 and alloy 230 under creep-fatigue tests are illustrated. Compared with the cyclic maximum stress of alloy 617 and alloy 230 under LCF tests in Figure 4.2, the cyclic stress behavior of both alloys under creep-fatigue tests at a total strain range of 0.5% and 1.0% revealed different characteristics. There was an additional transition stage, manifested by the rapid maximum stress drop rate which tailed off to a steady state value eventually, between the cyclic hardening phase and the stead state cyclic softening phase. As mentioned before, cyclic softening phenomenon may be due to dislocation recovery which is a thermal-active process. Strain hold period allowed more time for dislocation rearrangement and annihilation. Hence there was an additional transition stage of accelerated maximum
49
stress drop. The mid-life hysteresis loops of both materials under creep-fatigue testing are shown in Figure 4.9. Again, alloy 230 showed smaller plastic stain range than alloy 617 for all the test conditions as in the LCF tests.
4.2.3 Stress relaxation during strain hold period
The major differences between the mid-life hysteresis loops under LCF tests and creep-fatigue tests were the appearances of stress relaxation behavior during the peak tensile strain hold period in creep-fatigue tests. During the stress relaxation period, in order to maintain the total strain constant the stress was reduced to convert elastic strain to inelastic strain. Therefore stress relaxation is a form of creep [19,47]. In Figure 4.10, the stress relaxation behavior at different test conditions is displayed. Regardless the test conditions, in the first few seconds, a very rapid drop of the stress occurs, which may be as high as 50% of the initial stress level. During the remaining period, relatively small additional stress relaxation occurred. For the test with a longer hold time, i.e., 30 min hold time at 1.0% total strain range, a quasi-steady state stress relaxation rate was noticed. 4.2.4 DSA
Similar to LCF tests, DSA also occurred in the creep-fatigue tests as well. Figure 4.11 illustrates the second cycle hysteresis loops of both materials in the creep-fatigue tests with 3 min stain dwell time, showing serrated plastic flow. The same effect of total strain range on the number of cycles during which DSA took place applied in all creep-fatigue tests likewise.
4.3 SEM and EDS Results
Microstructure analysis of all the specimens were done on the rolling plane or longitudinal plane of the materials shown in Figure 4.12 to avoid any influence of
50
specimen orientation on microstructure properties. In all the following microanalysis figures of LCF and creep-fatigue tested specimens, the stress direction is parallel to the vertical direction of the reading plane.
4.3.1 As-received and aged materials
In this pericope, microstructures of as-received specimens and specimens aged at 850 ºC for 45 min are studied. The thermal aging conditions mimicked the high temperature baking period during which materials were held at 850 ºC before the start of a test to stabilize the testing temperature. The reason to investigate the microstructure of aged specimens is to study possible microstructural changes when materials were held at 850 ºC. At elevated temperatures precipitation reactions are possible for both alloy 617 and alloy 230, and thus the microstructure of materials before the commencement of the test could be quite different from that of as-received materials because of the 45 min hold time at 850 ºC.
Figure 4.12 shows the 3D microstructure of as-received alloy 617 and alloy 230 at low magnification. For both materials, equiaxed grain structure and plenary annealing twinning boundaries were observed. After solution treatment there were still many precipitates undissolved and distributed inside the grain and on GB for both materials. This was more obvious for alloy 230 in which precipitate clusters were clearly visible and aligned along the rolling direction. The morphology and composition of these precipitates in alloy 617 and alloy 230 are shown in Figure 4.13 and Figure 4.14, respectively. For alloy 617, relatively large black precipitates were composed of Ti(CN). Intragranular small precipitates and GB continuous thin plate-like precipitates were exclusively Cr-enriched M23C6. With regard to alloy 230, the large precipitate clusters
51
consisted of W-rich M6C and Cr-rich M23C6, while GB thin-plate-like precipitates were merely Cr-rich M23C6. No precipitates were found on twinning boundaries for both materials. In addition, earlier research works reported the existence of coarse carbide stringers in the as-received alloy 617 (as shown in Figure 2.1) which fractured easily in tensile tests and had negative impact on material’s ductility [16,33,48-50]. This microstructure feature was not observed in this work.
After thermal aging treatment at 850 ºC for 45 min, microstructure changes were evident and turned out different for both materials. Cr-rich M23C6 precipitates formed around original Ti(CN), GB and intragranular M23C6 precipitates in alloy 617 as shown in Figure 4.15. The smaller newly formed carbides surrounded original intragranular M23C6 precipitates and created a sunburst pattern. It was proposed by Mankins et al. that the growth of original intragranular carbide as the alloy was cooled from the annealing temperature during the solution treatment generated dislocations on which smaller carbides could precipitate when the alloy was subsequently exposed to elevated temperatures [51]. In many cases the newly formed plate-shaped intragranular M23C6 precipitate particles, shown in Figure 4.16, aligned along specific crystallographic planes or directions of the crystal matrix resembling a typical Widmanstätten structure [52]. Unlike as-received alloy 617 specimens, precipitation on twinning boundaries was found as needle-shaped M23C6 precipitate particles on coherent twinning boundaries and “zipper” form M23C6 precipitates formed at twin ends as illustrated in Figure 4.17. The twin ends were incoherent twin interfaces upon which lath-like precipitates formed. Based on the work of Singhal et al., the formation mechanism of such lath-like precipitates involved precipitation on Shockley partial dislocation which bowed out from the incoherent
52
twinning boundaries [53]. The precipitate morphology in alloy 230 after aging treatment is presented in Figure 4.18. Similar to alloy 617, Cr-rich M23C6 aggregated around original intragranular precipitates in aged alloy 230 and twinning boundaries also became sites for new carbides formation. However GB cellular type precipitates were experienced which was shown to initiate premature rupture failures from other studies [8]. The cellular precipitate was mainly Cr-rich M23C6 as shown in Figure 4.19. In addition, in some cases precipitation free zones formed on both sides of a GB decorated with cellular precipitates, e.g. in Figure 4.18(b). Concentration of plastic deformation in these zones was possible and had been shown to lead to crack initiation in a wrought Ni-based superalloy [36,45]. Driver et al. investigated the effect of the precipitation free zone width on the elevated temperature fatigue properties of a Nb-stabilized austenitic stainless steel and found that materials without precipitation free zones had better fatigue resistance than materials with precipitation free zones, but if precipitation free zones were experienced in the material, an optimum precipitation free zone width of about 1 µm existed for maximization of the fatigue resistance [54]. Figure 4.20 illustrates the occurrence of Widmanstätten structure precipitates in aged alloy 230 as well. It is worth noting that not every GB developed cellular type precipitates in alloy 230 and some GB precipitates still had thin plate shape as shown in Figure 4.21. This means GB character, such as misorientation, can influence the morphology of GB precipitate which will be stressed further in the EBSD analysis.
4.3.2 LCF tested materials
Microstructure changes for both materials after LCF tests are highlighted in this section. Regardless of chosen total stain range during LCF tests, classic transgranular
53
crack initiation and propagation were observed for alloy 617 specimens with one example shown in Figure 4.22 (The determination of cracking mode in LCF and creep-fatigue tests was checked with inverse pole figure from EBSD analysis which will be addressed later). The transgranular cracking was perpendicular to the principle stress axis. Such fatigue fracture mode is called Stage II fracture and is usually in conjunction with wavy slip character of the material [45]. In Ni-based superalloys, the temperature and strain rate conditions necessary to give wavy slip have been determined quantitatively and under the current test condition (T=850 ºC,
=2.5E-4/s), wavy slip was expected [55]. Because of the elevated temperature and air environment, oxidation on specimen surface and crack opening was visible after LCF tests as shown in Figure 4.23(a). Based on EDS analysis, the top gray scale in Figure 4.23(a) was enriched with Cr and the dark finger-shaped region was enriched with Al. On occasion voids developed at the interface between surface oxide and metal substrate as illustrated in Figure 4.23(b). The voids might become a site for early crack initiation. As presented in Figure 4.24, a new precipitate phase, Mo-rich M6C, was found at GB region of alloy 617 after all LCF tests. Rao et al. claimed that there was an incubation time for M6C precipitate formation in alloy 617 [15]. Moreover plastic deformation during LCF tests may promote dissociation of Cr-rich M23C6 and formation of Mo-rich M6C as suggested in the work of Jo et al [56]. Thus M6C precipitate was absent in the as-received and 45-min aged specimen since the material had not stayed long enough in the elevated temperature and no plastic deformation was experienced by the material. Inside the material, Figure 4.25 shows the fracture of Ti(CN) and void formation associated with GB and intragranular precipitates. The void formation was observed in alloy 617 specimens only when the test total strain
54
range was 1.0% or 1.5%. The GB carbides also coarsened and their distribution on GB became discontinuous as seen in Figure 4.25(b). The frequency of these voids was still scarce and they were not able to coalesce to form cracks, hence these defects should not influence material performance for short term LCF tests. Nevertheless for materials subject to load at high temperatures for a long term, these defects cannot be ignored.
Similar to alloy 617, transgranular crack initiation and propagation were observed in alloy 230 specimens for all the LCF tests. One example is exemplified in Figure 4.26. During the LCF tests, a thin oxide layer enriched with Cr and Al has developed on specimen surface as in Figure 4.27. It was found that for the LCF test with the largest total strain range, 1.5%, in some cases the crack path could follow GB. For instance, in Figure 4.28 the red arrow points out the crack path along GB. GB cellular precipitates were found in alloy 230 after exposure to the elevated temperature and the formation of cells of M23C6 lamellae resulted in significant decrease in high temperature ductility in Ni-based alloys [57]. Moreover, precipitation free zones close to the GB cellular precipitate could further enhance the local plasticity concentration. Therefore, cracks growing along GB became possible especially with the aid of high stress level at the 1.5% total strain range LCF test. Figure 4.29 presents void formation under cyclic deformation inside the material as a result of fracture of intragranular precipitates or rupture at the interface between the intragranular precipitates and matrix. The carbide precipitates were usually brittle, hence inductive to rupture under high stress and the interface of matrix and precipitates was also possible region for strain concentration because of the strain field across the phase boundary. In contrast to 45-min aged alloy 230 specimens where GB cellular precipitates were found everywhere in the material, LCF-tested alloy 230