TOWARD AN UNDERSTANDING OF THE RAPID DECLINE
OF THE COSMIC STAR FORMATION RATE
Eric F. Bell,1Casey Papovich,2Christian Wolf,3Emeric Le Floc’h,2John A. R. Caldwell,4,5Marco Barden,1 Eiichi Egami,2Daniel H. McIntosh,6Klaus Meisenheimer,1Pablo G. Pe´rez-Gonza´ lez,2
G. H. Rieke,2M. J. Rieke,2Jane R. Rigby,2and Hans-Walter Rix1
Receivved 2004 August 23; accepted 2005 February 8
ABSTRACT
We present a first analysis of deep 24m observations with theSpitzer Space Telescopeof a sample of nearly 1500 galaxies in a thin redshift slice, 0:65z<0:75. We combine the infrared data with redshifts, rest-frame
luminosities, and colors from COMBO-17 and with morphologies fromHubble Space Telescopeimages collected
by the Galaxy Evolution from Morphology and SEDs (GEMS) and Great Observatories Origins Deep Survey (GOODS) projects. To characterize the decline in star formation rate (SFR) sincez0:7, we estimate the total thermal IR luminosities, SFRs, and stellar masses for the galaxies in this sample. Atz0:7, nearly 40% of intermediate- and high-mass galaxies (with stellar masses2;1010M
) are undergoing a period of intense star formation above their past-averaged SFR. In contrast, less than 1% of equally massive galaxies in the local universe have similarly intense star formation activity. Morphologically undisturbed galaxies dominate the total infrared luminosity density and SFR density: atz0:7, more than half of the intensely star-forming galaxies have spiral morphologies, whereas less than30% are strongly interacting. Thus, a decline in major merger rate is not the underlying cause of the rapid
decline in cosmic SFR sincez0:7. Physical properties that do not strongly affect galaxy morphology—for
example, gas consumption and weak interactions with small satellite galaxies—appear to be responsible.
Subject headinggs:galaxies: evolution — galaxies: fundamental parameters — galaxies: interactions — galaxies: starburst — galaxies: stellar content — infrared: galaxies
1. INTRODUCTION
It has become clear in the last decade that the average star formation rate (SFR) per unit comoving volume—the so-called cosmic SFR—has declined by an order of magnitude since
z1 ( Lilly et al. 1996; Madau et al. 1998; Hogg et al. 1998; Flores et al. 1999; Haarsma et al. 2000; Hopkins 2004). A num-ber of physical processes may contribute to this decline, e.g., a declining rate of major galaxy mergers, a drop in the rate of minor tidal interactions, or the progressive consumption of cold gas. Yet, many empirical aspects of this declining cosmic SFR are frustratingly unclear. Does the star formation in disks evolve slowly, while merger-induced starbursts evolve rapidly? Does the decreasing number density of galaxies with high SFR re-flect a decline in star formation in Milky Way–mass galaxies or reflect a disappearance of a population of bursting dwarf gal-axies? In this paper, we present a first basic analysis of deep 24m observations taken by the MIPS Team ( Rieke et al. 2004; Papovich et al. 2004; Rigby et al. 2004). We combine these in-frared ( IR) data with the COMBO-17 redshift and spectral en-ergy distribution (SED) survey ( Wolf et al. 2004) and the largest
existingHubble Space Telescope(HST) Advanced Camera for
Surveys (ACS) mosaic (the Galaxy Evolution from Morphology
and SEDs [GEMS]; Rix et al. 2004) to study nearly 1500 galaxies with 0:65z<0:75 in the 300;300extended Chandra Deep Field South (CDFS), with the goal of exploring the morphol-ogies, stellar masses, and SFRs of galaxies and probing the physics driving the decrease in the cosmic SFR to the present day.
1.1.Understandin
g
the Form of the Cosmic Star Formation HistoryThe basic form of the cosmic star formation history (SFH ) was initially established using observations of rest-frame ultra-violet ( UV ) luminosity ( Lilly et al. 1996; Madau et al. 1996, 1998; Steidel et al. 1999), which in the absence of dust is an excellent indicator of the bolometric light output from young, massive stars. As rest-frame UV is redshifted into the optical, it becomes observationally straightforward to establish a deep census of unobscured young stars, well below the knee of the luminosity function. Yet, studies of both local and distant gal-axies have shown that only a small fraction of the UV photons
fromLgalaxies escape unhindered (dwarf galaxies are often
optically thin to UV photons but do not significantly contribute to the SFR density; Wang & Heckman 1996; Adelberger & Steidel 2000; Bell 2003). Thus, the observed drop in UV lumi-nosity density may not quantitatively track the drop in cosmic SFR.
Mindful of the limitations of rest-frame UV, other SFR in-dicators have been explored. Rest-frame optical line emission reflects the ionizing photon output from very massive young stars in the absence of dust extinction (see Kennicutt 1998 for a detailed discussion). Emission-line–derived SFRs have been studied intensively in the local universe (Gallego et al. 1995;
Brinchmann et al. 2004) and have been probed out toz3 for
the very brightest galaxies using rest-frame Oiiand Balmer line
1 Max-Planck-Institut fu¨r Astronomie, Ko¨nigstuhl 17, D-69117 Heidelberg, Germany; [email protected].
2
Steward Observatory, University of Arizona, 933 North Cherry Avenue, Tucson, AZ 85721.
3
Department of Physics, Denys Wilkinson Building, University of Oxford, Keble Road, Oxford OX1 3RH, UK.
4
Space Telescope Science Institute, 3700 San Martin Drive, Baltimore, MD 21218.
5
Present address: University of Texas, McDonald Observatory, Fort Davis, TX 79734.
6
Department of Astronomy, University of Massachusetts, 710 North Pleas-ant Street, Amherst, MA 01003.
emission ( Hogg et al. 1998; Yan et al. 1999; Glazebrook et al. 1999; Tresse et al. 2002; Hippelein et al. 2003; Erb et al. 2003). These studies find a considerable drop in the average SFR per
unit volume in luminous galaxies sincez1, but owing to the
difficulty of measuring Balmer decrements of high-redshift gal-axies, considerable uncertainties remain.
Radio and X-ray emission from distant galaxies also con-strains their SFRs (Condon 1992; Cohen 2003). Observational constraints limit the applicability of both indicators to just the brightest sources at this stage; a substantial drop in the volume-averaged SFR in very luminous sources is again seen since
z1 (e.g., Haarsma et al. 2000; Cohen 2003). Yet, both X-ray
and radio luminosities are strongly boosted by the presence of an active galactic nucleus (AGN ), and the physical origin of both is not well understood.
One of the most intuitive SFR indicators is the luminosity of a galaxy in the thermal IR. For most star-forming galaxies, the thermal IR emission is dominated by reprocessed UV pho-tons from massive young stars that are dust enshrouded (see Kennicutt 1998 for an excellent review). For most galaxies the combined IR and UV luminosity is a relatively robust indicator of the bolometric output from young stars and therefore a good proxy for SFR (e.g., Gordon et al. 2000; Buat et al. 2002; Bell 2003), especially if the modest contribution to the IR flux from dust-reprocessed light from older stellar populations is ac-counted for (typically30% or less; Misiriotis et al. 2001; Bell 2003). Until recently, instrumental sensitivity has been a key limitation at these wavelengths; only galaxies with IR luminos-itiesk1011Lhave been observed at cosmologically interest-ing redshifts by theInfrared Space Observatory(ISO). Through detailed modeling and analysis of these observations, it is clear that highly luminous IR galaxies were much more common at
z1 than they are today (e.g., Flores et al. 1999; Elbaz et al. 2002; Mann et al. 2002; Pozzi et al. 2004). Observations of sub-millimeter emission from distant, intensely star-forming galax-ies have extended this picture tozk2 (e.g., Blain et al. 1999). Yet, despite this encouraging progress, it is still unclear how the evolution of these highly luminous galaxies is linked to the much more numerous fainter galaxies that dominate the volume-averaged SFR.
1.2.Understandin
g
the Physical Driv
ers of Star FormationA wide range of processes may contribute to the
order-of-magnitude drop in cosmic SFR sincez1: major mergers, tidal
interactions, gas consumption, ram pressure stripping, galaxy harassment, or the secular evolution of bars. Deciding which processes dominate involves a number of observational and interpretive challenges. As an example, it is challenging to mea-sure the major merger rate robustly; close-pair statistics suffer from contamination, automated asymmetry measures are sen-sitive to contamination from irregular galaxies and very close projected pairs, and visual morphological classifications are subjective, and less sensitive to prograde interactions owing to their lack of pronounced tidal tails.
There is evidence that these different physical processes play a role in shaping the SFRs of galaxies. Many merging galaxies form stars intensely (e.g., Sanders & Mirabel 1996). Given the observational evidence for a drop in the merger rate sincez1 (e.g., Le Fe`vre et al. 2000; Patton et al. 2002; Conselice et al. 2003), it is indeed plausible that the decline in the volume-averaged cosmic SFR is driven at least in part by this drop in merger rate. Furthermore, minor interactions seem to enhance SFRs, at least in the local universe (e.g., Barton et al. 2000), plausibly by exciting unstable modes such as bars or strong
transient spiral arms in the affected galaxies. The exhaustion of cold gas could also play a role. Indeed, most massive nearby
galaxies have low gas fractionsP10% (e.g., Kennicutt et al.
1994; Bell & de Jong 2000), and the current SFRs of many local galaxies will exhaust the available gas supply in5 Gyr (e.g., Kennicutt et al. 1994). It is possible that fresh infall or recycled gas can help to sustain star formation for a longer time. Yet, it is also possible that we live in a special epoch, when the star formation in massive galaxies is switching off.
1.3.The Object of This Paper
This paper is one of a series in which we explore differ-ent aspects of the declining cosmic SFR. Wolf et al. (2005) study the contribution of different galaxy morphologies to the
rest-frame 28008luminosity density for rest-frameB-band–
selected galaxies in a thin 0:65z<0:75 redshift slice from COMBO-17 and GEMS. In this paper, we supplement this
optically selected sample with 24m data fromSpitzerto
ex-plore the contribution of obscured star formation.7Le Floc’h et al. (2005) explore the IR luminosity function over the range
0<z<1 using MIPS 24m data and COMBO-17 redshifts.
C. Papovich et al. (2005, in preparation) explore the morphologies of the galaxies that dominate the turnover in the 24m number counts, as a clue to understanding the drivers of IR-obscured star formation.
In this paper, we study the MIPS 24 m properties of a
complete sample of rest-frame B-band–selected 0:65z<
0:75 galaxies in the CDFS.8Owing to the high sensitivity and relatively tight point-spread function ( PSF ) of 24 mSpitzer
observations, many more star-forming galaxies are detected at 24m than at 70 and 160m. We use IR template spectra, tuned to reproduce the whole range of local galaxy IR SEDs, to trans-form 24m luminosity into total IR luminosity. For the smaller
area imaged byChandrato date, we incorporate theChandra
X-ray data (Alexander et al. 2003) to explore the importance of AGNs at 24m (see also Rigby et al. 2004). Our main goals are to identify allz0:7 galaxies with high SFRs, explore their morphologies, and characterize the importance of massive star-bursting galaxies compared to the present-day universe, as a probe of the physics driving the declining cosmic SFR.
The paper is set out as follows. Inx2 we discuss the data. In
x3 we outline the methods used to estimate total IR flux, SFR and stellar mass, and the main sources of uncertainty. Inx4 we present trends in the IR / UV ratio. Inx5 we explore the con-tribution of different morphological types to the total SFR at
z0:7. In x6 we discuss intense star formation in massive
galaxies and how this changes over the last 7 Gyr. Inx7 we
compare with existing data, explore the contribution of AGNs, compare with theory, and discuss future improvements in this
analysis. Inx8 we present our conclusions. Appendices A and
B discuss possible incompleteness in our optically selected catalog and uncertainties in the galaxy morphological classi-fications. Throughout, we express the estimated integrated UV and IR luminosities in terms of the bolometric luminosity of the
7
An additional advantage of adopting such a narrow redshift slice for this paper is that the effects ofdifferential(1þz)4 surface brightness dimming, morphologicalk-corrections, and uncertainties in the conversion of 24m flux to total IR are minimized.
8
At this stage, we cannot and do not study completely obscured galaxies with extremely faint or nonexistent UV/optical detections. Preliminary in-dications are that these optically faint IR sources are optically faint largely owing to their relatively high redshift (zk1; e.g., Papovich et al. 2004) rather than having a lower redshift and higher obscuration. See Appendix A, where this issue is explored in more detail.
SunL¼3:9;1026W. We assumem¼0:3,¼0:7, and
H0¼70 km s1Mpc1(Spergel et al. 2003). Estimates of SFR and stellar mass assume a universally applicable Kroupa (2001) initial mass function ( IMF ).9
2. THE DATA 2.1.MIPS Data
Spitzerobserved a 1;0N5 field around the CDFS in 2004 January and February as part of the time allocated to theSpitzer
Guaranteed Time Observers (GTOs). The MIPS 24 m data
were taken in slow scan–map mode, with individual exposures of 10 s. We reduced the individual image frames using a custom data analysis tool ( DAT ) developed by the GTOs (Gordon et al. 2005).10The reduced images were corrected for geometric dis-tortion and combined to form full mosaics. The final mosaic has a pixel scale of 1B25 pixel1and an image PSF FWHM of’600. TheSpitzerastrometry is aligned to the ESO Imaging Survey (Arnouts et al. 2001) with a typical accuracy0B5. The overall
astrometric solution is then shifted by nearly 100by matching to the much sparser Two Micron All Sky Survey catalog (2MASS). This revised astrometric solution is matched toP0B1 with the COMBO-17 coordinate system.
Source detection and photometry were performed using tech-niques described in Papovich et al. (2004); based on the anal-ysis in that work, we estimate that our source detection is 80%
complete at 83Jy in the 24m image. Based on our noise
es-timates, the photon noise in the 24m image is roughly equal to the confusion noise at this depth (see, e.g., Dole et al. 2004).
2.2.Optical Data: COMBO-17 and GEMS
To date, COMBO-17 has surveyed three disjoint340;330
southern and equatorial fields to deep limits in five broad and 12 medium passbands. Using these deep data in conjunction with nonevolving galaxy, star, and AGN template spectra, objects are classified and redshifts assigned for99% of the objects to a limit ofmR23:5. Typical galaxy redshift accuracy isz/(1þ
z)0:02 ( Wolf et al. 2004), allowing construction of0.1 mag accurate rest-frame colors and absolute magnitudes (accounting for distance andk-correction uncertainties). Astrometric accu-racy is0B1.
To explore galaxy morphology in the rest-frame optical from a single observed passband, we study galaxies in one thin red-shift slice. Here we select galaxies from COMBO-17 in the CDFS for morphological classification in the narrow interval 0:65z<
0:75 (corresponding tot0:5 Gyr, minimizing galaxy evolu-tion across this slice). At this redshift, F850LP samples roughly rest-frameVband, andSpitzer’s 24m passband samples
rest-frame 14m, allowing comparison with local samples.
Further-more, z0:7 is close to the median redshift of COMBO-17,
maximizing the sample size.
We use F850LP imaging from the GEMS survey ( Rix et al. 2004) to provide 0B07 resolution rest-frame V-band data for 1492 galaxies with 0:65z<0:75. GEMS surveys a280;
280portion of the CDFS in the F606W and F850LP passbands
to deep limits using the ACS ( Ford et al. 2003) onHST. The
GEMS area is covered by a multiple, overlapping image mosaic
that includes the smaller but deeper Great Observatories Ori-gins Deep Survey (GOODS) area (Giavalisco et al. 2004). One orbit per pointing was spent on each passband (63 GEMS tiles and 15 GOODS tiles), allowing galaxy detection to a limiting surface brightness within the half-light radius ofF850LP;AB
24 mag arcsec2( Rix et al. 2004). Atz¼0:7, ACS resolution corresponds to500 pc resolution, roughly equivalent to100 resolution at Coma Cluster distances.
Galaxy classification was carried out by eye on thez0:7 sample by E. F. B., C. W., and D. H. M. using the GEMS
F850LP imaging.11In what follows, we adopt by-eye
classifi-cation bins of E/S0, Sa–Sd, irregular/compact ( Irr), and pecu-liar/clearly interacting (Pec/ Int). Galaxies were classified on the basis of both central light concentration and smoothness. E/S0 galaxies were required to have dominant spheroids and smooth light distributions. Sa–Sd galaxies were required to have prom-inent disks with signs of ongoing star formation. Galaxies clas-sified as irregular are chosen to be similar in morphology to low surface brightness and Magellanic irregular galaxies in the local universe; their irregular light distributions appear to the eye to result from stochastic variations and bursts in their SFH rather than from any interaction. In contrast, the peculiar/clearly in-teracting designation requires that galaxies have signs of tidal features and /or multiple nuclei, with morphologies suggestive
of a major galaxy merger or merger remnant.12 These
classi-fications are discussed in detail and examples of each class are shown in Wolf et al. (2005).
Obviously, these classifications are subjective and depend on the depth of the imaging material. In particular, comparison with deeper GOODS data for a subset of 290 galaxies in this redshift slice has shown that the fraction of faint clearly inter-acting galaxies in GEMS is slightly underestimated ( Wolf et al. 2005). While the ideal solution would be to simply consider only the GOODS data, number statistics is a key limitation:
there are80 galaxies atz0:7 in the GOODS area that are
detected at 24m, compared to thek400 galaxies detected in
the whole GEMS area. We therefore choose to study galaxies from the whole GEMS area, adjusting the GEMS-only classi-fications as a function of IR luminosity to account for the un-derestimated faint interaction fraction. We address this topic and the scatter among the three different classifiers where
rel-evant inx5 and Appendix B.
2.3.Cross-Correlation of the IR and Optical Data
At this stage, we have simply correlated the 24m imaging
catalog with the COMBO-17 catalog. The 24m footprint does
not exactly match that of COMBO-17; of the 1727 COMBO-17
galaxies in our redshift slice, 1436 are covered by the 24m
data. A subsample of 1306 of these are covered by the GEMS
mosaic and have full morphological, 24m, and redshift
in-formation. Sources are matched within 200. Roughly 96% of
24m sources have only one match in the COMBO-17 catalog.
The other 4% have two matches in the COMBO-17 catalog; the
9
In the case where the stellar IMF varies as a function of time and /or from galaxy to galaxy, neither SFRs nor stellar masses will be robust except perhaps at the order-of-magnitude level.
10 To date, our preliminary tests indicate that the DAT reduction of MIPS 24m data is nearly identical to that provided by the Spitzer Science Center pipeline.
11
Automated classification using profile fitting is highly consistent with the by-eye classifications that we adopt here, in terms of differentiating between bulge-dominated galaxies and disk-dominated galaxies ( Bell et al. 2004). Work on automated diagnostics of galaxy interactions in GEMS is ongoing and will be discussed in a future work.
12
In many works galaxies that do not fit onto the Hubble sequence are labeled irregular, where no attempt is made to characterize the driver of the irregularities. Because we wish to gain insight into the role of interactions in driving the star formation activity of galaxies, we attempt, perhaps naively, to distinguish between galaxies with clear signs of interaction ( Pec/ Int) and those without ( Irr).
closest positional match is taken in these cases.13 A 24 m catalog constructed using optical positions as prior constraints would address many of these limitations but is challenging to implement at this stage; we defer a complete analysis of this type to a later date. In total, 442 galaxies with 0:65z<0:75
are detected at 24m and have a match in COMBO-17 (397
overlap with GEMS); the rest of the COMBO-17 sources
without 24 m detections are assigned 5 upper limits of
83 Jy.14 In Appendix A we explore the possibility that our
sample selection may be biased against highly obscured
IR-luminous galaxies. We find thatz0:7 IR-luminous galaxies
should be bright enough to be detected and successfully clas-sified by COMBO-17, suggesting that the sample selection and main conclusions of this paper should be robust to this potential source of incompleteness.
3. ANALYSIS
3.1.Estimatin
g
Total IR LuminosityLocal IR-luminous galaxies show a tight correlation between
rest-frame 12–15m luminosity and total IR luminosity (e.g.,
Spinoglio et al. 1995; Chary & Elbaz 2001; Roussel et al. 2001; Papovich & Bell 2002), with a scatter of0.15 dex. Follow-ing Papovich & Bell (2002), we use this correlation to
con-struct total IR luminosity from the observed-frame 24m data
(corresponding to rest-frame14m). We use the full range
of Dale et al. (2001) model template spectra to calculate the
conversion from observed-frame 24m to 8–1000 m total
IR luminosity;15we adopt the mean value as our estimate of IR luminosity and the rms as our estimate of conversion uncer-tainty. The mean correction factor corresponds approximately
toLIR10l(24m) to within 20%, wherel(24m) is the
monochromatic luminosity at observed-frame 24m; the
tem-plate scatter around this mean is larger, 0.3 dex. Different
choices of template (e.g., Devriendt et al. 1999) or the adoption of a luminosity-dependent conversion yield similar results. The 5detection limit of 83Jy corresponds to a limiting IR lumi-nosity of 6;1010L
, or6Myr1in terms of an IR-derived SFR.
The conversion from the 24m photometry to 8–1000m
IR luminosity should be accurate to within a factor of 2 or better, which is adequate for our purposes. There are two types of error. First, the conversion depends on fitting templates to the galaxy SEDs. There is a total range of a factor of 2 differ-ence between the conversions that would be predicted by vari-ous templates for galaxies in the appropriate luminosity range of1011L
( Devriendt et al. 1999; Dale et al. 2001; Chary & Elbaz 2001; Lagache et al. 2003, 2004). Second, there is a pos-sibility that the infrared properties of typical high-luminosity galaxies differ atz0:7 from those of the local galaxies used in developing the templates. The evidence available to us now
suggests that the IR SEDs ofzk0:7 seem to be adequately
spanned by the IR SEDs of local galaxies: the evolution of the mid-IR–radio correlation toz1 (e.g., Elbaz et al. 2002;
Appleton et al. 2004), 15–24 m flux ratios from ISO and
Spitzerfor galaxies at z1 ( Elbaz et al. 2005), and mid-IR
spectra fromSpitzer of z1 ultraluminous infrared galaxies
( ULIRGs; L. Yan 2004, private communication). This issue will be significantly clarified by future work fromSpitzerand
Herschel.
3.2.Estimatin
g
Star Formation RatesWe estimate SFRs using the combined UV and IR emission of the sample galaxies. This SFR estimator accounts for both direct light from young stars from the UV and obscured light from the IR, giving a complete census of the bolometric lumi-nosity of young stars in the galaxy (e.g., Gordon et al. 2000). The primary difficulties affecting this SFR estimator are (1) the poorly constrained fraction of IR light from dust heated by old stars and (2) geometry, in the sense that the IR light is radiated isotropically, whereas the UV light escapes along preferred di-rections (such as out of the plane of a disk galaxy). Future works will be able to address point 1 through more detailed model-ing of UV/optical / IR SEDs and will be able to ascertain to what extent averaging over inclination angles effectively addresses point 2.
In practice, we estimate the SFR using a calibration
de-rived from the PEGASE stellar population models (see Fioc & Rocca-Volmerange 1997 for a description of an earlier version of the model ), assuming a 100 Myr old stellar population with constant SFR and a Kroupa (2001) IMF:
M yr1
¼9:8;1011(LIRþ2:2LUV); ð1Þ whereLIR is the total IR luminosity andLUV¼1:5l;2800is a
rough estimate of the total integrated 1216–30008UV
lumi-nosity, derived using the 28008rest-frame luminosityl;2800
from COMBO-17. The factor of 1.5 in the 28008–to–total UV
conversion accounts for the UV spectral shape of a 100 Myr old population with constant SFR. The SFR is derived assuming thatLIRreflects the bolometric luminosity of young, completely obscured populations and thatLUV reflects the contribution of unobscured stars, which must be multiplied by a factor of 2.2
to account for light emitted longward of 30008and shortward
of 12168by the unobscured young stars. In practice, the SFRs are dominated by the IR contribution for the range of SFRs explored in this paper. This SFR calibration is derived under identical assumptions as the UV and IR SFR calibrations pre-sented by Kennicutt (1998). Our SFR calibration is consistent with Kennicutt (1998) to better than 30% once different IMFs are accounted for. Bell (2003) tested UV+IR-derived SFRs
against carefully extinction-corrected H and radio-derived
SFRs for a large sample of local star-forming galaxies, finding excellent agreement with 0.3 dex scatter and no offset. Accord-ingly, we adopt a systematic error estimate of 0.3 dex
(domi-nated by 24m–to–total conversion error) and 0.4 dex random
error (with contributions from both 24m–to–total conversion
and limitations in UV+IR-derived SFRs). These error estimates
are supported by comparisons between ISO 15 m–derived
SFRs with carefully constructed Balmer line SFRs for galaxies at 0<z<0:8: there was no offset between the SFR scales and 0.4 dex random scatter for SFRs less than 250Myr1( Flores et al. 2004).
3.3.Estimatin
g
Stellar MassTo understand how the instantaneous SFR in a galaxy com-pares with its mean past rate, it is necessary to estimate the existing stellar mass. Under the assumption of a universally applicable stellar IMF, there is a tight correlation between rest-frame optical color and stellarM/L, which is rather insensitive
13 This effect may lead to 1%–2% incompleteness if two sources with 24m emission are mistakenly blended into one source.
14 Sources near the map edges where the noise is nonuniform have been disregarded in this work.
15 Total 8–1000m IR luminosities are
0.3 dex higher than the 42.5– 122.5m luminosities defined by Helou et al. (1988), with an obvious dust temperature dependence.
to details of galaxy SFH, dust content, and metallicity (e.g., Bell & de Jong 2001; Bell et al. 2003; Kauffmann et al. 2003). On the basis of this correlation, we estimate stellar massMusing the rest-frameB- andV-band magnitudes:
log10
M
M
¼ 0:4(V4:82)þ ½ 0:628þ1:305(BV)0:15;
ð2Þ
where the0.15 dex term converts the stellar masses to a Kroupa
(2001) IMF.16Systematic and random errors in stellar masses
are roughly 0.3 dex, owing primarily to the effects of dust, gal-axy age, and bursts of star formation ( Bell & de Jong 2001; Bell et al. 2003; Franceschini et al. 2003). For stellar populations completely dominated byP1 Gyr old stars, the luminosity at a given color is roughly a factor of 3 higher than for galaxies with a wider range of stellar ages. Because equation (2) assumes a wide range in stellar age, the stellar masses of galaxies with recent very large bursts of star formation will beoverestimated.
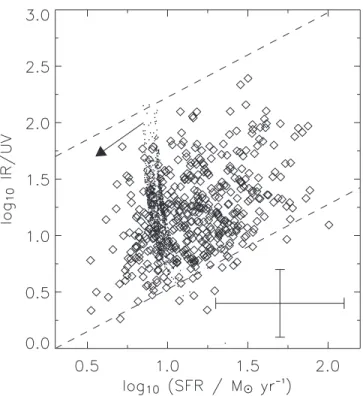
4. TRENDS IN IR-TO-UV RATIO WITH SFR The comparison of UV and IR luminosities shows that, both on a galaxy-to-galaxy basis and globally, the SFR estimates
dis-cussed below are essentially IR derived, with a minorP30%
contribution from the UV. To assess the relative importance of
UV and IR light in individual galaxies at z0:7, Figure 1
shows IR / UV as a function of SFR, as derived from the IR and UV luminosities using equation (1). The range of IR / UV and the trend with total luminosity in the z0:7 sample is very similar to that observed in the local universe (e.g., Wang & Heckman 1996; Adelberger & Steidel 2000; Bell 2003), indi-cating little or no evolution in the relative proportion of ob-scured star formation at least toz0:7.17This is illustrated in Figure 1, where the locus of local star-forming galaxies is also
shown.18Galaxies with SFRsk6M
yr1have IR / UVk10,
indicating that uncorrected UV SFRs are gross underestimates of the true SFR for the most intensely star-forming systems.
The cumulated total IR luminosity of all detected sources in this redshift slice is (7 3);1013 L, where the error bar is
dominated by our assumed error in 24m to total IR
conver-sion.19If we assign detections at 83Jy to all the upper limits, we derive an upper limit to the total IR luminosity of twice the value from the detected galaxies. This result agrees with the number counts and our current IR luminosity function es-timates, which indicate that about2
3of the total background at 24m is resolved at our detection limit ( Papovich et al. 2004; Le Floc’h et al. 2005). We conclude that the total IR luminosity
in this redshift slice is1014L. In comparison, the total UV luminosity in this redshift slice is (1:5 0:3);1013 L
when
the luminosity function is extrapolated to zero luminosity (using the 28008luminosity function determined for this redshift slice by Wolf et al. 2005).20Thus, atz0:7, the ratio of IR to UV luminosity density is7þ43.
5. EXPLORING THE RELATIONSHIP BETWEEN STAR FORMATION RATE AND MORPHOLOGY
In this section, we explore which types of galaxies account for the bulk of star formation in thez0:7 universe, when the universe was only half its present age.
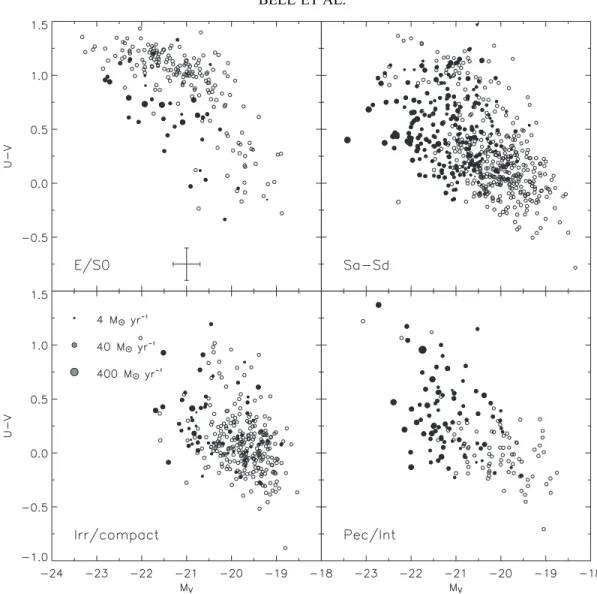
5.1.The Relationship between Optical Properties and Star Formation
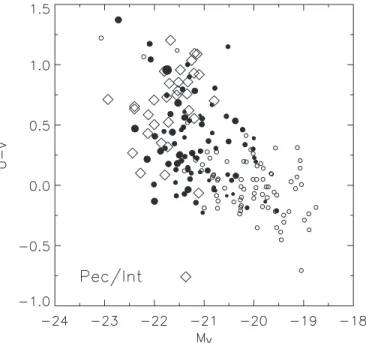
In Figure 2, we show the rest-frame opticalUVcolor and
V-band absolute magnitude of all galaxies in the 0:65z<
0:75 slice, split by visual morphological type. Filled symbols
denote galaxies detected at 24m, while open symbols denote
galaxies for which only 24 m upper limits (83 Jy) were
available. In both cases, symbol size scales with the logarithm of SFR or its upper limit.
Among visually classified E /S0 galaxies, those that are blue in the optical are also clearly detected at 24m. Ignoring for the moment active nuclei (seex7), we attribute this 24m flux to
Fig.1.—IR / UVas a function of SFR. Diamonds show galaxies detected with MIPS at 24m, whereas points show 24m upper limits for galaxies not detected by MIPS; these limits will move toward the lower left with a slope of unity as shown by the arrow and therefore are consistent with the trend observed for the detected galaxies. The dashed lines outline the local relation as derived by Adelberger & Steidel (2000). The error bars show our uncertainty estimates: 0.3 dex in IR / UV (dominated by 24m–to–total conversion uncertainty) and a 0.4 dex SFR uncertainty.
16 More sophisticated stellar mass estimates, based on direct modeling of COMBO-17’s observed 17-passband SED (A. Borch et al. 2005, in prepara-tion), agree with these color-based estimates with no systematic offset and
P40% random scatter.
17 This is also consistent with a sample of very luminous IR-luminousz 1 starbursts from a 15m–selectedISOsample (Aussel et al. 1999, as discussed by Adelberger & Steidel ).
18
This has been adapted from their Fig. 11a, where log10SFRlog10(L1600þ Lbol;dust)9:7, accounting for our adoption ofH0¼70 km s1Mpc1. The UV luminosity is estimated byLUVf;1600(derived using PEGASE for a 100 Myr old stellar population with constant SFR; coincidentally, the UV spectral shape cancels out, leaving 1216–30008luminosity equal to monochromatic 16008 luminosity). These estimates of SFR and IR / UV should be consistent with our estimates, to within the considerable systematic uncertainties.
19
This is the total luminosity in the volume-limited 0:65z<0:75 sample and so is in essence a luminosity density. We choose to express quantities in terms of total luminosities at this time owing to concerns about cosmic variance. This topic is considered in more detail by Le Floc’h et al. (2005).
20 It is worth noting that there is a difference in how we define luminosity densities compared with Wolf et al. (2003, 2005). These papers express lumi-nosity densities in terms of monochromatic solar luminosities at a given rest-frame wavelength, whereas we choose to presentLUVin terms of bolometric solar luminosities.
rapid star formation. In contrast, there are very few galaxies on the red sequence with 24m detections. Thus, red E /S0 galax-ies are IR-faint, which suggests that their red optical colors are the result of dominant old stellar populations, not dust-obscured star formation.
Blue visually classified spiral galaxies (Sa–Sd) are frequently detected in the IR. Many optically red spiral galaxies are IR-faint and are thus red because of their ancient stellar populations. Yet, a rather higher fraction of red spirals are detected at 24m com-pared to red E /S0 galaxies, especially at fainter optical luminosi-ties, indicating a more important role for dust-reddened spiral galaxies. Morphologically classified irregular galaxies are typi-cally somewhat less luminous, and owing to their lower SFRs are less frequently detected by MIPS; however, they are quali-tatively similar to low-luminosity spirals.
The vast majority of visually classified peculiar and clearly interacting galaxies are detected at 24m; indeed, the few non-detections are almost all relatively faint and are not expected to be detected at 24m for plausible UV/ IR ratios. Interestingly,
most red Pec/ Int galaxies are strong 24m sources
(includ-ing the brightest galaxy at 24m in the 0:65z<0:75 slice, which is an interacting galaxy on the blue edge of the red se-quence). Therefore, we conclude that (1) almost all of our
vi-sually classified Int / Pec galaxies are intensely star-forming at the epoch of observation and (2) the optical colors of Int / Pec galaxies largely reflect their dust content, rather than their SFH. In summary, the optical color of morphologically undisturbed galaxies (E /S0 and Sa–Sd galaxies) reflects SFH in a broad sense: most red early-type galaxies and a significant fraction of red spi-ral galaxies are non–star-forming, whereas the blue early- and late-type galaxies have important amounts of current star for-mation as probed by the IR. In contrast, clearly interacting and peculiar galaxies have strong IR-luminous star formation irre-spective of their optical properties (as is expected of very dusty star-forming systems).
5.2.The Contribution of Different Galaxy Types to the Cosmic SFR
An important question is the relative contribution of galaxies with different morphological types to the total SFR density at
z0:7. The cosmic-averaged SFR has dropped by a factor of 3 sincez0:7 as measured in the IR (e.g., Flores et al. 1999; Pozzi et al. 2004), radio (e.g., Haarsma et al. 2000), H(e.g., Tresse et al. 2002; Pe´rez-Gonza´lez et al. 2003), or UV (e.g., Lilly et al. 1996; Schiminovich et al. 2005). Thus, an under-standing of the relative contribution of different galaxy types to
Fig.2.—Rest-frameUV color of 1436 optically selected 0:65z<0:75 galaxies from COMBO-17/GEMS as a function of visually classified rest-frame V-band galaxy morphology (classifications are adopted at random from three classifiers). Symbol size scales with the logarithm of the estimated SFR: filled circles denote galaxies with MIPS 24m detections (therefore the symbol size denotes SFR estimated using IR+UV ), whereas the open circles show upper limits on the SFR, derived using the observed UV luminosity and the upper limits on 24m flux.
the cosmic SFR atz0:7 will constrain the types of galaxy that need to ‘‘switch off ’’ their star formation activity betweenz
0:7 and the present day, giving insight into the physical mech-anisms driving this evolution.
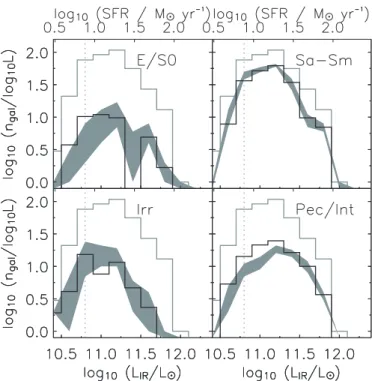
In Figure 3, we show the distribution of estimated IR lumi-nosity as a function of galaxy type for 24m–detected galaxies
atz0:7; the top axes show the equivalent SFRs. We choose
not to normalize the luminosity function to the observed vol-ume at this stage owing to concerns about cosmic variance (e.g., Somerville et al. 2004); a thorough analysis of evolution in the IR luminosity function is presented in a companion paper by Le Floc’h et al. (2005). We do not extrapolate the IR luminosity function below the 24m detection limit at6;1010L
. The IR luminosity density for 10:7Plog10(LIR/L)P11:5 is dominated by spiral galaxies, with an important contribution from clearly interacting galaxies. Morphologically classified E /S0 gal-axies and irregulars contribute, but they play lesser roles. Clearly interacting galaxies make an increasingly important contribution at log10(LIR/L)k11:3. This behavior resembles that in the local universe, where almost all galaxies with log10(LIR/L)k11:8 show clear signs of interaction (Sanders & Mirabel 1996). Inte-grating over the whole distribution of galaxies detected at 24m, we find that the fractional contributions of spiral, E /S0, Pec/ Int, and irregular galaxies to the total integrated IR luminosity density are 0.51:0.10:0.28:0.11.
To probe the uncertainties in the relative contributions to the SFR density from different galaxy types, we explore two limiting cases: (1) all 24m nondetections have no IR flux (i.e., their
SFR is measured purely from the UV ); or (2) all 24m
non-detections emit at the detection upper limit at this wavelength of 83Jy. In the first case, the split of SFR is (spiral:E /S0:
Pec/ Int:Irr) 0.51:0.10:0.26:0.13, very similar to the split in terms of observed IR flux ( because the UV is a relatively small contribution to the total SFR density). In the second case, where limits are all taken to be marginal detections, the split is 0.47:
0.15:0.18:0.20. Because of the preponderance of E /S0 and Irr nondetections, the relative importance of these classes is in-creased (arguably, rather artificially). In neither of these cases are the contributions from optically faint galaxies (i.e., those gal-axies fainter thanMVk19) accounted for. Because the
inte-gral over a luminosity function is dominated byL galaxies,
our limitation to relatively bright sources does not prevent us from qualitatively constraining the contribution of different gal-axy types. Nonetheless, it is clear that the detailed form of the distribution of SFRs to lower limits will importantly affect the quantitative contributions of the different galaxy types and is arguably the largest source of systematic uncertainty in this paper.
To summarize, the SFR density atz0:7 is dominated by
morphologically normal spiral, E /S0, and irregular galaxies
(k70%). Clearly interacting galaxies account for P30%. Our
result is based on a combination of UV and IR luminosities but is dominated by IR-luminous objects. Wolf et al. (2005) have ex-amined the UV-luminous objects alone and also find that most of the rest-frame UV flux density atz0:7 is in morphologically undisturbed galaxies.
These results have important implications for the physi-cal mechanisms that drive the factor-of-3 decline in cosmic-averaged comoving SFR density fromz0:7 to the present day. Because clearly interacting galaxies—with morphologies sugges-tive of major galaxy mergers or merger remnants21— contribute much less than half of thez0:7 SFR density, the drastic de-cline in cosmic SFR is onlypartiallydriven by the decreasing fre-quency of major galaxy mergers at the present day (e.g., Le Fe`vre et al. 2000; Patton et al. 2002). Instead, the dominant driver is a strong decrease in SFR in morphologically undisturbed spiral galaxies. It is possible that the decreasing star formation activ-ity of spiral galaxies is driven primarily by gas supply and con-sumption in a purely quiescent mode of star formation. However, it is also possible that even in spiral galaxies much star formation activity is triggered by relatively minor tidal interactions, which function to trigger internal instabilities such as spiral arms or bars, enhancing their SFR. Our observations cannot sensitively test these competing hypotheses at this stage: deeper redshift surveys and exploration of their gas content through, e.g., CO mass determination from the Atacama Large Millimeter Array will start to allow us to test the relative importance of these phys-ical processes.
6. EXPLORING THE DEMISE OF STAR FORMATION IN MASSIVE GALAXIES
We turn now to exploring the relationship between SFR and stellar mass atz0:7, comparing it to that atz0. We choose to explore the ‘‘specific SFR,’’ i.e., the SFR per unit stellar mass. This is closely related to the more model-dependent birthrate parameter,b¼SFR /hSFRi, wherehSFRiis the past-averaged
Fig.3.—Estimated 8–1000m luminosity function, split by morphological type for 397 galaxies at 0:65z<0:75. Only galaxies detected at 24m are shown, and no attempt to extrapolate to lower IR luminosities has been made; the sample is grossly incomplete below6;1010L
as denoted by the gray
dotted line. In each panel, the gray solid histogram shows the total IR luminosity function. The shaded area shows the IR luminosity function split by galaxy type using GEMS-derived galaxy classifications, where the extent of the shaded area explicitly shows the differences in IR luminosity function given by the three different classifiers. The black histogram shows the IR luminosity function, averaged over the three different classifiers and corrected to reproduce the in-creased fraction of clearly interacting galaxies seen in GOODS-depth data, as described in Appendix B.
21 It is worth noting that relatively advanced merger remnants are also classified as clear interactions, until their tidal features have dissipated. Owing to the long dynamical times at large galactic radii, we expect that major mergers are classified as clearly interacting well after the major final burst of star for-mation has ceased.
SFR. The past-averaged SFR is estimated by dividing the stellar mass by the elapsed time since star formation began in a given galaxy (see, e.g., Kennicutt et al. 1994), adjusting for the mass lost by the stellar population as it ages. Roughly 50% of initially formed stellar mass is lost within 109 yr for a Kroupa (2001) IMF; therefore,b’SFR /(2M/tsf). In estimatingtsf, we sim-plistically assume that the epoch of first star formation is at
zf ¼4 for all galaxies; using a present-day age of the universe
of 13.5 Gyr, this corresponds totsf 12 Gyr atz0 andtsf 6 Gyr atz0:7. Despite the extra model dependence introduced by having to assume a timescale when derivingb, birthrate has the attractive feature that it compares the observed SFR with the SFR required to build up the existing stellar mass within a Hubble time (at that epoch).
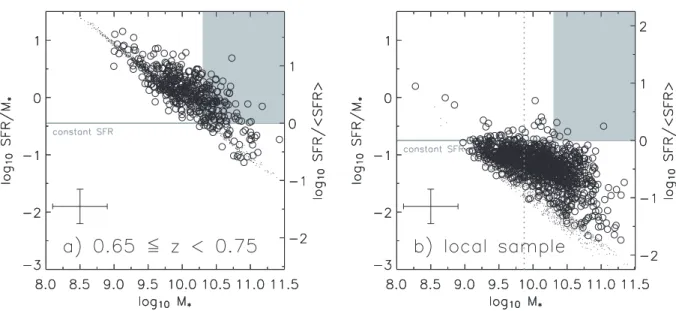
In Figure 4a, we show specific SFR as a function of
stel-lar mass for the 1436 0:65z<0:75 galaxies in our sample.
Owing to the detection limit of the 24m observations, it is
impossible to detect galaxies forming stars at anything less than a constant rate (SFR /MP0:4, or equivalentlybP1) for stellar masses less than2;1010M. Yet, despite this rather strin-gent limitation, large numbers of galaxies have been detected at 24m, with typical specific SFRs of1 Gyr1(i.e., if the cur-rent SFR were to continue at its present rate, the stellar mass of the galaxy would double within 2 Gyr, remembering that 50% of the mass initially in stars is returned to the gas phase by stel-lar winds and supernovae).
Given the existence of an important population of intensely star-forming galaxies atz0:7, it is instructive to explore how this compares with the properties of star-forming galaxies in the local universe. We have therefore constructed a local ‘‘control’’
sample of galaxies, which we show in Figure 4b. We use the
NASA / IPAC Extragalactic Database ( NED) to select a pseudo–
volume-limited sample in the range 1500cz/ km s13000
with 2MASSK-band magnitude cutK<12, and Galactic lati-tudeb>30. This sample is complete for galaxies aboveMK< 19:6. Where they were defined, IR fluxes were also taken from
NED; total 8–1000 m IR fluxes were estimated following
Appendix A of Bell (2003) and are accurate to30%. Upper
limits on IR flux were roughly estimated assuming total IR fluxes just at the IRAS detection limit of 3;1011 ergs cm2 s1 (the conclusions do not depend on the choice of this limiting flux). A legitimate and unavoidable concern is the inhomoge-neous completeness properties of NED redshifts. For the pur-poses of volume estimation, we estimate an overall NED redshift completeness from the number of K<12, b>30 galaxies with redshifts divided by the number of K<12,b>30 gal-axies both with and without redshifts: 14350/23658 (or 61%). Thus, the estimated total volume probed is 71;500;0:61 Mpc3. The total sample is 2177 galaxies, 1089 with IR detections and 1088 with only IR upper limits. In fact, because of large-scale overdensities in this volume, there are3 times more galaxies in this volume than one would expect on the basis of, e.g., the stel-lar mass functions orK-band luminosity functions of Cole et al. (2001) or Bell et al. (2003), taking into account all the relevant selection limits. To reflect this overdensity, we assign an ‘‘ef-fective volume’’ to the sample of1:2;105Mpc3; this effective volume matches the actual volume in the 0:65z<0:75 slice. Accordingly, we use this control sample unaltered, with the ra-tionale that in the two panels of Figure 4 we are comparing gal-axies from the same effective volumes at both cosmic epochs. None of our conclusions are affected by the detailed choice of volume or, indeed, comparison sample. Different NED-derived samples can be chosen, or a sample of GEMS/ MIPS galaxies with redshifts 0:1z<0:2 can be used as a control, with un-changed results but a reduced number of comparison galaxies.
Stellar masses and SFRs for the local comparison sample were estimated assuming a Kroupa IMF. Stellar masses were estimated directly from theK-band absolute magnitudes (where Hubble flow distances are used, for simplicity) assuming a sin-gle K-band stellarM/Lof 0.6 in solar units, appropriate for a Kroupa IMF (following Bell et al. 2003; Cole et al. 2001). SFRs were estimated from total IR flux following equation (4) of Bell (2003) adjusted to a Kroupa IMF and are not corrected for any (typically modest;P30%) contribution to the dust heating from
Fig.4.—Specific SFR as a function of galaxy stellar mass, in solar units. (a) SFR per Gyr per unit stellar mass as a function of stellar mass for thez0:7 galaxy sample. Plotted on the right-hand axis is the birthrate parameterb¼SFR /hSFRi. Galaxies detected at 24m are shown with open circles; nondetections have upper limits shown by points. (b) SFR per Gyr per unit stellar mass as a function of stellar mass for the local comparison sample. Again, the birthrate parameter is plotted on the right-hand axis for comparison [the offset between (a) and (b) is because of the difference in the age of the universe at the two redshift intervals of interest]. IR detections are shown as open circles; nondetections are denoted by points. The dotted line shows the minimum mass for which the sample is complete. In both panels, the solid gray line shows a birthrate of unity; i.e., a constant SFR through all of cosmic history. The gray box shows the position of intermediate- and high-mass galaxies with ongoing bursts of significant star formation (b>1). Both data sets sample1:2;105Mpc3; therefore, direct comparison of both plots is fair, remembering the influence of the detection limits.
old stellar populations ( like the SFR estimates constructed using the 24m data). The stellar masses and SFR estimates are accurate to0.3 dex, assuming a universally applicable stellar IMF, and are directly comparable with stellar masses and SFRs for thez0:7 redshift slice.
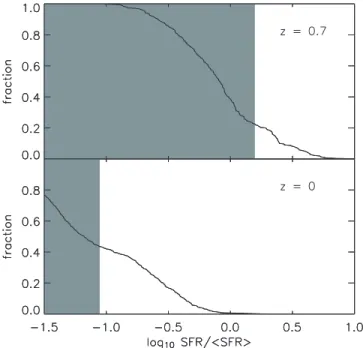
We compare the distribution of specific SFRs and stellar masses in thez0:7 sample and the local control sample in Figure 4; the cumulative histogram of birthrates is given in Figure 5. Both data sets effectively sample1:2;105Mpc3; therefore, in the regions where both data sets are complete, it is fair to com-pare the relative distributions of datapoints. The local sample is characterized by a broad distribution of star-forming galax-ies with specific SFRs between 0.03 and 0.2 (0:1PbP1, i.e., slowly declining SFR through cosmic history). Furthermore, where the detection limits permit, one observes a sizeable pop-ulation of galaxies with very low specific SFRsP0.01, indic-ative of a largely non–star-forming subpopulation of ( primarily early type) galaxies. There are very few galaxies with bursts of star formation that are adding significantly to their exist-ing stellar mass (i.e., birthrates bk1). In particular, at stellar
masses in excess of 2;1010 M, where the sample is
essen-tially complete, five of 699 (<1%) galaxies haveb1 ( Fig. 4,
gray shaded region).22 While there are significant systematic uncertainties in both SFR and stellar mass, it is impossible to accommodate a large population of starbursting intermediate-and high-mass galaxies in the local universe. This result is in-sensitive to the adoption of a variety of plausible prescriptions for SFR and stellar masses, and indeed the rarity of galaxies withb1 atM>2;1010 M
is apparent from Figure 24 of
Brinchmann et al. (2004), who analyze accurate emission-line– derived SFRs from the Sloan Digital Sky Survey.
In stark contrast, turning to thez0:7 sample, there are a large number of massive galaxies with intense star formation.
Quantitatively, at stellar masses in excess of 2;1010 M, 120 of 311 (39%) of galaxies are forming stars at a rate faster than their past-averaged rate (b1; Fig. 4,gray shaded region).23 While there are always significant systematic uncertainties, including estimation of total IR luminosity, SFRs, and stellar masses, these differences are large enough to be robust to sys-tematic uncertainties of greater than a factor of 3.24In addition, where possible we have minimized the opportunities for sys-tematic error by using IR-derived SFRs in both cases, and equivalent SFR and stellar mass calibrations. Indeed, adoption of the 0:1z<0:2 GEMS/ MIPS sample as the ‘‘local’’ con-trol sample yields only one galaxy withb1 out of 41 galaxies
withM2;1010M. In this case, identical methodologies
have been used for the 0:1z<0:2 and 0:65z<0:75 samples.
Recalling the conclusions reached inx5, it is worth briefly
commenting on the visual morphologies of galaxies withM
2;1010 M
. Seventy of 124 massive spiral (Sa–Sd) galaxies,
four of five massive irregular galaxies, and 18 of 23 Pec/ Int gal-axies haveb1, i.e., are undergoing significant bursts of star formation. In contrast, only 20 of 138 massive E /S0 galaxies are forming stars intensely.25Therefore, roughly12of spiral, irreg-ular, and clearly interacting galaxies are undergoing starbursts at
z0:7. Furthermore, the starbursting population is dominated by spiral galaxies rather than Pec/ Int galaxies. This reinforces the conclusions ofx5; even among the most intensely star-forming
z0:7 galaxies, the vast majority are not forming stars intensely because of a recent major merger.
Taken together, it is fair to conclude that while a large frac-tion of intermediate- and high-mass galaxies were forming stars intensely 7 Gyr ago, almost none are at the present epoch. Fur-thermore, these intensely star-forming galaxies are primarily morphologically undisturbed, indicating that major mergers are not responsible for the bulk of this intense star formation. Instead, physical properties that do not strongly affect galaxy morphology—for example, a larger abundance of gas at earlier times or weak interactions with small satellite galaxies—appear to be responsible for the high SFRs.
7. DISCUSSION
7.1.Comparison with Pre
v
ious ResultsOur results confirm and extend the previously observed rapid evolution in the number of IR-luminous galaxies at interme-diate and high redshift (e.g., Elbaz et al. 1999; Chary & Elbaz 2001; Papovich et al. 2004) and with the drastic decline in the space density of intensely star-forming galaxies as probed with a variety of different SFR indicators (e.g., Cowie et al. 1996; Wolf et al. 2003; Bauer et al. 2005). Furthermore, we have been able to estimate the stellar masses of these intensely star-forming sys-tems, finding that almost all of the intensely star-forming galaxies withLIRk1011 L( luminous infrared galaxies [ LIRGs]) seen at intermediate redshift have stellar masses in excess of1010M
Fig.5.—Cumulative distribution of the birthrates of massive galaxies with M>2;1010M. The gray shaded region denotes the area over which upper
limits on birthrates contribute to the distribution (i.e., the shape of the cu-mulative distribution in the gray shaded area is strongly biased toward high birthrates).
22
Galaxies withM>2;1010M
contain roughly 70% of present-day
stellar mass ( Bell et al. 2003).
23 If starbursts were defined by high specific SFRs instead, the difference betweenz0:7 and the present day would be even more striking.
24 It is likely that our neglect of heating of dust by old stellar populations affects galaxies with lowb-values preferentially, artificially inflating their es-timates of SFR and thereforeb. From inspection of Fig. 4 this is likely to affect the most massive galaxies the most severely and will affect the low-redshift sample more acutely than thez0:7 sample. Thus, if the heating of dust by old stars were accounted for by detailed SED modeling, it is likely that the con-clusions would remain unchanged or further strengthen.
25
The total is 290 galaxies, which is lower than the COMBO-17+MIPS number of 311 galaxies owing to the smaller areal coverage of GEMS.
( Fig. 4). This is in agreement with, e.g., Franceschini et al. (2003) and Zheng et al. (2004), who used optical and NIR data to
esti-mate the stellar masses of ISOCAM 15m–selected LIRGs,
find-ing stellar masses in excess ofk1010M, and Le Floc’h et al. (2004), who explore the properties of 26 1PzP2:5 IR-luminous sources withSpitzer, finding significant stellar masses for their sample of LIRGs.
Our conclusion that a decline in major interaction rate is not
the primary cause of the decline in cosmic SFR sincez0:7
also confirms and extends previous observations. Follow-up observations of fields targeted byISOtentatively suggested that the rapidly evolving IR-luminous population may not be com-posed exclusively of strongly interacting galaxies. Flores et al. (1999) found that only six of 16 galaxies in a sample withISO
andHSTdata had strongly disturbed morphologies, while the
rest were disk-dominated, E /S0, or unresolved. Zheng et al.
(2004) extended their work to a sample of 36 ISO-selected
LIRGs atz1:2, finding that 17% of their sample were
ob-vious mergers and placing an upper limit of 58% on the merger fraction. Our study places these indications on firm ground, pushing to fainter limits of6;1010L
with an order of
mag-nitude larger sample of galaxies.
7.2.How Much Dust Can Be Heated by AGNs at z0:7?
It is worth discussing the contribution of AGNs to the 24m total luminosity density. To aid in identifying AGNs, we use the
Chandra data for the CDFS to select AGN candidates. The
Chandrafootprint on the CDFS (Alexander et al. 2003) is con-siderably smaller than the GEMS and MIPS coverage of the field; therefore, in this section we consider only galaxies fall-ing completely within theChandracoverage. This area contains 3122 galaxies with COMBO-17 photometric redshifts; the small
subsample classified by COMBO-17 as galaxies with 0:65
z<0:75 and detected byChandracomprises 22 galaxies; 0.5– 8 keV source fluxes and errors are taken from Alexander et al. (2003).
While highly luminous X-ray sources are invariably AGNs, at fainter limits a contribution from star-forming galaxies is
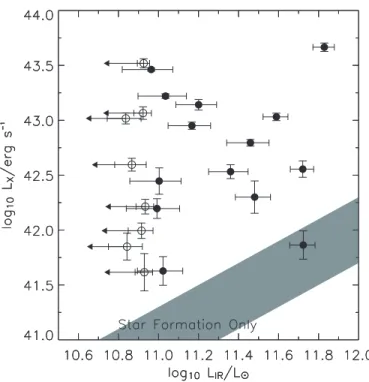
expected. To test this possibility, we compare 24m–derived
IR luminosities and X-ray luminosities for these 22 z0:7
galaxies in Figure 6. The shaded area shows the expected locus of star-forming galaxies, derived from the empirical relation-ship between X-ray andk-corrected 1.4 GHz radio luminosities ( Fig. 1 of Cohen 2003) coupled with the radio SFR calibration of Bell et al. (2003), accounting for the 0.3 dex empirical scatter in the correlation.26It is clear that only one galaxy has X-ray
emis-sion that is consistent with a star formation origin; the others have excess X-ray emission indicative of an AGN contribution. Considering the 21 AGN-dominated X-ray sources, we find a total IR luminosity between 3:4;1012and 4;1012L, where in the first instance we ignore upper limits and in the second instance we take upper limits to represent marginal detections. The total IR luminosity inalldetected sources in theChandra
footprint is 2:6;1013 L
, increasing to 5:4;1013 Lif all non-detections are taken as marginal non-detections at the 83Jy limit.
Accordingly, we estimate that P15% of the total IR 0:65
z<0:75 luminosity density is in sources with significant AGN emission. Clearly, the contribution to the IR luminosity density
of AGN-heated dust may be substantially lower, as the IR lumi-nosity in these galaxies may come from star formation. On the other hand, we have not accounted for any contribution of AGNs to the IR luminosities of galaxies not detected byChandra;
bear-ing in mind that theChandraobservations reach deep enough
to start probing star formation–powered X-rays from galaxies
with LIR1011 L, one hopes that the AGNs in
non–AGN-dominated galaxies will be weak and will contribute relatively little to the total IR. This conclusion is consistent with recentISO
and Spitzerresults, finding 10%–20% contributions at 15 and 24m, respectively ( Fadda et al. 2002; Franceschini et al. 2005), and with Silva et al. (2004), who model the AGN contribution to the IR background, suggesting that 10%–20% of the IR back-ground at mid-IR wavelengths is from AGNs and their host gal-axies (the AGNs alone account for 5% of the IR background in this model).
7.3.Comparison with Theoretical Expectations
Gasdynamical processes, such as star formation or feedback, are currently very challenging to include in models of galaxy formation and evolution, owing largely to important resolution limitations. As a result of the complexity of these processes, it has been impossible to converge on a robust description of star formation; instead, a wide range of empirically motivated pre-scriptions on kiloparsec or larger scales have been adopted (e.g., Somerville & Primack 1999; Springel & Hernquist 2003a; Barnes 2004). Current models tend to reproduce the cosmic SFH reasonably well (e.g., Cole et al. 2000; Somerville et al. 2001; Springel & Hernquist 2003b). A few models have started to incorporate detailed dust prescriptions and can model the evo-lution of IR-bright galaxies (e.g., Granato et al. 2000; Balland et al. 2003). While the progress is very encouraging, detailed observations such as the 24m number counts are rather poorly reproduced by the models ( Papovich et al. 2004), reflecting the
Fig.6.— Comparison of 0.5–8 keV observed-frameChandraX-ray lumi-nosities with 24m–derived total IR luminosities for the 22 0:65z<0:75 Chandra-selected galaxies with optical detections. Filled circles denote MIPS detections, whereas open circles with limits denote MIPS upper limits only. The IR luminosity errors include uncertainty in conversion to total IR. The shaded area shows the expected locus of star-forming galaxies.
26 This locus does not account for the mild X-rayk-corrections in the ob-served frame 0.5–8 keV X-ray luminosity but was defined for galaxies with 0:4PzP1:3 with a median redshift of 0.76 and so will be accurate to0.1 dex (Cohen 2003). It is worth noting that the use of the SFR calibration of Cohen (2003) results in a similar locus to within 0.1 dex.
difficulty of the ‘‘gastrophysics’’ that must be tackled to properly reproduce the full richness of the observational data sets. For this reason, we focus in this section on qualitative features of the models, rather than a detailed comparison of IR luminosity func-tions, or the distribution of stellar masses and morphologies as a function of IR luminosity.
Somerville et al. (2001) present a ‘‘collisional starburst’’ model, in which major (with mass ratios<4:1) and minor (with mass ratios between 4:1 and 10:1) mergers trigger an episode of rapid star formation, with a star formation efficiency that in-creases toward lower mass ratio (i.e., is higher for major merg-ers). Atz0, Somerville et al. (2001) predict that 35% of star formation is triggered by minor mergers and 2.5% of star for-mation is triggered by major mergers. Atz0:7, 50% of star formation is triggered by minor mergers and 3.5% by major mergers. Thus, they predicted that the steep drop in the cosmic
SFR sincez1 is not caused by changes in the major merger
rate; however, in their model a significant part of the drop re-flects a declining rate of minor mergers. There are a number of important uncertainties: a lowered star formation efficiency in minor interactions would shift more star formation into major mergers because more gas would be available to form stars in major mergers, tidal interactions (e.g., flybys) are not included in the model, untriggered star formation in a galaxy with trig-gered star formation is not included in the census of trigtrig-gered star formation, and our observational census of ‘‘clearly inter-acting’’ galaxies may well include a significant fraction of mi-nor mergers and tidal interactions.
Nonetheless, it is encouraging that the observations and at least this model are reasonably consistent in the sense that ma-jor galaxy mergers do not drive the declining cosmic SFR from
z1 to the present day. At present, models cannot clearly pre-dict which processes dominate: while minor mergers and tidal interactions may dominate (Somerville et al. 2001), it is also possible that a dwindling gas supply could dominate (Cole et al. 2000; Somerville et al. 2001), depending on the efficiency of triggered star formation in the real universe.
7.4.Impro
v
ementsThere are a number of areas that need to be improved to more fully understand these results and to illuminate the physics driv-ing the cosmic SFH. We mention a few specific examples here. A more complete, ground-based and IRAC near-IR–selected photometric and /or spectroscopic sample covering comparable or larger areas will be required to push our understanding past
z1, into the regime where we observe rapid cosmic star
for-mation. A wide range of morphological disturbance diagnostics must be developed and robustly tested (see, e.g., Conselice et al. 2003; Lotz et al. 2004 for some promising examples of this kind
of technique). TotalLIR and SFR calibrations must be tested
thoroughly using IR spectral data coupled with 70 and 160m
imaging data where available. This must be accompanied by a fuller analysis of local, well-studied control samples to explore
the fraction of LIR coming from dust heated by optical light
from old stellar populations, and possible metallicity depen-dences in IR SEDs. The IR properties of high-redshift AGNs must be better constrained, including constraints on the fraction of light emitted by AGN-heated dust compared with dust heated by associated star formation in the AGN host. Yet, the two main conclusions of this paper—the rapid demise of
intermediate-and high-mass star-forming galaxies betweenz0:7 and the
present day, and the limited importance of major mergers in driving the declining cosmic SFR—are likely to hold even after these studies are completed.
8. CONCLUSIONS
In this paper, we have explored the 24m–derived IR
prop-erties of an optically selected sample of 1436 galaxies with 0:65
z<0:75 in the CDFS. Optical IDs, photometric redshifts, and morphologies were obtained from the COMBO-17 and GEMS surveys. From examination of local LIRGs and ULIRGs and ex-ploration of COMBO-17’s photometric redshift accuracy as a function of IR luminosity, we argue that the optical selection should not introduce any special bias against intensely star-forming obscured galaxies. Under the assumption that the mid-IR prop-erties ofz0:7 galaxies are spanned by calibrating samples in the local universe, we have derived total IR luminosities for the 442 galaxies detected at better than 5at 24m. We used these data, in conjunction with the optical data, to estimate SFRs and stellar masses.
We have found the following:
1. Galaxies with X-ray–luminous AGNs contributeP15%
toward the integratedz0:7 IR luminosity density.
2. The IR-to-UV ratio is a strong, increasing function of total SFR; this relation shows ak0.5 dex scatter. There is no evi-dence for evolution of this relationship over the last 7 Gyr.
3. Morphologically normal galaxies show a strong relation-ship between their optical and IR properties. Optically blue early-type and spiral galaxies are IR-bright. Optically red early-early-type galaxies and a significant fraction of red spiral galaxies are not
detected at 24m. Most galaxies on the red sequence are
gen-uinely old, red, and dead.
4. Dust strongly shapes the optical properties of morpho-logically peculiar galaxies. The majority of obviously interacting galaxies are detected at the star formation–sensitive 24m band, despite showing the full range of optical colors from very blue through to very red.
5. Clearly interacting galaxies with morphologies suggestive of major galaxy mergers contribute at most 30% of the integrated IR luminosity density atz0:7. Bearing in mind that there is a factor of 3 reduction in cosmic IR luminosity density between
z0:7 and the present day, this suggests that a declining major merger rate can only form a small part of this drop in cosmic SFR. 6. Morphologically normal galaxies (spirals, ellipticals, and Magellanic irregulars) form more than 70% of the integrated IR luminosity density in thez0:7 slice. This implies that phys-ical processes that do not strongly affect galaxy morphology, such as gas consumption and weak tidal interactions with small satellite galaxies, are likely responsible for the drastic decline in cosmic SFR sincez0:7.
7. Atz0:7, nearly 40% of intermediate- and high-mass
galaxies are actively starbursting (i.e., they have M2;
1010 M
andb1). In contrast, only 1% ofz0 galaxies with
M2;1010M are undergoing such active star formation.
The declining SFR sincez0:7 is driven by drastic evolution in the SFRs of intermediate- and high-mass galaxies, rather than starbursting dwarf galaxies.
This work is based (in part) on observations made with the
Spitzer Observatory, which is operated by the Jet Propulsion Laboratory, California Institute of Technology, under NASA contract 107. Support for this work was provided by NASA through contract 960785 issued by JPL /Caltech. Support for the GEMS project was provided by NASA through grant GO-9500 from the Space Telescope Science Institute, which is operated by the Association of Universities for Research in Astronomy,
Inc., for NASA, under contract NAS5-26555. E. F. B. was supported by the European Community’s Human Potential Program under contract HPRN-CT-2002-00316, SISCO. C. W. was supported by a PPARC Advanced Fellowship. D. H. M. ac-knowledges support from NASA under LTSA grant NAG5-13102 issued through the Office of Space Science. This publication made use of NASA’s Astrophysics Data System Bibliographic Ser-vices. This research has made use of the NASA /IPAC
Extra-galactic Database ( NED), which is operated by the Jet Propul-sion Laboratory, California Institute of Technology, under con-tract with the National Aeronautics and Space Administration. This publication makes use of data products from the Two Micron All Sky Survey, which is a joint project of the University of Massachusetts and the Infrared Processing and Analysis Center /California Institute of Technology, funded by NASA and the National Science Foundation.
APPENDIX A
ARE MOST STARBURSTS IN THE COMBO-17 SAMPLE?
A possible source of bias could be that the most heavily obscuredz0:7 star-forming galaxies may be too optically faint to be reliably picked up and /or correctly classified by COMBO-17. Indeed, there are many MIPS sources without photometric redshifts (mRk24) or even detections (mRk25:5) from COMBO-17. Without a comprehensive multiwavelength photometric redshift analysis
we cannot definitively address this issue. Yet, we explore this issue briefly here to assess the potential scale of the biases, choosing to focus on two key issues: optical detectability and redshift accuracy.
One key point is that of optical brightness. In terms of affecting the total IR luminosity density or skewing the fractions of IR
luminosity from each morphological type, the most IR-luminous galaxies are the most relevant; i.e., luminous (1012 L
>
L>1011L; LIRGs) and ultraluminous (>1012L; ULIRGs) infrared galaxies. Thus, it is important to check whether local ULIRGs and LIRGs would be visible if placed atz0:7. We compare the optical properties of a sample of local universe ULIRGs and LIRGs from Surace et al. (2000) and Arribas et al. (2004) with the sample of Pec/ Int galaxies from thez0:7 slice ( Fig. 7). Photometry for these galaxies was presented inBandIbands; we corrected these for galactic foreground extinction, and transformed them toUandV
absolute magnitudes using the PEGASE stellar population model (if instead one assumed a very young underlying stellar
popula-tion and postulated that redder colors were due to dust alone, the transformapopula-tion fromBI toUV would remain unchanged at
P0.1 mag, owing to the strength of the age/metallicity/dust degeneracy in the optical wavelength region). In spite of their high
obscurations, local ULIRGs and LIRGs are reasonably bright in the optical and, in common withz0:7 Pec/ Int galaxies, show a
wide range in galaxy colors (primarily because of the dust obscuration). Highly obscured IR-luminous galaxies arenotfaint in the optical; they are rather fainter than they would be in the absence of dust, but they are still reasonably bright and are certainly bright enough to be easily picked up atz0:7 to anmR-band limit of 24.27
Yet, it is not clear that these dusty galaxies will be well classified by COMBO-17’s photometric redshift classifier. COMBO-17 adopts a two-dimensional stellar population and SMC extinction curve dust reddening grid for classification, allowing it in principle to classify galaxies with a wide diversity of stellar population properties and dust contents. In Figure 8 we test the performance of COMBO-17’s classifier directly using redshifts from the VIMOS VLT Deep Survey ( VVDS; Le Fe`vre et al. 2004) as a function of the
Fig.7.—Rest-frameUVcolors as a function of absolute magnitude inVband for a sample of ULIRGs and LIRGs in the local universe (open diamonds). Also plotted are visually classified peculiar and interacting galaxies from thez0:7 slice, reproduced from Fig. 2.
27
ULIRGs and LIRGs atzk1 will havemRk24; therefore, optically selected redshift surveys to this limit will be unable to construct unbiased samples of IR-luminous galaxies.