An Efficient Score Level Multimodal Biometric
System Using ECG and Fingerprint
Girish Rao Salanke N S
1, Maheswari N
2, Andrews Samraj
3, M V Vijayakumar
4 1Department of Computer Science & Engineering, RVCE, Bengaluru, India2Department of SCSE, VIT University, Chennai Campus, India
3Department of Information Technology, Mahendra College of Engineering, Salem India 4Department of Computer Science & Engineering, Dr AIT, Bengaluru, India
Abstract—Biometric system is a security system that uses
human’s unique traits to identify and authenticate the user. Biometrics refers to biological traits of a human that are often categorized as physiological traits like fingerprint, iris, face and behavioral characteristics like signature style, voice and typing rhythm. The Biological signals like Electrocardiography (ECG), Electromyography (EMG), and Electroencephalography (EEG) have not been explored to biometric applications as their scope was limited to medical applications only. Recent survey suggests that these biological signals can be explored as a part of the biometric application. The main objective of this paper is to explore the possibility of using the ECG as a part of multimodal biometric. ECG has lower accuracy but fusing it with a traditional biometric like fingerprint yields a higher accuracy rate and it is really difficult to spoof the system. The proposed multimodal biometrics system has an accuracy of 98% with the false acceptance rate of 2% and almost 0% of false rejection rate.
Index Terms—ECG; Equal Error Rate – ERR; False
Rejection Rate-FRR; False Acceptance Rate- FAR; Multimodal Biometrics; Score Level Fusion.
I. INTRODUCTION
The Biometric system is a security system that uses human’s unique traits to identify and authenticate the user. Biometrics refers to biological traits of a human that are often categorized as Physiological and Behavioral characteristics. Physiological characteristics describe the structure of body traits that include, but not limited to fingerprints, iris, voice, face, Electrocardiogram and DNA [1]. Biological characteristics also describe the pattern of behavior of a person that include, but not limited to typing rhythm, voice, signature style and gait.
The nature of Biometric system is to follow three modes of operations. First, in Enrollment mode, the biometric system collects the Physiological or Behavioral characteristics, quality checking, processes to extract fiducial features, and stores the result in a class set. Second, in Verification mode, biometric system validates a person’s identity by comparing the captured biometric characteristic with the person’s metric template stored in the system database. Lastly, in Identification mode, biometric system recognizes an individual by searching the entire template database for a match. The system conducts a one-to-many comparison to establish an individual’s identity. The concept of unimodality has numerous challenges like non-universality of samples, low secrecy rate, extent of user’s comfort and freedom while dealing with the system,
spoofing attacks on stored data, associated with enrolling large populations using just single (unimodal) biometrics. These challenges can be overcome by deploying multimodal biometrics systems. A multimodal biometrics system steadily increases the scope and quantity of input information that the system takes from the users for authentication by fusing two or more biometrics [2]. An Efficient Multimodal Biometrics system should have credentials that cannot be easily counterfeited and it should be used to overcome FRR due to bad data.
A biometric system based on Fingerprint and Electrocardiography is a novel approach for efficient multimodal biometrics system that uses the fusion of Fingerprint with ECG scores for effective spoof proof liveliness detection and addresses the Performance goals. The studies have shown the possibility of the ECG signal as a candidate of biometric for individual authentication. Signal filtering is important during working with signals like ECG and EEG. Filtering helps to reduce the number of samples per second making the classification and analysis an easy process. Each ECG signals has five important points: P, Q, R, S and T, which can be used to extract approximately 30 features. One of its most important features is the QRS onset and QRS Offset [3]. One of the techniques used to detect is by using adaptive threshold.
Electrocardiogram is one of the human features that cannot be forged easily. ECG is one of the unique features that vary with time, age and other conditions. It is possible to derive 19 stable features from QRS offset [4]. ECG signals classification is performed by the signal size, duration and type of feature that are extracted from that signal [5]. Signal with higher recognition rate is better in extracting more number of features from the signals. Some of the features are QRS Onset and offset. R-R peak, P-P peak, QR segment and RS segment etc.
False Rejection Rate (FRR), False Acceptance Rate (FAR) and Equal Error Rate (EER) define the performance of any multimodal biometrics system. False Rejection Rate is the rejection of access to a legitimate user, while False Acceptance Rate is the acceptance of access to an illegitimate user. Additionally, Equal Error Rate is defined when both FAR and FRR are equal. The lower the EER, the better the performance of the system [6]. FRR of Electrocardiogram (ECG) is 9.52(95%) and for Fingerprint it is 5.55(5 %). FAR of ECG is 2.38(2 %) and for fingerprint it is 7.77(8%). With the fusion of ECG and Fingerprint, FRR reduces to 0 and FAR to 2.5(2 %).
The fusion [7] in multimodal biometrics can be done at different levels, such as
1. Feature level 2. Decision level 3. Score level
In the Feature level, the fusion feature set extracted from multiple data sources is combined to create a new feature set. If the features from different biometrics traits are in the same type of measurement, it is recommendable to combine these features vectors into a single new vector. In Decision level fusion, the decision is independent of the other biometric trait and then these decisions are combined into a single decision. The AND and OR are the major rules used in the decision level fusion. In the Score level fusion, similarity match scores are generated for different biometric traits and then fused to make the authentication decision. The Fingerprint processing is done to find the minutiae points. The ECG signal processing is done using low-pass filtration, normalization, QRS detection, feature extraction and classification. The developed Multimodal Biometrics System uses one of the Physiological and biological features of the user to improve the false rejection and false acceptance rate. The Physiological feature has high accuracy rate but they are easily spoofed. To add another level of protection, ECG acts as a second level of authentication. The system gives 80% weightage to Fingerprint and 20% weightage to ECG because of their impact factor.
A number of objectives that need to be attained for the successful implementation of this work are listed below.
• To train the enrolled fingerprint and ECG data in order to categorize the classes of samples of each subject.
• To de-noise the trained data in order to filter it.
• To perform the fusion of both the biometrics and produce the match rate for a Subject, in order to test the subject’s score against the threshold set for authentication.
• To test the system against the performance metrics set like FRR and FAR by performing the authentication of all six subjects, each having five samples and the matched rates of all samples of the Subject are processed in order to optimize it.
• To reduce the Equal Error Rate (EER) of the system below the threshold value set.
.
II. METHODOLOGY
The Proposed multimodal biometric system followed defined approaches. It was operated according to stage wise, beginning from fingerprint, ECG, Fusion of Fingerprint with ECG, and finally measuring the performance metrics of the system. There were a total of 300 samples, consisting of 60 subjects each with 5 samples of both ECG and Fingerprint data. The Fingerprint data and ECG data were trained and stored in a Database.
The First stage was the image processing on Fingerprint data, which was in raw format. The raw data should be noise filtered. In order to do so, the pre-processing stage by hybrid shape and orientation descriptor consists of Image Enhancement, making Segmentation Mask, Binarization and Thinning. Image Binarization converted the pixel images to binary images. The fingerprint Binarization was done by transforming the gray scale image to 1-bit image, 1-bit value
for furrows and 0-bit value for the ridge. An adaptive binarization technique was done to binarize the fingerprint image. This technique transformed the pixel value to 1 when the value was larger than its mean intensity value. In Segmentation, the Region of Interest (ROI) was extracted. Then the Minutiae features were detected and extracted, wherein this stage consists of finding Minutiae and filtering false Minutiae, and storing them in the Database. After the feature extraction stage, false minutiae were removed. Then matching was processed, where the database was loaded and registration of each sample was done and similarity score was computed for every other compared sample. The Threshold score was set at 0.5 (>=0.48) for authentication.
The Second stage is Signal processing on ECG data, which is noisy and in digital .dat format. Firstly, the signal having >50Hz frequency noise that fluctuates its morphological appearances was removed to normalize the frequency. Secondly, the QRS fiducial points were detected in the signal using Pan Tompkins algorithm. Next, the features were extracted from QRS complex. Finally, template matching was processed, where the database was loaded and the registration of each sample was done and the similarity score was computed for every other compared sample. The Threshold score was set at 0.5 (>=0.48) for authentication.
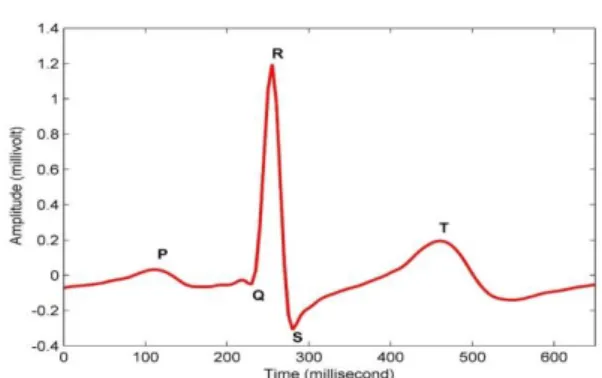
An electrical impulse was generated with each beat that travels through the heart. This caused the heart muscle to pump blood from/to heart. A normal beat on ECG showed the timing of the heart chambers (top and bottom). The atria (right and left) chambers made the first wave known as ‘P-wave’, that is the flat line. The chambers at the right and the left bottom ventricles made the next wave called the ‘QRS complex’ [8]. The last wave was the ‘T-wave’ represents the resting state that is the electrical recovery. These waves are shown in Figure 1. The next step was to represent the points in the ECG signal.
Figure 1: Waves Representation an ECG Graph
QRS wave came after the P-wave and was described as the potential point for detecting heart disease. The technique used here was to first detect the R-wave, which is the highest amplitude among other points. Then, taking 50-100 samples to the left of R-peak resulted in the lowest amplitude, which is the Q-point. Then, taking 150-200 samples to the right of R-peak resulted in the lowest amplitude, which is the S-point. To obtain consistent features, it is necessary to do Normalization because of the change in the heart rate. The heart rate changes in many cases, for example the pressure in heart changes when a person is sitting and running. So, this change consecutively changes the duration of P wave and T wave. The features of P and T waves were normalized by dividing them into
different beat length. The research suggested that peak fiducial of waveforms found that atrial deflection does not change with heart rate. Simulation forms the recovery of ventricles and activation of ventricles. These are fairly invariant with heart rate change. Hence, QRS complex was used in the experiment. Therefore, Pan-Tompkins algorithm was used since it is fast [9]. The min-max peak detection was used to extract the following features:
• The maximum amplitude in the ECG signal ‘R-peak’.
• Before R-peak in the region of 200-560ms, the P-peak was found.
• After R-peak in the region of 560-800ms, the T-peak was found.
• The interval features: peak to peak intervals, namely, Q-Q, R-R, S-S, QRS interval, QRS onset and QRS offset.
The Third stage is the Fusion of Fingerprint and ECG, where the similarity score was generated by statistical calculations from both results. The threshold score was set to 0.5 for authentication. A graph stating the Score performance versus the number of samples was generated. The graph was computed for Fingerprint, ECG and proposed the fused system. Lastly, the performance of the overall system was processed. The process involved the analysis of FRR, FAR and EER by processing each and every sample with the rest of 300 samples, which took time. After the analysis, a graph that describes the Performance metrics of the Fingerprint system versus the proposed system was generated. The graph shows the EER that is the merger of FRR and FAR point. The plotted EER describes the overall performance of the algorithm.
III. SYSTEM ARCHITECTURE
The Multimodal Biometric System is broken down into the following major modules:
A. Fingerprint Module:
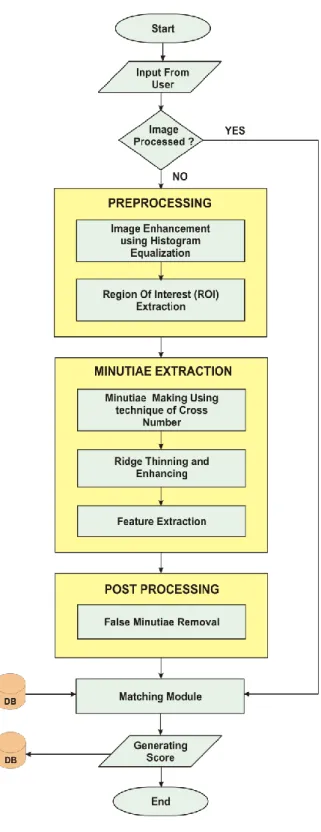
This module does the entire fingerprint image processing for the authentication of the user. There are series of stages like Area localization, preprocessing, minutiae extraction, post processing, matching and similarity score generation. The fingerprint image is enhanced, minutiae is detected and filtered, it is compared with template in database and similarity score is generated for each. The flowchart for the fingerprint module is given as follows in Figure 2. The flowchart indicates how the raw data is taken as input and how it is processed. The Raw data consists of image file in tif format, internally processed by the application, generating score and identifying minutiae.
B. Electrocardiogram Module:
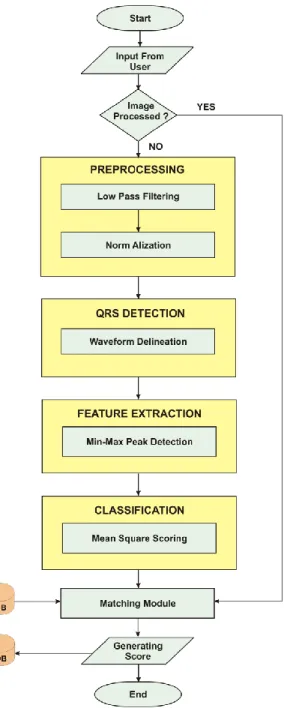
This module does the ECG signal processing for the authentication of the user. There are series of stages like preprocessing, QRS detection, feature extraction, classification, matching and similarity score generation. The ECG signal is filtered by removing the noise and normalizing it. This results in the detection of QRS complex. Features extracted from QRS complex is compared with the template in database and similarity score is generated for each. Figure 3 shows flow chart of Electrocardiogram Module. The module takes the matlab data input and performs the operations like noise removal, feature extraction and score generation.
Figure 3. Flowchart of ECG module
C. Fusion and Decision Module:
This module first trains the datasets of both Fingerprint and ECG. It performs the matching between user input data file and fused database, and then generates fused score after the computation, if this score meets the threshold set by the application, then the user is authenticated. Finally performance metrics for the overall system are calculated by operating on 300*300 datasets, which defines the FRR, FAR and EER of the system. These modules interact with each other efficiently in order to give overall functioning of Multimodal Biometrics System. Figure 4 gives the pictorial representation of the system architecture of Multimodal Biometrics System.
It consists of four stages (Image acquisition, Fingerprint recognition, ECG recognition and Fusion) each having their own set of sub-modules [10]. First, the Fingerprint data, in raw format is collected. It goes through Localization in order to detect the operating area of the image. Then preprocessing is performed to enhance the image. Next Minutiae are detected, extracted and stored to a database. Comparison between templates in database is performed and similarity score is generated. The scores are stored in a database and line graph is plotted to show performance of the authentication. Second, the ECG data is collected in raw format. The filtration stage removes noise and Normalized to reduce Frequency from samples. Then QRS complex is detected from the ECG. Then, Features are extracted from QRS complex, then it is compared with template in database and finally similarity score is generated for each. Lastly, under fusion module, Training of datasets is performed by fusing the datasets into their respective classes. Matching of selected fingerprint data and ECG data with fused database is done and Scores are generated and stored to a database. Performance metrics for the overall system are calculated.
IV. EXPERIMENTAL RESULTS AND PERFORMANCE
ANALYSIS
In this work, the different combinations of inputs were given to the system and outputs were compared with the ground-truths to check whether the metrics are satisfied. The required metrics of evaluation as per the good technique evaluated against are [10]:
•
False Acceptance Rate (FAR): It refers to the situation where an illegitimate user is accepted by the software of the system. The values of FAR should always be less, indicating that the system does not allow illegitimate access.•
False Rejection Rate (FRR): It refers to the situation where a legitimate user is not accepted by the software of the system. The values of FRR should always be less, indicating that the system does not deny legitimate user access.•
Equal Error Rate (EER): This performance metrics is used to evaluate the overall performance of the system. When both FAR and FRR are equal, it is possible to say that the system is accurate and efficient.The experimental dataset used for fingerprint was the FVC2002 (Fingerprint Verification Competition 2002) and the dataset used for ECG were PhysioBank ATM, Challenge 2009 Test Set A. Because of the low availability of digital ECG data from MIH DB, the datasets used for overall project were reduced. The project has taken 60 subjects with 5 samples of each subject. In total, there were 300 samples from ECG and fingerprint. Figure 5 shows the sample of Fingerprint dataset used. Figure 6 shows the ECG PhysioBank ATM, Challenge 2009 Test dataset used.
Figure 5. Fingerprint Datasets
Figure 6. ECG Datasets
The performance of biometric system was based on the ERR analysis. It determines the equal ratio of FRR and FAR. The lesser the EER value, the greater the accuracy of
the biometric system. The following figures explain the performance under each case.
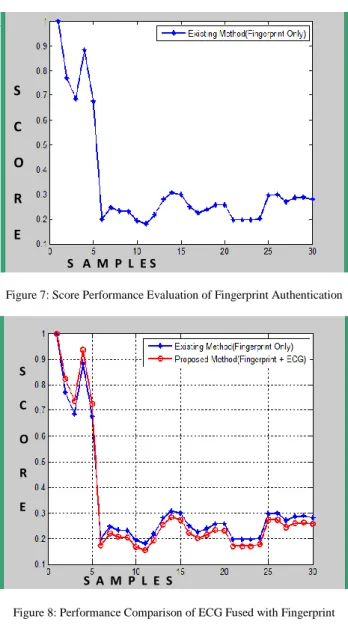
Figure 7 describes the conduct of Fingerprint authentication by taking a user sample and comparing it with the rest of template samples. The matching rate was between the score of 0.6-1 and non-matching rate reached below the score of 0.3.
Figure 8 describes the fusion of ECG with Fingerprint authentication, which was conducted by taking a user sample and comparing it with the rest of template samples. The matching rate was between the score of 0.6-1 and non-matching rate was below the score of 0.2. As shown in the graph, there is a significant improvement in the scores of matched samples and reduction in the scores of unmatched samples. The results indicate an improved of the FRR and FAR metrics.
Figure 7: Score Performance Evaluation of Fingerprint Authentication
Figure 8: Performance Comparison of ECG Fused with Fingerprint
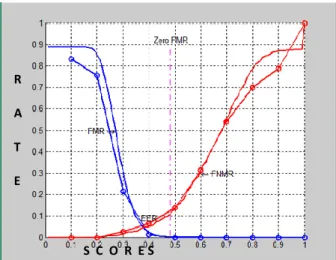
Figure 9 describes the performance of the system. The metrics described before, which are the FAR/FNR, FRR/FNMR and EER, were taken for the system. As shown in the graph, there is a significant improvement in the ratio of FARR and FRR of the system. The threshold was set to 0.5. The EER reached to 0.38 that is less than 0.5, which is a 2% higher accuracy than the unimodal fingerprint biometrics. S A M P L E S S C O R E S S C O R E S S A M P L E S
Figure 9: Performance Metrics of the System
V. INFERENCE AND CONCLUSION
The fingerprint authentication has bad false acceptance rate and average false rejection rate. The fusion with ECG has drastically changed this course. It has improved the ratio between them to over 70%. The description of the results are shown in Table 1. Table 1 shows the complete similarity of the scores of matched subjects.
Table 1
Similarity Score Performance of a Matched Subject’s Samples Sample1 Sample2 Sample3 Sample4 Sample5 Fingerprint 1 0.7706 0.6847 0.8839 0.6742
ECG +
Fingerprint 1 0.8219 0.7359 0.9352 0.7254
The first five matched samples of a subject were considered and we performed fingerprint authentication in the first phase, and then fusion it with ECG in the second phase. Based on the comparison between the Fingerprint and fusion, there is a significant improvement in the scores. This signifies that the fusion greatly increases the genuine acceptance rate, which in turn reduces the FRR. Table 2 shows the similarity scores of the non-matched subjects.
Table 2
Similarity Score Performance of a Non-Matched Subject’s Samples
Sample1 Sample2 Sample3 Sample4 Sample5 Fingerprint 0.1974 0.2453 0.2326 0.2297 0.1928
ECG +
Fingerprint 0.1723 0.2202 0.2075 0.2046 0.1677
Here, the first five matched samples of a subject were considered and we performed fingerprint authentication in the first phase, and then fusion it with ECG in the second phase. Based on the comparison between the Fingerprint and the fusion, there is a significant improvement in the scores. This signifies that fusion greatly decreases the imposter acceptance rate, which in turn reduces the FAR. The experimental results obtained by executing the fusion of fingerprint and ECG show that there is a much greater improvement in the ratio of FRR and FAR. The accuracy of the system is improved by 2% compared to unimodal fingerprint biometrics. Thus, it proves that the Fusion between Fingerprint and ECG has reduced the FRR, which is the main metric of concentration of this work.
REFERENCES
[1] Arun Ross and Anil K. Jain, “Multimodal Biometrics: An Overview”, Appeared in Proc. of 12th European Signal Processing
Conference (EUSIPCO), Vienna, Austria, pp. 1221-1224, September
2004.
[2] Hiren D. Joshi, “BIOMET: A Multimodal Biometric Authentication System for Person Identification and Verification using Fingerprint and Face Recognition”, International Journal of Computer
Applications, Vol. 51– No.17, pp. 0975 – 8887, Aug 2012.
[3] Yogendra Narain Singh and Phalguni Gupta, “ECG to Individual Identification”, Proceedings of the 17th Iranian Conference of
Biomedical Engineering (ICBME2010), Isfahan, Iran , Vol 21 Issue
6, pp.1244-1484, Nov 2010.
[4] Gaganpreet Kaur, Dr. Dheerendra Singh, Simranjeet Kaur, “Electrocardiogram as a Biometrics Characteristics: A review”,
International Journal Of Emerging Research in Management &
Technology, Vol 4, Issue 5, pp. 202-206, May 2015
[5] Branislav Vuksanovic & Mustafa Alhamdi, “Analysis of Human Electrocardiogram for Biometric Recognition Using Analytic and AR Modeling Extracted Parameters”, International Journal of
Information and Electronics Engineering, Vol. 4 No. 6, pp. 428-433
,Nov 2014.
[6] Manjunathswamy B E, Appaji M Abhishek, Dr Thriveni J,, Dr Venugopal K R and Dr L M Patnaik, “Multimodal Biometrics using ECG and Fingerprint”, Proc. of Int. Conf. on Advances in
Communication, Network, and Computing, CNC, pp.777-784.
[7] Girish Rao Salanke N S, M V Vijayakumar, Andrews Samraj,”Performance Evaluation of PPG based multimodal biometrics system using modified min-max normalization”,
International Journal of Applied Engineering Research, Volume 13,
Number 13,pp 11279-11284,July 2018.
[8] S.C Fang and H.L Chan; "Human identification by quantifying similarity and dissimilarity in electrocardiogram phase space",
Pattern Recognition, vol.42, Issue 9, pp. 1824-1831, Sept. 2015.
[9] Andre Cigarro Matos, Andre Lourenco, Jose Nascimento,”Biometric Recognition System Using Low Bandwidth ECG Signals”, IEEE 15th International Conference on e-Health Networking, Applications
and Services, Lisbon, Portugal , Vol. 31, Issue 5, pp. 524-631, 2015.
[10] B. Shanthini and S. Swamynathan, “A Secure Authentication System using Multimodal Biometrics for High Security MANETs”, The 1st
Int. Conf. on Advances in Computing and Information Technology,
Sydney, Australia, CCIS 198, pp. 290-307, 2014.
R A T E