ContentslistsavailableatScienceDirect
Energy
and
Buildings
jo u r n al h om ep a g e :w w w . e l s e v i e r . c o m / l o c a t e / e n b u i l d
Building
model
calibration
using
energy
and
environmental
data
Mohammad
Royapoor
∗,
Tony
Roskilly
SirJosephSwanCentreforEnergyResearch,StephensonBuilding,NewcastleUniversity,NewcastleuponTyneNE17RU,UnitedKingdom
a
r
t
i
c
l
e
i
n
f
o
Articlehistory:
Received1December2014
Receivedinrevisedform18February2015 Accepted21February2015
Availableonline28February2015
Keywords:
Modelcalibration Measuredenergydata Localweatherdata
Buildingperformancesimulation EnergyPlus
Hourlydata Sensordeployment Casestudybuilding
a
b
s
t
r
a
c
t
Alargenumberofrandomlyinteractingvariablescombinetodictatetheenergyperformanceofabuilding.
Buildingenergysimulationmodelsattempttocapturetheseperturbationsasaccuratelyaspossible.
Thepredictionaccuracyofbuildingenergymodelscannowbebetterexaminedgiventhewidespread
availabilityofenvironmentalandenergymonitoringequipmentandreduceddatastoragecosts.Inthis
paperasetoftwocalibratedenvironmentalsensorstogetherwithaweatherstationaredeployedina
5-storeyofficebuildingtoexaminetheaccuracyofanEnergyPlusvirtualbuildingmodel.UsingAmerican
SocietyofHeating,RefrigeratingandAir-ConditioningEngineers(ASHRAE)Guide14indicesthemodel
wascalibratedtoachieveMeanBiasError(MBE)valueswithin±5%andCumulativeVariationofRoot
MeanSquareError(CV(RMSE))valuesbelow10%.ThecalibratedEnergyPlusmodelwasabletopredict
annualhourlyspaceairtemperatureswithanaccuracyof±1.5◦Cfor99.5%andanaccuracyof±1◦Cfor
93.2%ofthetime.
©2015TheAuthors.PublishedbyElsevierB.V.ThisisanopenaccessarticleundertheCCBYlicense
(http://creativecommons.org/licenses/by/4.0/).
1. Introduction
Theoriginsofbuildingenergymodellingcanbetracedbackas earlyas1920swiththedevelopmentofresponsefactormethod fortransientheatflowcalculations[1].Theavailabilityof comput-ersinthe60sheraldedanewdawnwhen,especiallyfromearly 80stheHVAC companiesdeveloped energy modelsfor heating andcoolingloadcalculations[2,3].Thistrendacceleratedasthe 70soilcrisesraisedbuildingenergystandards,leadingtogreater energy efficiency and modelling methods that continue to this day[4].Whilstinitiallyadesignphasetool,increasinglybuilding energysimulation(BES)modelsofexistingbuildingsaredeveloped toaidresearchintomodel-based controls, optimisation,energy conservationmeasures(ECM)andfinancialappraisals[5–7].The creation, maintenance and updating of virtual buildingmodels thereforeincreasinglyrequiregreaterlevelsofaccuracytoenable moremeaningfulstudies.
Abbreviations: AHU,airhandlingunits;BES,buildingenergysimulation;BIM,
buildinginformationmodelling;BWM,Boxwhiskermean;CV(RMSE),cumulative variationofrootmeansquareerror;ECM,energyconservationmeasures;EPW, EnergyPlusweather(file);HAM,heat,airandmoisture(Modelling);HVAC, heat-ing,ventilation,air-conditioningandcooling;MBE,meanbiaserror;PIR,passive infra-red.
∗Correspondingauthor.Tel.:+4401912085869.
E-mailaddresses:[email protected],[email protected]
(M.Royapoor).
Inthelastfewyearsthewidespreaddeploymentof multifunc-tionalenvironmentalsensors,mandatorysub-meteringofbuilding energyconsumptions,longitudinaldatacollectionandthe inter-netofthingshaveallledtosubstantialamountsofbuildingand energy related databeingmadeavailable. Therichness of digi-talinfrastructure outputhasgrowntoanextentcomparable to biologicalecosystemsinalltheircomplexity[8].Withinbuilding relatedapplications,theavailabilityofbothsimulatedand mea-suredenergyandcomfortdatagivestheissueofmodelcalibration greaterpotency.Buildingmodelcalibrationisameasureofmodel accuracy,whichdespiteincreasingsophisticationstillsuffersvast under-determinedparameterspace[9].
Theaimofthispaperistoconductanenergycalibrationusing anEnergyPlusmodelbeforeexaminingthematchbetween simu-latedandactualspaceairtemperatures.Thistwo-tieredobjective isperusedthroughthefollowingsteps:
1Usinganofficebuildingasaplatform,afirststageenergy cal-ibrationofthemodelisperformedusing2012hourly-metered values.
2Spaceairtemperatureiscollectedforthesameperiodusing envi-ronmentalsensorstoenableanassessmentofzonetemperature predictionaccuracyofthecalibratedEnergyPlusmodel.
ThecalibrationprocessfollowsASHRAEguideline 14 recom-mendations.Thisguidelinewasoriginallydevelopedtoquantify energysavingpotentialsofproposedretrofitschemes,andisamong
http://dx.doi.org/10.1016/j.enbuild.2015.02.050
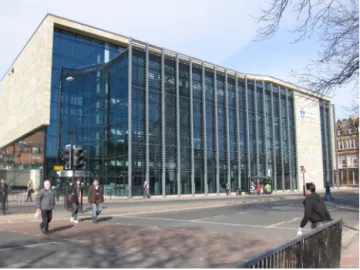
Fig.1.Thebuilding’sheavilyglazedfrontaspectfaces+34◦fromduesouth.
threecurrentguidesthatdefinevirtualmodelacceptancecriteria
[10–12].
1.1. Case-studybuilding
Amodern5-storeysandstoneofficeinauguratedin2010isthe platformfortheworkundertakenhere(located54◦58N,1◦36W). Atnorth,east,southandwestorientationssolarcontrolglazing cover54%,29%,87%and 42%ofthefacadesrespectively(hence overallthe building’sexternal facade is53% glazed).The south aspect is partially shaded by extruded aluminium brise soleil (Fig.1).
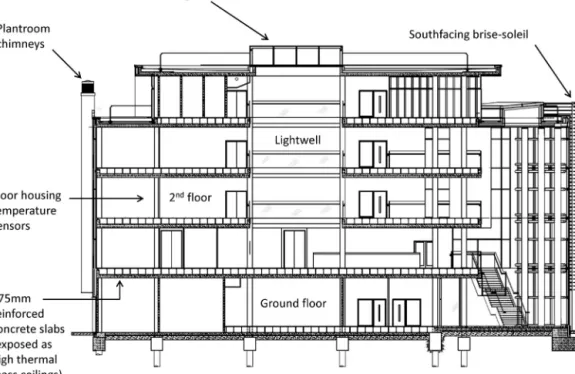
ThebuildingfabricU-valueexceededthestatutoryUKbuilding requirementsofthetimebyanaverageof29%.Internallythe com-plexarchitectureincludestwolargesoutherlyandwesterlyvoids, twointernalatriafacilitatingdisplacementventilationandablend ofcellularandopenplanofficesover8365m2ofgrossarea
(hous-ingaround500staff).Thermallyinduceddisplacementventilation andexposedconcretesurfacesareamongtwo carbonreduction philosophiesthatguidedtheoriginaldesign(Fig.2).
AGill’sMetPakProweatherstationcombinedwithaSPN1 pyra-nometerweremountedontherooftopofthisbuilding(Appendix A)toprovidethefollowingoutputs(accuracynotedinbrackets): 1Globalsolarradiation(±5%).
2Diffusedradiation(±5%). 3Windspeed(±2%at12m/s). 4Winddirection(±3◦). 5Airtemperature(±0.1◦C).
6Relativehumidity(±0.8%at23◦C).
7Dewpoint(±0.15◦Cat23◦Cwithadewpointof20◦C). 8Barometricpressure(±0.5hpa).
Except for solar radiation, all measurements are instanta-neousvaluessampledat10-minuteintervals.Globalanddiffused solarcomponents are however10minaverages which are fur-therroundedtoformhourlyfigurestoconstructEPW(EnergyPlus weather)files.
1.2. HVACservices
Threeequallysizedcondensingboilersprovideatotalheating outputof 744kWwhich are deliveredtothe zonesviaa com-binationofradiators, trenchand perimeterheaters, underfloor heatingandtemperedair.Twocentralairhandlingunits(AHUs)
of0.96atalltimes.Lightingisoperatedbypresencedetectionand isequippedwithdaylightcompensationsensors.
1.3. Energydata
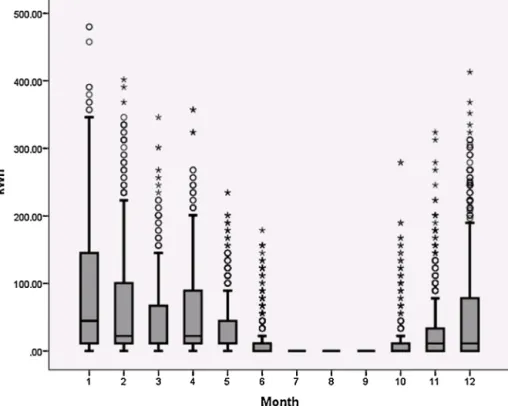
Box whisker mean (BWM) plots are used to present 2012 meteredenergyuseofthebuilding(Figs.3and4).Thisallowsquick andefficientcommunicationofmanyaspectsofbuildingenergy demand,namelypeaks,medians,extremevalues(outliers)and sea-sonalvariations[13].Thebuildinghasaratherconsistentelectricity demandthroughouttheyear(Fig.3)whereonaverage, working-hourelectricalloadsfloatataround180kWh(withpeaksofaround 200kWh)beforefallingtoabase-loadofabout50kWhatnight.
Nightpurgeventilationstrategyraisesthenighttimebase-load to around 60kWh in midand late summer months. Daylight-linkedlightingconverselyreducesthesummermonths’electricity demandduringofficehours.
Thebuildingannualheatingdemandismorevariablegiventhat itisafunctionofclimaticconditions.ExceptinJanuary,loadsabove 100kWhfallabovetheupperquartilerangeindicatingthe build-ing’swell-insulatedfabric(Fig.4).Buildingheatingrequirements arewellbelowCIBSEbestpracticerecommendations(Table1)[14]. 1.4. Softwaredescription
EnergyPlusisafirstprinciplebasedtoolandtheofficialbuilding simulationprogrammeoftheUnitedStatesDepartmentofEnergy. Itisextensivelyusedandexaminedbytheinternationalresearch communitytomodelheating,cooling,ventilation,lightingandalso waterconsumptionusingastate-spacemethod(thethermalload ofthebuildingissimulatedusingaheatbalancemethod)[15,16]. Energyplusisprimarilyasimulationengine(withnointerface)and assuchDesignBuilderversion3.2.0.067wasusedasthegraphical interface(front-endingEnergyPlusVersion7.2.0)[17].Several for-mattingstepswererequiredtoallowweatherfilestobeusedin EnergyPlusmodels,includinggenerating‘.stat’filesusing Energy-Plusweatherstatisticsandconversionsprogram.
2. Literaturereview
2.1. Modellinglimitations
Buildingmodelscaptureanarbitraryandlimitedpartofwhat essentially is a multiplicity of dynamic (fabric properties and HVAC),stochastic(occupant)andprobabilistic(weather)elements, resultinginbothinaccuracy[18,19]anduncertainty[9,20]. Soft-warelimitations, inputparameterand weatherdata inaccuracy compoundedbydifficultiesin capturinghowexactlya building
Fig.2.Sectiondrawingofthecasestudybuilding.
isoperatedarethemajorcausesofvirtualmodelerrors[21].The behaviourofheatinaspace,andthe‘coupled’sorptionand desorp-tionofmoistureintoandoutofbuildingfabric(andfurniture)are phenomenaofgreatdynamiccomplexityandquiteunderstandably onlypartiallydescribed bybuildingmodels[22]despitehaving significant buildingenergy implications [23]. Several computa-tionalmethodsexistthatquantitativelyevaluateheatandmoisture transfer by solving the governing differential equations. These areconciselycapturedintheintroductorynotesofChen,Y.and
S.Wang[24].Limitationsofhygrothermalmodellingaredue(but notlimited)to:
1Thepropertiesofbuildingmaterialareassumedconstantinmost analytical and numerical modelsproposed tosolve heat and moisturebalanceproblems [25].In realitythepredominantly porousandhygroscopicbuildingfabricpropertieschangewith changingtemperatureandmoisturecontent,impactingheavily onHVACloadsparticularlyinhumidclimates[22].
Fig.4.BWMplotofmeteredhourlygasconsumption(2012).
2The boundary conditions are difficult to define, and current knowledge of climatic excitation of building hygrothermal behaviourrequiresfurtherrefinement[26].
3Thehighlynonlineargoverningequationsarecomputationally difficult,time-consuming[27]andpronetoerrors.
Natural ventilation and infiltration also heavily impact on hygrothermalbuildingproperties[28].Airflowrelatedelements arealsoamongthemostnotablesourcesofuncertaintyinbuilding simulation[29].Overalltheseshortcomingsinsimultaneous mod-ellingofheat,airandmoisture(HAM)formacatalogueofinquiries thatarethesubjectofongoingscientificwork[30].
2.2. Workoncalibration
Until recently calibration efforts primarily focused on how closely simulated results match the metered energy data
[10,31,32],andalsoallowedforthepersonaljudgementofthe ana-lyst[33],althougha patternofcommonconsensusis emerging towardstheapplication(andfurtherrefinement)ofASHRAEguide 14method[9,34–37].Acomprehensivecoverageofhistoricaland currentcalibrationtechniquesandtheirmeritsisavailablefrom Coakley,D.etal.[34].Inmostinstancescurrentguidelinesthatset outcriteriaonbuildingcalibrationmakeallowancesforcalibrating againstactualdataateithermonthlyorhourlyintervals[10–12]. However,callshavenowbeenmadetousehourlyvaluesof sub-meteredservicesoverannualcyclestocalibrateamodel[9,38]. Cal-ibrationworkhasmostlybeenperformedmanually[39]althougha fewmethodshavebeenproposedfortheautomationoftheprocess usinginputparameteroptimisationaswellasuncertaintyand sen-sitivityanalysis[40].Reddyidentifiesthreecalibrationmethods: firstmanualiterative,secondautomatedandfinallygraphicaland statisticalmethods[38].Mosteffortsexaminedduringthiswork centredaroundthemanualiterative methodwhich alsoallows trendingtheimprovementsmadeasaresultofinputadjustments. Mustafaraj,G.,D.Marini, etal.[41] offeroneof themostlucid effortsthat is anextension of previousworks [35,38,42].In its
comprehensiveformthisentailsatwostageversioncontrol param-eterinput(andscreening)approachthatbeginsbypopulatingthe modelwithas-builtfabric,HVACandoccupancyvalues.Inthe sec-ondstage themodel is furtherrefinedby identifyingthemost influentialinputparametersandusingfieldmeasurementdatain areiterativeprocessofadjustmenttoeventuallyestablishthefinal calibratedversion.Thismethodinformstheworkconductedhere. 2.3. Accountingforuncertainty
Whenreconcilingmeasuredandsimulatedvalues,twooverall sourcesoferrorexist.Measurementerrorcontainedintheactual dataandmodelerroremanatingfromthesimulationprocess. Mea-surementerrors can beidentified withreferencetoequipment manufacturerliteratureorbyconductingequipmentcalibration. Underpinningmodelerrorsarehowevermoreconvoluteddueto theintrinsicuncertaintiesinvolved.Severalexamplesexiststhat attempttocapturesourceandmagnitudesofuncertaintyin build-ingsimulationmodelling[43–46].Theessenceofmostofthese effortsarecapturedbyDeWit[47]whoclassifiesthesourcesof uncertaintyintothefollowing:
•Specificationrelated:arisingwhenthebuildingfabricand sys-temsaredescribedpartiallyorinaccurately.
•Modellingrelated: thevirtualmodel governingprinciplesare fundamentallyasimplifieddescriptionofreality.
•Scenariorelated:external(e.g.climate)andinternal(e.g. occu-pant) parameters within the model are often different from reality.
Inevitablythevast volumeofinformationthatisrequiredto describea building modelgenerally leadstosimplification and parameter reduction [48–51]. Despite this inevitability, recom-mendations are made toattempt to identifythe magnitude of modeluncertaintiessothatpredictionsofECMstudiescouldbe presentedwithgreaterlevelsofconfidence[52–54].Several meth-odshadbeenprovidedtoautomaticallycalibrateabuildingmodel
while imposing certain constraints on relevant input parame-ters;including(butnotlimitedto)objectiveandpenaltyfunction techniques[55,56], which canestimate critical parameters and thenquantifythemagnitudeofuncertainty[52,54].Morerecently Bayesiantechniqueswerealsoproposedbutthesetendtobemore application-specific[57–59].Anincreasingbody ofresearchhas cometo recognisethat occupancyrelated issues actas a more prominentsourceofuncertaintyin modelpredictionsthan pre-viouslyassumed,leadingtoeffortstodevelopmostlycase-specific stochasticmodelsofoccupancy[60–67].
3. Method
The two-stage method [35,41] referred to in Section 1.2 informedthecalibrationprocessundertakenforthisstudy.A suc-cessionof19modelseach withincremental adjustmentspaved thewaytoarriveatthefinalversioncontaininglocal2012weather files.Againstactualhourlydata,ASHRAEGuideline14-2002was followedtocalibratethebuildingmodel[10].Thisentails deter-miningtwodimensionlessindicatorsoferrors,MBEandCV(RMSE) valuesusingformulae(1)and(2):
MBE=
Ni i=1(Mi−Si) Ni i=1Mi (1) CV(RMSE)= Ni i=1 [(Mi−Si)]2 Ni 1 Ni Ni i=1Mi (2)WhereMiandSiarerespectivemeasuredandsimulateddata
atinstancei,andNiisthecountofthenumberofvaluesusedin
thecalculation.ASHRAEGuide14considersabuildingmodel cali-bratedifhourlyMBEvaluesfallwithin±10%andhourlyCV(RMSE) valuesfallbelow30%.MBEandCV(RMSE)indiceswereconstructed overmonthlyintervalsinordertostudymonthlyvariationstoo. MBEfiguresprovideanindicationoferrorsaveragedtothemeanof measuredvaluesbutsufferfromthecancellationeffect.CV(RMSE) indexhoweverisameasureofaccumulatederrornormalisedto themeanofthemeasuredvalues.AssuchCV(RMSE)moreclosely reflectstheaccumulatedmagnitudeoferrorandthereforeisa bet-termeasureoftheoverallpredictionaccuracyofthemodel.
Conventionallywhensimulatingcomplexphenomena,erroris definedasreferencevalue(observed)subtractedfromthemodel forecast(simulated) [68].Error values wereconstructedforthe threestreamsofdataunderanalysisusingequation(3):
εi=Mi−Si (3)
3.1. Parameterinputandcalibration
Prior to the handover of the building, a complete building log-bookwascompiledbythearchitectural firmwhichoutlines detailed descriptionsof as-builtfabricproperties,electrical and HVACservicedistributionandcontrolstrategies. Thisenabled a completedescriptionofthebuilding(summarisedinTable2).The estatefacilitiesmanagementsandbuildinguserswerealso con-sultedforoperationaldetails.
Theresultsofaninfiltrationsmoketest(carriedoutat50Pa) providedtheinfiltrationinput.Apointparticularlynoteworthyis theconversionofmeasuredbuilding’sairchangerates(expressed at50Pa)tonormalisedairleakageatatmosphericpressure.This wasachievedusingformula(4):
ACHAtmospheric≈
ACH50
F (4)
Table2
Summaryofparameterinput.
Inputparameters Value
Heating LTHWradiators+underfloor
heating Heatingsetpoint/setbacktemperatures 22◦C(12◦C)
Ventilation Displacementwithheat
recovery
HeatingsystemseasonalCoP 0.8
Naturalventilationrate(perperson) 8l/s Coolingsetpoint/setbacktemperatures 24◦C(28◦C)
Lighting(daylightlinkedwithlinear control)
9W/m2(toachieve300Lux)
Occupants(fromheadcount) 490(peaktime) Totalofficeequipmentgainsa,b 10W/m2
Occupiedhours 8am–5pm
FabricU-values
Glazing(withlowemissivitycoating) 6mmdoublepanesolarcontrol glazingwith20mmairgap (U-value1.772W/m2K) GlazingGvalue(solartransmittance) 0.38
Externalwalls(W/m2K) 0.292
Roof(W/m2K) 0.25
Floor(W/m2K) 0.13
Infiltration(ac/h)c 0.33
aComputers:6W/m2 (derived from agent-basedpower monitoring system deployedbytheuniversityITdepartment).
bOfficeequipment:4W/m2(derivedfrom12electricitysub-metersatthe build-ing).
c Constantrateofinfiltrationexpressedatatmosphericpressure.
WhereFisafactorusedtorelatetheairexchangeratesunder typicalconditions(ACHatmospheric)totheairexchangerateat50
Pascal(ACH50)[69].AnaverageF-valueof20wasusedasgivenby
Sherman,M.[70]. 3.2. Roomsensors
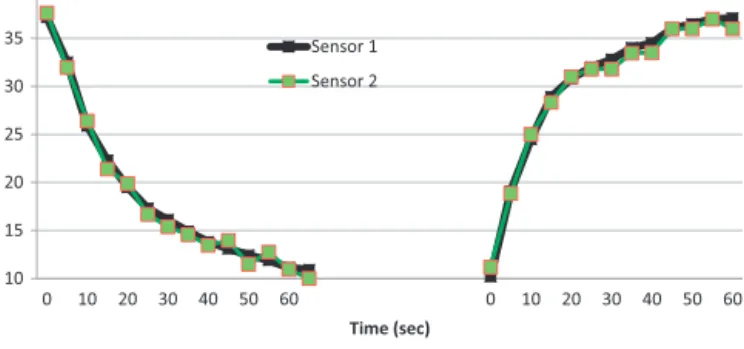
Aspartofthisprojectafirstgenerationprototypewireless sen-sorunitsweredevelopedandasetoftwoofthesesensorswere positioned1.5mabovefloorlevelandawayfromdirectsunlight rays within the 2nd floor openplan office (AppendixB). Prior to deployment thesensors were calibrated within a variety of locationswithbothstableandchangingthermalconditions. Mea-surementresultsofthetwounitswerewithin±0.3◦Cofeachother andwithin±0.5◦CofaTESTO435auditdevice.Theresponsetime ofthetwo individualsensorswerealsobelow 1min(Appendix C)whichisadequateformeasuringhighlydampedbuildingzone temperatures.Thereadingsfromthetwosensorswereaveraged toconstructtheactualzoneairtemperatureofthetargetspace (Fig.11).
4. Results
4.1. Electricity
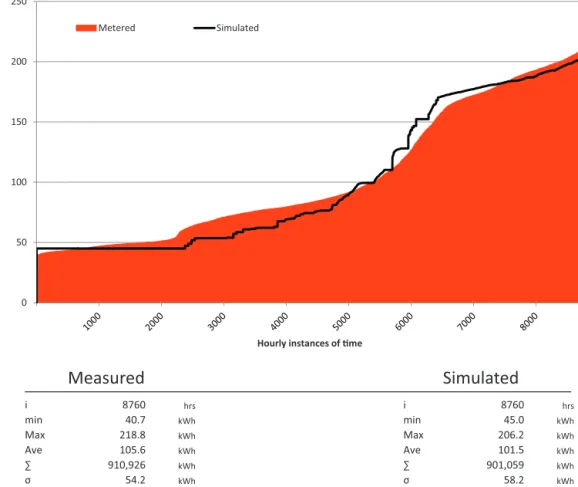
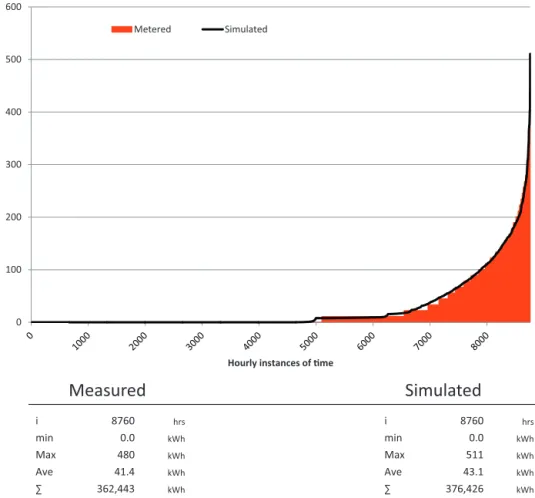
Statistically, electrical power measurement is a continuous quantitativedatatype.Fig.5enablesaquickvisualinspectionof measuredandsimulatedvaluesandtheirstatisticalvariationsby arrangingpaireddatapointsinascendingorder.
The building’s 2012 annual electricity consumption is 910,926kWh. The final calibrated model produced a sum of 901,059kWh (i.e. a deviation of 1.08%). Electricity carries the biggest CV(RMSE) in among the other two calibrated streams of data since electrical consumption is more closely related to occupant activitythat deviates(ina randommanner) fromthe deterministic occupancy templates used in Energyplus model. Hourly MRE andCV(RMSE) indicesfor individualmonths show thatDecembercarriesthebiggestmonthlyaccumulationoferrors
Fig.5.Hourly-basedmeasuredandsimulatedbuildingelectricityconsumptioninascendingorder(kWh). (Fig.6).Thefacilitiesmanagerinthetargetbuildingalsotakesa
veryproactiveroleandthesetpointswithinthespaceareregularly updatedinresponsetooccupant’scomments.Thisaddsagreater probabilisticpattern toactualbuildingperformanceasopposed tothe static and template-driven nature of simulation results. Lighting,smallpowerandHVACplantelectricalconsumptionare sub-meteredbutavailableonmonthlyintervalsonlyandthefinal modelMBEand CV(RMSE)valuesformonthlydatawerewithin ASHRAErecommendedmonthlyvalues(Table3).
HVACenergyconsumptioncarriesthebiggesterrorinthethree categoriesforwhichmonthlysub-meteredvalueswereavailable.
Table3
Sub-categorisedCV(RMSE)andMBEvalues(monthlydata).
Category BE* (monthly) V(RMSE)** (monthly) V(RMSE)*** (hourly) HVAC 4.69 13.1 – Lighting −2.62 9.1 – Smallpower −1.6 6.3
Overallelectricityconsumption 0.50 9.7 9.9
*Acceptancelimit:−5%≤MBE(monthly)≤+5%. **Acceptancelimit:CV(RMSE)(monthly)≤+15%. ***Acceptancelimit:CV(RMSE)(hourly)≤+30%.
0.9% 9.9% -10% -5% 0% 5% 10% 15% 20% 25% MBE CV(RMSE)
40 30 20 10 0 -10 -20 -30 -40 900 800 700 600 500 400 300 200 100 0 Residual value (kWh) Fr e q u e n cy
Fig.7. Histogramofhourlyelectricityresiduals(kWh).
Lightingandsmallpowerwerebothslightlyover-predictedbythe modelwhereasHVACwasunder-predicted.Notethatconsistent manufacturerseasonalefficienciesforHVACplantswereusedand noadjustmentsweremadetoachievecloserresults.
Quite clearly EnergyPlus electricity prediction surpasses the calibration criteria set by the ASHREA guide 14. However the cancelling effect of MBE values are evident given that for instancetheoverallMBEhourlyfigureof0.9%ismuchsmallerthan
CV(RMSE)houlryvalueof9.9(Fig.6).
Thehistogramofhourlyresidualsprovidesaquantified illus-tration of themagnitude and spread of model electrical errors (Fig. 7). Hourly electrical errors (or residuals) form a bi-modal
chartwithoverallcharacteristic ofnormal distributioncentring onzero.Expressedin relativeterms,94%of errorshavea mag-nitudefallingwithin±10%ofdailypeakelectricityconsumption (i.e.±20kW).Theextremeincidentsofnegativeerrors(i.e.model over-predicting)haveasimilarmagnitudetopositiveerrorsand thefrequencyofbothinstancesarelow(only1.1%oferrorsare largerthan±30kWh).
4.2. Gas
Spaceheatinginthecasestudybuildingonlyoccurswhenthe averagedailyoutdoortemperatureisbelow11.5◦C,confirmingthe well-insulatednatureofthebuildingfabric. Theheatingsystem (fortheyearunderexamination)wasalsoentirelyshutdownfrom mid-JunetoearlyOctober.Thepairedinstancesofmeasuredand simulatedgasconsumption,againanothercontinuousquantitative datatype,arearrangedinascendingorderinFig.8.
Abuilding’sheating-relatedgasconsumptionisadirectfunction ofoutdoortemperatures.Astheweatherdatausedinthe simula-tionprocesswasgeneratedusingthebuilding’srooftopweather station,thesimulatedandmeasureddatapredictablybearavery closeresemblance.APearsoncorrelationfigureof99.7%indicates thatmeasuredandsimulatedgasconsumptionvaluesvaryclosely inmagnitudeanddirection.Themeasuredenergyconsumptionin
Fig.8hasa steppedpattern duetothefactthat thethree boil-ers serving thebuildingcannot modulateinfinitely, sothere is repetitionof specificpart/full loadcapacity outputsat timesof similarheatdemand.Thesimulatedvalueshoweverresultfrom mathematicalloadcalculation,whichwouldbydefinitionhavean infinitelyvariablenature.Fig.9outlinestheMBEandCV(RMSE) cal-ibrationresults.Aswellasmonthlyandannualvalues,theoverall
Fig.9.MBEandCV(RMSE)analysisforbuildinggasconsumption(hourlydata).
resultsarecalculateddiscountingthesummermonthsto demon-stratethemoderatingeffectthat3monthsofnoheatingload(i.e. zerogaspredictionerrors)canhaveontheoverallresult.Thelargest errorsbelongtoOctoberseasonwhenthebuildingwasalsoused attheweekendsfororganisationalpurposes.
TheMBEandCV(RMSE)valuesfallwithintherespectiveASHREA acceptancelimitsofwithin±10%andbelow+30%.Equally91.1% oftheresidualvaluesfallwithin±10kWh(Fig.10).Thesimulated modeldisplaysaslighttendencytoover-predictgasconsumption (hencegreaterincidentsofnegativeresiduals).Thefrequencyof bothoverandunderpredictedvaluesarehoweverinsignificant. Notethatthelargeincidentsofvaluesbinnedatthebarcentring onzero(Fig.10)isduetothreemonthsofnoloads(henceresidual valueofzero)aswellasincidentsofnoboileroperationduring heatingseason.
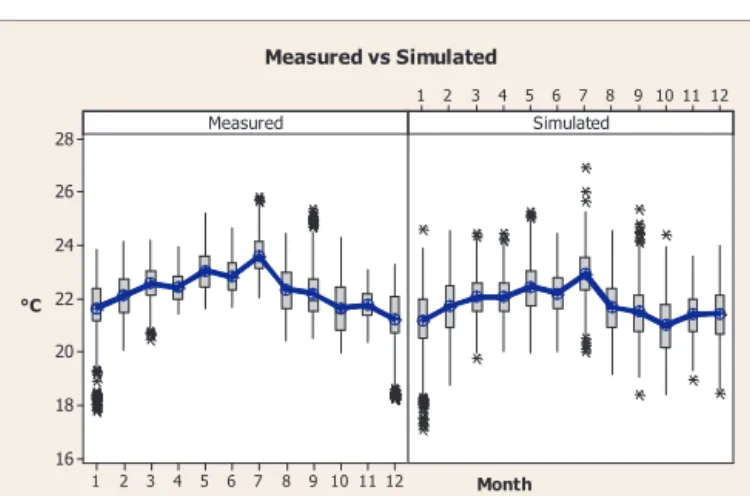
4.3. Spacetemperature
Actualrecordedairtemperatureoverafullannualcyclewere usedtoexaminetheabilityofEnergyPlusmodeltoaccurately pre-dictzonetemperature.Thisalsoactsasastage2calibration.Fig.11
allowsaquickvisualcomparisonoftheBWMplotsofannualhourly spaceairtemperaturesforbothmeasuredandsimulateddatasets.
Fig.12outlinestheMBEandCV(RMSE)errorchecksof tempera-tureresults.ItwasnotedearlierthatMBEandCV(RMSE)indices are statistical gauges of normalised ‘relative’ and normalised
30 20 10 5 0 -5 -10 -20 -30 3500 3000 2500 2000 1500 1000 500 0 Residual values (kWh) Fr e q u e n cy
Fig.10.Histogramofhourlygasresiduals(kWh).
‘accumulated’ errors and as such they can offer insights into deviationsofEnergyPlusspacetemperaturepredictionfrom corre-spondingactualvalues.99.5%oftheerrors(asdefinedbyformula 3)fallwithin±1.5◦Cand 93.2%arewithin±1◦C.Overall actual spacetemperaturesarewarmerbyanaverageof0.47◦Coverthe fullannualcycle,andthisisevidentbythegreaterinstancesof positiveerrors onFigs. 13and14.ThehistograminFig.13 has a bimodal spread with its centre at around 0.25◦C, indicating thattheEnergyPlusmodelinthiscasestudytendstomarginally under-predictthetemperatureinthespace.Errorshoweverhave anequaldistributiononbothsidesofthepeak.Thescatterploton
Fig.14showsaconstantspreadoferrorswithincreasingsimulated temperatures,whichdemonstratesthatEnergyplusmodel main-tainsaconstantlevelofaccuracyacrossthefullrangeofpredicted temperatures.
Thesummerperiod(withtheheatingsystemidle)observesa smallreductionin themagnitudeofMBEand CV(RMSE)values (Fig.12).Converselyallwintermonthshaveslightlylargererror magnitudes.Thistrendsuggestsamoreaccuratetemperature pre-dictionbythemodelintheabsenceofheatingsysteminput(When AHUsareonlydeliveringdisplacementventilation).HVACheating operationthereforeintroducesalargerelementoferrorinmodel temperaturepredictionsin this study.Recallfrom sub-metered electricalcalibrationresultsthat HVACcategoryhad thelargest magnitudeoferror(Table3).
12 11 10 9 8 7 6 5 4 3 2 1 28 26 24 22 20 18 16 12 11 10 9 8 7 6 5 4 3 2 1 Measured Month °C Simulated Measured vs Simulated
0.74% 1.96% -5% -3% -1% 1% 3% 5% MBE CV(RMSE)
No heang plant operaon
Fig.12.MBEandCV(RMSE)analysisofofficetemperature(hourlydata).
2.0 1.5 1.0 0.5 0.0 -0.5 -1.0 -1.5 -2.0 600 500 400 300 200 100 0 Residual Value (°C) Fr e q u e n cy
Fig.13.Histogramofhourlytemperatureresiduals.
Fig.14.Hourly-basedscatterplotofresidualversussimulatedvalues(◦C).
5. Discussions
Giventhediverseandvariednatureofunderlyinguncertainties insimulationattempts,buildingperformanceresultscanatbest restwithinasmallallowableerrormargin.Inthefirststageofthe calibration,adetailedEnergyPlusbuildingmodelcontaininglocal weatherdataachievedrespectivehourlyMBEandCV(RMSE)values of±5%andbelow+10%forgasandelectricityloadprediction.Inthe secondstagethecalibratedmodeldemonstratedairtemperature predictionaccuraciesof±1.5◦Cfornearly99.5%andanaccuracy of±1◦Cfornearly93.2%ofhourlyinstancesoverthefullannual cycle.MBEandCV(RMSE)valueseachprovidea differentsetof insights.MBEvalueshavethedrawbackofcancellationandhence
mightunder-reportthemagnitudeofseasonalerrors,asobserved forinstanceinelectricalcalibrationwheretheoverallMBEvalueof 0.9concealedmuchlargermonthlyMBEerrors(Fig.6).Therefore,if theanalystseekstohighlightinstanceofunderoroverprediction, monthlyintervalsofMBEindexcanprovemoreinstrumental.This thereforeallowstheanalysttheopportunitytoaccountfor sea-sonalvariationsandreasonsbehindthem.IncontrastCV(RMSE) valuesprovideabetterindicationifasingleindexdemonstrating the‘accumulatedmagnitude’oferrorissought.Withinthiswork theHVACenergyconsumptioncarriedthelargesterrorandwas thegreatestsourceofuncertaintyinthemodelenergyprediction, affectingmostlythesimulatedelectricityvalue.Incontrastmodel gasconsumption prediction(beinga directfunction ofweather data)achievedgreaterlevelsofaccuracy.Interestinglyactualgas consumptionwassmallerthansimulated(Fig.8),yettheactual HVAC electricityconsumption wasbiggerthan simulated(from
Table3,ElectricityMBEMothlyvalueforHVACconsumptionhasa
positive magnitude of4.69which points tolargeractualHVAC electricityconsumption).Sincelessgasconsumptionshouldlead tosmallerheatingrelatedpumpingduties(hencesmallerHVAC electricity),thisdiscrepancycouldariseform:
1ThetwolargeAHUsandthecoldwaterboosterpumpsets. 2Naturalventilationandinfiltrationvalues whichcouldleadto
largersummer-timecoolingload.Airflowsinbuildingscontinue toremainverydifficulttomeasureandquantifydespitetheir significantenergyandcomfortimplications.
Deriving more definite conclusions in the absence of sub-meteredwaterandhourlyAHUfigureswouldhowevernotcarry much scientific rigor.Another notablepoint is that in order to accountforthemeasurement errorwithinthiscalibration exer-cise,authorshavemadetheassumptionthatthegasandelectricity meter’saccuracywithintargetbuildingcomplieswithSI684(1983) andIEC62053respectivelyasextensiveattemptstoobtainmeter compound errormarginsfrom manufacturersfailedtoproduce anyresults.Theseguidelinesallow+2.5%or−3.5%ofcompound instantaneousdeviations.
Overall Energyplus engine provided a very accurate evalua-tionofbuildingenergyandenvironmentalperformancewhereby annual simulated electricity load was under-predicted by only 1.08%, thatof gaswasover-predicted by3.8%and annual tem-perature withinthespace wasunder-predictedby 0.47◦C. It is hopedthatthisattemptcanofferinsighttofurtherrefinementof thecalibrationprocesswherecurrentlyclarificationsare particu-larlyneededforinstanceswhenmeasureddataislimitedorofa coarsenature.Itcouldbearguedthatthebulkofexistingbuilding
errors.Pervasive sensing technologiesand digitallylogged sub-metered information offer the re-focusing the post occupancy studiestotheexploitationofactualvaluesthatwithinacalibrated modelcanfacilitateECMandoptimisationstudieswith increas-ingaccuracy.Thefollowingsummarisesthemainfindingsofthis workthatoffersasetofrecommendationiffurtherdevelopment ofASHRAEmethodofbuildingenergymodelcalibrationwastobe undertaken:
1Wherepossiblecalibrationshouldbeconductedoveranannual cycleusinghourlyenergydata.Whereimpractical;hourly pri-mary data could be collected for shorter cycles (weekly or monthly)to‘validate’simulationresults.
2Localweatherfilesshouldbeobtainedandusedforamodelto beconsideredcalibrated.Anyotherweatherfiletypemayassist avirtualmodeltobevalidated.
3MBE and CV(RMSE) calibration results (as those inferred by ASHRAEGuide 14)when presented inmonthly intervalswill allowanassessmentofseasonalvariations.
4Residualhistogramsorscatterplotscanalsoshedfurtherlighton thetendencyofthemodeltounder/overpredictacrossthefull rangeofsimulatedvalues.
5Thelevelsoftoleratederrorofa modelshouldbedictatedby thefunctionofthevirtualmodelandprimarydataavailability. Thereisscopeforfurtherworktodefinetherequiredlevelsof modelaccuracyforeffortssuchasoptimisationandcontrol stud-ies,ECMandtechnologyappraisals,renewableintegration,etc. Tothatend,furtherrefinementofcalibrationguidelinesshould firstreflectthemodelpurpose.
Fig.A1.Casestudybuilding’srooftopweatherstation(insetleft:twomain dash-boarddesktopinterfacesprovidinglivereadings).
Intheirconcludingremarks,Raftery,Petal.recommend nar-rowing ASHREA acceptance criteria hourly MBE and CV(RMSE) values to ±5% and ≤+20% respectively [72]. As demonstrated withinthiswork,modelscalibratedtotheselimitscanmore confi-dentlypredictactualprevailingtemperatureswithinthebuilding. Thefindingsofthis papersupportsthisproposition particularly forscientificworkconductedusingactualhourlydataoverannual cycles.Thiswould ensuregreaterconfidencein theaccuracyof modelbasedstudiesandbringsaboutaunifiedapproachtomodel calibration.TheexistingMBEandCV(RMSE)valuesof±10%and ±30%canstillbeadheredtowhencompleteannualhourlydatais notavailabletotheanalystandsuchamodelcanbeconsidered ‘validated’.
Inafollow-uppaperthecalibratedmodelisusedtoexaminethe potentialsofadaptivecomfortasdefinedbyEN152512007inthe targetofficebuildingwithincurrentandpassivehouseenvelope.
Acknowledgements
TheauthorswouldliketothankEngineeringandPhysical Sci-encesResearchCouncil(EPSRC)fortheirfinancialsupportwhich enabledtheundertakingofthisresearchwork(EPSRCgrant refer-enceEP/I000755/1).
10 15 20 25 30 35 40 0 10 20 30 40 50 60 0 10 20 30 40 50 60 °C Time (sec) Sensor 1 Sensor 2
Fig.C1.Sensorresponsetimecurvesoverfullroomtemperatureranges.
0 5 10 15 20 25 30 35 3 10 20 30 Ca librat or [T ES TO 435 ] (° C) Calibrated sensor (°C) Sensor 1 Sensor 2
Fig.C2.AccuracygraphproducedagainstTESTO435measurements.
AppendixA. Weatherstation
Fig.A1
AppendixB. Sensorpositions
Fig.B1
AppendixC. Sensorcalibrationresults
Figs.C1andC2.
References
[1]InternationalBuildingPerformanceSimulationAssociation,Historyof Build-ingEnergyModeling,2014[cited14.7.2014];Availablefrom:http://www. bembook.ibpsa.us/index.php?title=HistoryofBuildingEnergyModeling [2]E.Mills,Inter-comparisonofNorthAmericanresidentialenergyanalysistools,
EnergyBuild.36(9)(2004)865–880.
[3]L.G.Swan,V.I.Ugursal,Modelingofend-useenergyconsumptioninthe resi-dentialsector:areviewofmodelingtechniques,Renew.SustEnerg.Rev.13(8) (2009)1819–1835.
[4]InternationalBuildingPerformanceSimulationAssociation,Historyof Build-ing EnergyModeling,2014[cited12.6.2014]Availablefrom:http://www. bembook.ibpsa.us/index.php?title=HistoryofBuildingEnergyModeling #1990s:TheRiseofthePC
[5]J.Hu,P.Karava,Astate-spacemodelingapproachandmulti-level optimiza-tionalgorithmforpredictivecontrolofmulti-zonebuildingswithmixed-mode cooling,Build.Environ.80(2014)259–273.
[6]G.D.Kontes,etal.,B.E.M.S.Intelligent,designusingdetailedthermalsimulation modelsandsurrogate-basedstochasticoptimization,JProcessControl24(6) (2014)846–855.
[7]Z.Wang,etal.,Multi-agentcontrolsystemwithinformationfusionbased com-fortmodelforsmartbuildings,Appl.Energy99(2012)247–254.
[8]D.Loshin,Chapter7–BigDataToolsandTechniques,in:D.Loshin(Ed.),Big DataAnalytics,MorganKaufmann,Boston,2013,pp.61–72.
[9]P.Raftery,M.Keane,J.O’Donnell,Calibratingwholebuildingenergymodels: anevidence-basedmethodology,EnergyBuild.43(9)(2011)2356–2364. [10]ASHRAE,Guideline14-2002:MeasurementofEnergyandDemandSavings,
ASHRAE,Atlanta,Georgia,2002.
[11]US Department of Energy, M&V Guidelines: Measurement: Verification for Federal Energy Projects, 2008, Version 3.0. p. http://mnv.lbl.gov/ keyMnVDocs/femp
[12]EfficiencyValuationOrganization,InternationalPerformanceMeasurement andVerificationProtocol,EfficiencyValuationOrganization,Washington,DC 20006,2007.
[13]J.S.Harbel,M.Abbas,Developmentofgraphicalindicesforviewingbuilding energydata:Part1,J.Sol.EnergyEng.120(1998)156–161.
[14]CIBSE,GuideF;EnergyEfficiencyinBuildings,TheCharteredInstitutionof BuildingServicesEngineers,London,2012.
[15]N.Fumo,P.Mago,R.Luck,Methodologytoestimatebuildingenergy con-sumptionusingEnergyPlusbenchmarkmodels,EnergyBuild.42(12)(2010) 2331–2337.
[16]PangX.etal.,Real-timebuildingenergysimulationusingenergyplusandthe buildingcontrolsvirtualtestbed,2011.
[17]Design Builder, Version 3.2 2014 [cited 12.6.2014]; Available from: http://www.designbuilder.co.uk/,2014.
[18]F.Karlsson,P.Rohdin,M.L.Persson,Measuredandpredictedenergydemand ofalowenergybuilding:importantaspectswhenusingbuildingenergy sim-ulation,Build.Serv.Eng.Res.Technol.28(3)(2007)223–235.
[19]C.Turner,M.Frankel,EnergyPerformanceofLEEDforNewConstruction Build-ings,NewBuildingsInstitute,Washington,DC,2008.
[20]W.L.Carroll,R.J.Hitchcock,Tuningsimulatedbuildingdescriptionstomatch actualutilitydata:methodsandimplementation,ASHRAETrans.99(1993) 928–934.
[21]L.Wang,P.Mathew,X.Pang,Uncertaintiesinenergyconsumptionintroduced bybuildingoperationsandweatherforamedium-sizeofficebuilding,Energy Build.53(2012)152–158.
[22]M.Qin, et al.,Simulation ofcoupled heat and moisture transferin air-conditionedbuildings,Autom.Constr.18(5)(2009)624–631.
[23]Y.Wang,etal.,Effectofthenightventilationrateontheindoorenvironment andair-conditioningloadwhileconsideringwallinnersurfacemoisture trans-fer,EnergyBuild.80(2014)366–374.
[24]Y.Chen,S.Wang,Transferfunctionmodelandfrequencydomainvalidation ofmoisturesorptioninair-conditionedbuildings,BuildEnviron.36(5)(2001) 579–588.
[25]C.-E.Hagentoft,Introductiontobuildingphysics,Bauphysik23(5)(2001)315. [26]H.Janssen,B.Blocken,J.Carmeliet,Conservativemodellingofthemoistureand heattransferinbuildingcomponentsunderatmosphericexcitation,Int.J.Heat MassTrans.50(5–6)(2007)1128–1140.
[27]X.Lü,Modellingofheatandmoisturetransferinbuildings:Imodelprogram, EnergyBuild.34(10)(2002)1033–1043.
[28]S.Firl ˛ag,B.Zawada,Impactsofairflows,internalheatandmoisturegainson accuracyofmodelingenergyconsumptionandindoorparametersinpassive building,EnergyBuild.64(2013)372–383.
[29]P.deWilde,W.Tian,Theroleofadaptivethermalcomfortinthepredictionof thethermalperformanceofamodernmixed-modeofficebuildingintheUK underclimatechange,J.Build.Perform.Simul.3(2)(2010)87–101. [30]M.VanBelleghem,etal.,Validationofacoupledheat,vapourandliquid
mois-turetransportmodelforporousmaterialsimplementedinCFD,Build.Environ. 81(2014)340–353.
[31]EfficiencyValuationOrganisation,InternationalPerformanceMeasurement and Verification Protocol, Efficiency Valuation Organisation, Oakridge, Tennessee,2007.
[32]USDepartmentofEnergy,M&VGuidelines:MeasurementandVerificationfor FederalEnergyProjectsVersion3.0,2008[cited16.11.2012];Availablefrom: http://mnv.lbl.gov/keyMnVDocs/femp
[33]T.Reddy,Literaturereviewoncalibrationofbuildingenergysimulation pro-grams:uses,problems,procedures,uncertaintyandtools,ASHRAETrans.112 (2006)226–240.
[34]D.Coakley,P.Raftery,M.Keane,Areview ofmethodsto matchbuilding energysimulationmodelstomeasureddata,Renew.Sust.Energ.Rev.37(2014) 123–141.
[35]S.Bertagnolio,Evidence-BasedModelCalibrationforEfficientBuildingEnergy Services,UniversitédeLiège,Liège,Belgium,2012,22June.
[36]J.Yoon,E.J.Lee,D.E.Claridge,Calibrationprocedureforenergyperformance simulationofacommercialbuilding,J.Sol.EnergyEng.,Trans.ASME125(3) (2003)251–257.
[37]Y.Pan,Z.Huang,G.Wu,Calibratedbuildingenergysimulationandits applica-tioninahigh-risecommercialbuildinginShanghai,EnergyBuild.39(6)(2007) 651–657.
[38]T.AgamiReddy,Literaturereviewoncalibrationofbuildingenergysimulation programs:uses,problems,procedure,uncertainty,andtools,ASHRAETrans. 112(partI)(2006)226–240.
[39]Z.O’Neill,etal.,ModelingandcalibrationofenergymodelsforaDoDbuilding, ASHRAETrans.117(2011)358–365.
[40]Z.O’Neill,etal.,Calibrationofabuildingenergymodelconsideringparametric uncertainty,ASHRAETrans.118(2012)189–196.
[41]G.Mustafaraj,etal.,Modelcalibrationforbuildingenergyefficiencysimulation, Appl.Energy130(2014)72–85.
[42]T.A.Reddy,I.Maor,Proceduresforreconcilingcomputer-calculatedresults withmeasuredenergydata,in:ResearchProject1051-RP,ASHRAE,Atlanta, 2006.
[43]C.J.Hopfe,J.L.M.Hensen,Uncertaintyanalysisinbuildingperformance simu-lationfordesignsupport,EnergyBuild.43(10)(2011)2798–2805.
[44]I.Macdonald,P.Strachan,Practicalapplicationofuncertaintyanalysis,Energy Build.33(3)(2001)219–227.
[45]I.A.Macdonald,J.A.Clarke,Applyinguncertaintyconsiderationstoenergy con-servationequations,EnergyBuild.39(9)(2007)1019–1026.
[55]K.Lavigne,Assistedcalibrationinbuildingsimulation-algorithmdescription andcasestudies,in:IBPSA2009–InternationalBuildingPerformance Simula-tionAssociation,2009.
[56]W.L.Carroll,R.J.Hitchcock,Tuningsimulatedbuildingdescriptionstomatch actualutilitydata:methodsandimplementation,ASHRAETrans.99(1993) 928–934.
[57]A.T.Booth,R.Choudhary,D.J.Spiegelhalter,AhierarchicalBayesian frame-workforcalibratingmicro-levelmodelswithmacro-leveldata,J.Build.Perform Simul.6(4)(2013)293–318.
[58]M.C.Kennedy,A.O’Hagan,Bayesiancalibrationofcomputermodels,J.Royal Stat.Soc.:SeriesB(StatisticalMethodology)63(3)(2001)425–464. [59]D.C.MacKay,Bayesiannon-linearmodelingforthepredictioncompetition,
in:G.Heidbreder(Ed.),MaximumEntropyandBayesianMethods,Springer, Netherlands,1996,pp.221–234.
EnergyBuild.78(2014)113–122.
[68]M.A.Christie,J.Glimm,J.W.Grove,D.M.Higdon,D.H.Sharp,M.M. Wood-Schultz,Erroranalysisandsimulationsofcomplexphenomena,LosAlamos Sci.29(2005).
[69]W.R.Chan,etal.,AnalyzingadatabaseofresidentialairleakageintheUnited States,Atmos.Environ.39(19)(2005)3445–3455.
[70]M.Sherman,TheuseofBlowerDoorData,in:LawrenceBerkleyLabReport 35173,LLBL,USA,1998.
[71]J.A.Larke,3–buildingsimulation,in:J.A.Clarke(Ed.),EnergySimulationin BuildingDesign,secondedition,Butterworth-Heinemann,Oxford,2001,pp. 64–98.
[72]P.Raftery,M.Keane,A.Costa,Calibratingwholebuildingenergymodels: detailedcasestudyusinghourlymeasureddata,EnergyBuild.43(12)(2011) 3666-3679.