Computational analyses of small
molecules activity from phenotypic screens
Azedine Zoufir
Hughes Hall
This dissertation is submitted for the degree of Doctor of Philosophy
Declaration
This thesis is submitted as the result of my own work and includes nothing which is the outcome of work done in collaboration except where specifically indicated in the text. It is not substantially the same as any that I have submitted, or, is being concurrently submitted for a degree or diploma or other qualification at the University of Cambridge or any other University or similar institution except as declared in the preface and specified in the text. I further state that no substantial part of my dissertation has already been submitted, or, is being concurrently submitted for any such degree, diploma or other qualification at the University of Cambridge or any other University or similar institution except as declared in the Preface and specified in the text.
This dissertation does not exceed the word limit of 60,000 words.
Azedine Zoufir July 2018
Summary
Title:
Computational analyses of small molecules activity from
phenotypic screens
Author: Azedine Zoufir
Drug discovery is no longer relying on the one gene-one disease paradigm nor on target-based screening alone to discover new drugs. Phenotypic-based screening is regaining momentum to discover new compounds since those assays provide an environment closer to the physiological state of the disease and allow to better anticipate off-target effects and other factors that can limit the efficacy of the drugs. However, uncovering the mechanism of action of the compounds active in those assays relies on in vitro techniques that are expensive and time-consuming. In silico approaches are therefore beneficial to prioritise mechanism of action hypotheses to be tested in such systems.
In this thesis, the use of machine learning algorithms for in silico ligand-target prediction for target deconvolution in phenotypic screening datasets was investigated. A computational workflow is presented in Chapter 2, that allows to improve the coverage of mechanism of action hypotheses obtained by combining two conceptually different target prediction algorithms. These models rely on the principle that two structurally similar compounds are likely to have the same target. In Chapter 3 of this thesis, it was shown that structural similarity and the similarity in phenotypic activity are correlated, and the fraction of phenotypically similar compounds that can be expected for an increase in structural similarity was subsequently
quantified. Morgan fingerprints were also found to be less sensitive to the dataset employed in these analyses than two other commonly used molecular descriptors.
In Chapter 4, the mechanism of action hypotheses obtained through target prediction was compared to those obtained by extracting experimental bioactivity data of compounds active in phenotypic assays. It was then showed that the mechanism of action hypotheses generated from these two types of approach agreed where a large number of compounds were active in the phenotypic assay. When there were fewer compounds active in the phenotypic assay, target prediction complemented the use of experimental bioactivity data and allowed to uncover alternative mechanisms of action for compounds active in these assays.
Finally, the in silico target prediction workflow described in Chapter 2 was applied in Chapter 5 to deconvolute the activity of compounds in a kidney cyst growth reduction assay, aimed at discovering novel therapeutic opportunities for polycystic kidney disease. A metric was developed to rank predicted targets according to the activity of the compounds driving their prediction. Gene expression data and occurrences in the literature were combined with the target predictions to further narrow down the most probable mechanisms of action of cyst growth reducing compounds in the screen. Two target predictions were proposed as a potential mechanism for the reduction of kidney cyst growth, one of which agreed with docking studies.
Acknowledgements
I would like to thank my supervisor Dr Andreas Bender for allowing me to be a part of his lab. I thank him for his continuous guidance and patience through all the revisions of my work. I also thank my collaborators from the University of Leiden, Dr Tijmen Booij and Dr Leo Price for providing the kidney cyst screening data, and Dr Dorien Peters and Tareq Malas for providing their gene expression dataset. I am grateful to Dr Xitong Li and Dr Ellen Berg for providing the BioMAP dataset. I thank the European Research Council for funding my research.
Next, I thank Dr Fredrik Svensson, Dr Krishna Bulusu, Dr Avid Afzal and Dr Deszo Modos, for providing excellent scientific advice and very constructive feedback on my work. I am grateful to the whole of the Bender group for being supportive colleagues and always friendly. Rich and Lewis are thanked for their technical help in using our computing server. Also, my time in this group would not have been the same without Sefer, Siti, Fatima, Nitin, Avid, Leen, Nadia, Fredrik, Deszo and Krishna, who all have been very supportive and helpful with me, and I am very grateful to all of them. I really enjoyed working among such a diverse and talented group of people. I also thank Susan Begg without whom the lab would not be running so smoothly.
Last but not least, I thank my family and particularly my parents for their encouragements throughout my studies. My deepest gratitude goes to my friends Ain, Charles, Ben and Cristian for being there in those times when friends are needed, and for keeping me away of my thesis when I would become too preoccupied about it.
i
Table of Contents
TABLE OF CONTENTS ... I LIST OF FIGURES ... VI LIST OF TABLES ... VIII ABBREVIATIONS ... X
CHAPTER 1 INTRODUCTION ... 1
1.1 FROM TARGET-BASED TO PHENOTYPIC-BASED DRUG DISCOVERY ... 2
1.1.1 TARGET-BASED SCREENING AND LIMITATIONS ... 2
1.1.2 PHENOTYPIC-BASED SCREENING COMPENSATES FOR THE LIMITATIONS OF TARGET-BASED SCREENING ... 3
1.1.3 ASSAYS USED IN PHENOTYPIC-BASED SCREENING ... 4
1.1.4 IN VITRO DECONVOLUTION IN PHENOTYPIC SCREENS AND LIMITATIONS ... 5
1.2 MOLECULAR AND BIOLOGICAL SIMILARITY ... 7
1.2.1 REPRESENTATION OF CHEMICALS ... 7
1.2.2 MOLECULAR SIMILARITY PRINCIPLE IN VIRTUAL SCREENING AND NEIGHBOURHOOD PROPERTY ... 10
1.3 IN SILICO DECONVOLUTION METHODS OF COMPOUND ACTIVITY IN PHENOTYPIC SCREENS ... 14
1.3.1 DATA-DRIVEN DECONVOLUTION ... 14
1.3.2 DECONVOLUTION METHODS BASED ON IN SILICO LIGAND-TARGET PREDICTIONS ... 16
ii
1.3.2.2 Current target prediction methods ... 19
1.3.2.3 Applications to deconvolution of compounds active in phenotypic screens .... 26
1.4 CONCLUSIONS AND AIMS OF THE THESIS ... 28
CHAPTER 2 COMPUTATIONAL METHODS ... 30
2.1 WORKFLOW OVERVIEW ... 30
2.2 MOLECULAR FINGERPRINTS ... 32
2.2.1 ECFP4 FINGERPRINTS ... 32
2.2.2 MACCS KEYS AND PUBCHEM FINGERPRINTS ... 35
2.3 SIMILARITY SCORING ... 35
2.3.1 STRUCTURAL SIMILARITY SCORING ... 35
2.3.2 BIOLOGICAL SIMILARITY SCORING ... 36
2.4 LIGAND-TARGET PREDICTION MODELS ... 37
2.4.1 CHEMBL TARGET PREDICTION MODEL ... 38
2.4.1.1 Laplacian-corrected multinomial Naïve Bayes machine learning model ... 38
2.4.1.2 Multinomial Naïve Bayes target prediction model and training data ... 40
2.4.2 PIDGIN TARGET PREDICTION MODELS ... 41
2.4.2.1 Random Forest machine learning model ... 41
2.4.2.2 Target prediction model based on Random Forest and Training data ... 43
2.5 ADDITIONAL OUTPUT PROCESSING PERFORMED IN THIS THESIS ... 44
iii
CHAPTER 3 QUANTIFYING THE MOLECULAR SIMILARITY PRINCIPLE IN
PHENOTYPIC SCREENING DATASETS ... 48
3.1 INTRODUCTION ... 48
3.2 MATERIALS AND METHODS ... 51
3.2.1 PHENOTYPIC PROFILE DATA COLLECTION AND PREPARATION ... 51
3.2.1.1 BioMAP dataset ... 51
3.2.1.2 ChEMBL compound dataset ... 54
3.2.2 STANDARDISATION, FINGERPRINT GENERATION AND CHEMICAL SIMILARITY ... 55
3.2.3 PHENOTYPIC SIMILARITY COEFFICIENTS ... 56
3.2.4 MODELLING OF THE RELATIONSHIP BETWEEN THE FRACTION OF PHENOTYPICALLY SIMILAR COMPOUNDS WITH INCREASING CHEMICAL SIMILARITY USING BAYESIAN REGRESSION MODELS ... 57
3.2.5 MODEL SELECTION AND ESTIMATION OF SLOPES AND BREAKPOINT ... 60
3.2.6 NEIGHBOURHOOD ENHANCEMENT ... 61
3.3 RESULTS AND DISCUSSION ... 62
3.3.1 PHENOTYPIC SIMILARITY INCREASES WITH STRUCTURAL SIMILARITY ... 62
3.3.2 QUANTIFICATION OF THE MOLECULAR SIMILARITY PRINCIPLE THROUGH BAYESIAN REGRESSION MODELS ... 66
3.3.3 NEIGHBOURHOOD ENHANCEMENT INDICATED THAT ECFP4 ARE BETTER DESCRIPTORS FOR SIMILARITY ANALYSES INVOLVING PHENOTYPIC SCREENING DATA ... 75
iv
CHAPTER 4 COMPARATIVE STUDY OF THE MECHANISM OF ACTION
HYPOTHESES OBTAINED IN THE NCATS DATASET USING EXPERIMENTAL
BIOACTIVITY VERSUS IN SILICO BIOACTIVITY ... 81
4.1 INTRODUCTION ... 81
4.2 MATERIALS AND METHODS ... 85
4.2.1 NCATS PHENOTYPIC COMPOUND (NPC) LIBRARY AND GENERATION OF THE PHENOTYPIC OUTCOMES MATRIX ... 85
4.2.2 DRUGMATRIX AND GENERATION OF THE ON-TARGET ACTIVITY MATRIX ... 87
4.2.3 TARGET PREDICTION MATRIX ... 88
4.2.4 SUPERVISED CLUSTERING WITH SUPERVISED SELF-ORGANISING MAPS ... 89
4.2.5 QUANTITATIVE COMPARISON OF TARGETS ASSOCIATED WITH EXPERIMENTAL CLUSTERS VS IN SILICO CLUSTERS USING GENE ONTOLOGY-BASED FUNCTIONAL SIMILARITY……….……….……….……….……….………92
4.3 RESULTS AND DISCUSSION ... 96
4.3.1 ANALYSIS OF THE RELATIONSHIP BETWEEN THE PHENOTYPIC ANNOTATIONS AND SELECTION OF PHENOTYPIC NEIGHBOURHOODS ... 96
4.3.2 ANALYSIS OF THE FUNCTIONAL SIMILARITY OF TARGETS ASSOCIATED WITH PHENOTYPIC NEIGHBOURHOODS IN BOTH SSOMS ... 101
4.3.3 COMPARISON OF TARGETS ASSOCIATED WITH ANTI-ANGIOGENESIS NEIGHBOURHOODS ... 104
4.3.4 COMPARISON OF TARGETS ASSOCIATED WITH DIABETES NEIGHBOURHOODS USING GLP-1 SECRETION AND INSULIN SECRETION NODES ... 107
4.3.5 COMPARISON OF TARGETS ASSOCIATED WITH KRAS/WNT SYNTHETIC LETHAL NEIGHBOURHOODS ... 110
v
4.4 CONCLUSION ... 115
CHAPTER 5 COMPUTATIONAL STUDIES OF THE MECHANISM-OF-ACTION OF KIDNEY CYST GROWTH REDUCING COMPOUNDS ... 117
5.1 INTRODUCTION ... 117
5.2 MATERIAL AND METHODS ... 120
5.2.1 SPECTRUM LIBRARY AND SCREENING FOR KIDNEY CYST GROWTH REDUCTION ... 120
5.2.2 COMPOUND DATASET PRE-PROCESSING AND FILTERING ... 122
5.2.3 TARGET PREDICTION AND STATISTICAL ASSOCIATION WITH EFFECT ON CYST GROWTH……….123
5.2.4 TARGET SHORTLISTING BASED ON CAD VALUES, LITERATURE OCCURRENCE, AND GENE EXPRESSION STUDIES ... 124
5.2.5 DOCKING ... 125
5.3 RESULTS AND DISCUSSION ... 126
5.3.1 CYST AREA DEVIATION RANKED TARGETS THAT ARE KNOWN TO BE INVOLVED IN PKD HIGHER THAN OTHER TARGETS ... 126
5.3.2 INTEGRATION OF GENE EXPRESSION STUDIES AND TARGET OCCURRENCES IN LITERATURE WITH THE LIST OF TARGETS SCORING HIGH FOR CAD ... 129
5.3.3 DOCKING ANALYSES AGREED WITH 1 OUT OF 2 SHORTLISTED TARGET PREDICTION……….……….………133
5.4 CONCLUSION ... 135
CONCLUSION ... 139
REFERENCES ... 143
vi
List of figures
FIGURE 1. ILLUSTRATION OF THE NEIGHBOURHOOD PROPERTY PRINCIPLE.. ... 13
FIGURE 2. TARGET PREDICTION APPROACH.. ... 17
FIGURE 3. TARGET PREDICTION WORKFLOW EMPLOYED IN THIS THESIS. ... 31
FIGURE 4. ECFP4 GENERATION ALGORITHM. . ... 34
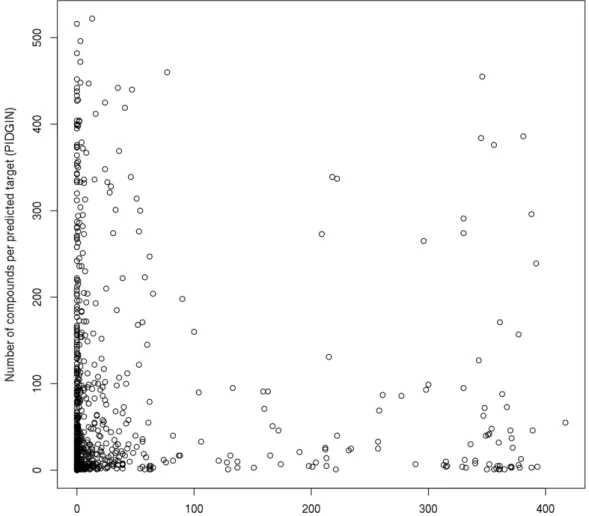
FIGURE 5. COMPARISON OF COMPOUND COUNTS IN THE NCATS LIBRARY PER PREDICTED TARGET FOR PIDGIN (Y-AXIS) AND CHEMBL (X-AXIS). ... 47
FIGURE 6. EVALUATION OF THE RELATIONSHIP BETWEEN THE FRACTION OF PHENOTYPICALLY SIMILAR COMPOUND PAIRS AND CHEMICAL SIMILARITY IN THE BIOMAP DATASET. ... 64
FIGURE 7. EVALUATION OF THE RELATIONSHIP BETWEEN THE FRACTION OF PHENOTYPICALLY SIMILAR COMPOUND PAIRS AND CHEMICAL SIMILARITY IN THE CHEMBL DATASET. ... 65
FIGURE 8. CURVE AVERAGING AND BAYESIAN REGRESSION MODELLING FOR THE BIOMAP DATASET. ... 67
FIGURE 9. CURVE AVERAGING AND BAYESIAN MODELLING FOR THE CHEMBL DATASET ... 71
FIGURE 10. NEIGHBOURHOOD ENHANCEMENT RATIO DISTRIBUTIONS FOR EACH COMBINATION OF FINGERPRINT AND DATASET. ... 76
FIGURE 11. PAIRWISE DIFFERENCES BETWEEN COMPOUND ACTIVITIES IN THE BEL-7402 ASSAY COMPARED TO CHEMICAL SIMILARITY WITH ALL THREE FINGERPRINTS ... 79
FIGURE 12. OVERVIEW OF THE WORKFLOW EMPLOYED IN THIS CHAPTER TO SEPARATE PHENOTYPIC ACTIVITY CLUSTERS BASED ON RELEVANT TARGETS. ... 84
FIGURE 13. NORMALISED INFORMATION CONTENT (NIC) IN FUNCTION OF THE FREQUENCY OF A GO TERM (P). ... 95
vii
FIGURE 15. SUPERVISED SELF-ORGANISING MAP FOR THE TARGET PREDICTION DATASET ... 100
FIGURE 16. DISTRIBUTION OF PAIRWISE GENE FUNCTIONAL SIMILARITY (NIC) BETWEEN THE GENES OF THE DRUGMATRIX-BASED SSOM AND THE GENES OF THE TARGET PREDICTION SSOM. ... 103
FIGURE 17. CHARACTERISTICS OF THE CYST AREA DEVIATION (CAD) DISTRIBUTION
MEASURING THE STRENGTH OF ASSOCIATION OF A TARGET TO CYST GROWTH REDUCTION AND VALIDATION AGAINST OPEN TARGETS METRICS.. ... 128
FIGURE 18. VENN DIAGRAM REPRESENTING HOW TARGETS WERE SHORTLISTED FOR NOVELTY, THEIR EFFECT IN THE KIDNEY CYST SCREEN AND/OR THEIR ENRICHMENT IN THE CGR SET OF COMPOUNDS, AND THEIR AGREEMENT WITH GENE EXPRESSION STUDIES. ... 130
FIGURE 19. SUPERIMPOSITION OF PODOPHYLLIN (LEFT) AND PICROPODOPHYLLIN (RIGHT) WITH VORAPAXAR (CO-CRYSTALLISED LIGAND, COLOURED IN CYAN) IN THE BINDING SITE OF PROTEASE-ACTIVATED RECEPTOR 1 (PAR-1). ... 136
FIGURE 20. INTERACTION DIAGRAM FOR VORAPAXAR (CO-CRYSTALLISED) INHIBITOR IN THE BINDING SITE OF PAR-1. ... 137
FIGURE 21. INTERACTION DIAGRAM OF PODOPHYLLIN ACETATE (LEFT) AND
PICROPODOPHYLLIN ACETATE (RIGHT) WITH THE AMINO ACIDS IN THE BINDING SITE OF PAR-1 ... 138
viii
List of tables
TABLE 1. IN VITRO DECONVOLUTION METHODS DISCUSSED IN THIS CHAPTER. ... 8
TABLE 2. BIOACTIVITY DATABASES DISCUSSED IN THIS CHAPTER AND STATISTICS (AS OF
5/4/18) ... 16
TABLE 3. TARGET PREDICTION ALGORITHMS DISCUSSED IN THIS CHAPTER. ... 25
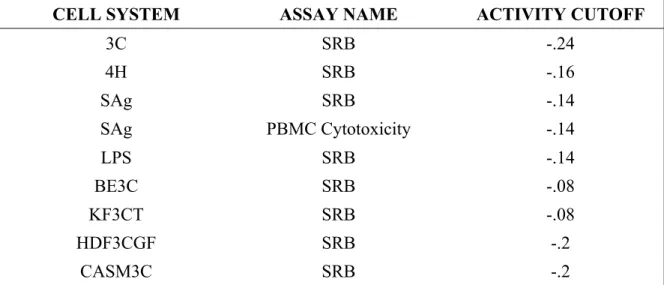
TABLE 4. ASSAYS AND CUT-OFFS EMPLOYED TO FILTER OUT CYTOTOXIC COMPOUNDS IN THE BIOMAP DATASET. ... 52
TABLE 5. KEY ESTIMATES AND ASSOCIATED 95% CONFIDENCE INTERVAL FOR THE MODELS FITTED ON THE AVERAGED CURVES FOR THE BIOMAP DATASET. ... 70
TABLE 6. KEY ESTIMATES AND ASSOCIATED 95% CONFIDENCE INTERVAL FOR THE MODELS FITTED ON THE AVERAGED CURVES FOR THE CHEMBL DATASET.. ... 74
TABLE 7. PHENOTYPIC ANNOTATIONS IN THE NCATS DATASET, THEIR TARGET BIOLOGICAL ENDPOINT, A DESCRIPTION OF EXPERIMENTAL MEASUREMENTS AND THE NUMBER OF ASSAYS MEASURING THEM. ... 86
TABLE 8. TARGETS ASSOCIATED WITH ANTI-ANGIOGENESIS NEIGHBOURHOODS IN EACH SSOM ALONG WITH THE NUMBER OF NODES FOR WHICH THE TARGET IS ASSOCIATED. ... 106
TABLE 9. TARGETS ASSOCIATED WITH INSULIN SECRETION AND/OR GLP-1 SECRETION
NEIGHBOURHOODS IN THE DRUGMATRIX SSOM. ... 108
TABLE 10. TARGETS ASSOCIATED WITH INSULIN SECRETION AND/OR GLP-1 SECRETION
NEIGHBOURHOODS IN THE TARGET PREDICTION SSOM. ... 109
ix
TABLE 12. TARGETS SELECTED AS A RESULT OF THE INTERSECTION BETWEEN THE THREE FILTERS NAMELY, DIFFERENTIAL EXPRESSION FILTER, ASSOCIATION TO PKD FILTER AND OCCURRENCE IN THE LITERATURE FILTER.. ... 132
TABLE 13. SHORTLISTED PREDICTED TARGETS WHEN CYTOTOXICITY FILTER WAS INCLUDED AND OUTCOME OF STRUCTURE-BASED STUDIES. ... 133
TABLE 14. GLIDE DOCKING SCORES OF PODOPHYLLIN ACETATE, PICROPODOPHYLLIN ACETATE AND THE CO-CRYSTALLIZED INHIBITOR VORAPAXAR FOR THE PAR-1 STRUCTURE ... 134
x
Abbreviations
A
ACE Angiotensin-converting enzyme
ADPKD Autosomal Dominant Polycystic Kidney Disease
ADSC Adipose-Derived Stem Cells
ALDH2 Aldehyde Dehydrogenase
ALP Alkaline Phosphatase
ARTS Assay Related Target Similarity
B
BioMAP Biologically Multiplexed Activity Profiling
BMU Best Matching Unit
C
CA14 Carbonic Anhydrase XIV
CAD Cyst Area Deviation
CDK Cyclin-Dependent Kinase
CFTR Cystic fibrosis transmembrane conductance regulator
CGR Cyst growth reducing/ Cyst growth reduction
COX-2 Cyclooxygenase 2
CTD Comparative Toxicogenomics Database
CYP Cytochrome P
CYP2D6 Cytochrome P enzyme isoform 2D6
E
EBP Emopamil binding protein
ECFC Endothelial Colony Forming Cells
ECFP Extended connectivity fingerprint
ELISA Enzyme-linked immunosorbent assay
ELPD Expected log pointwise predictive density
G
GFP Green Fluorescent Protein
GLP-1 Glucagon-like peptide-1
GO Gene Ontology
xi
H
HCS High-content screening
HDAC Histone Deacetylase
HERG Human Ether-A-Go-Go-Related Gene
HGF Hepatocyte Growth Factor
HIF-1α Hypoxia-inducible factor-1 alpha
HSD11B2 11 beta-hydroxysteroid dehydrogenase type II
HTS High-throughput screening
I
IC Information Content
IDH1 Isocitrate Dehydrogenase 1
K
KLK1 Kallikrein 1
kNN k-Nearest Neighbour
L
LINCS Library of Integrated Network-based Cellular Signatures
M
MAPK Mitogen-Activated Protein Kinase
MC3R Melanocortin-3 Receptor
MC4R Melanocortin-4 Receptor
MGEA5 Meningioma Expressed Antigen 5
MNB Multinomial Naïve Bayes
MoA(s) Mechanism(s) of action
mTOR Mammalian Target Of Rapamycin
N
NB Naïve Bayes
NCATS National Centre for Advancing Translational Sciences
NCOR2 Nuclear Receptor Corepressor 2
nIC Normalised Information Content
NIH National Institutes of Health
NOS3 Nitric oxide synthase 3
NPC National Centre for Advancing Translational Sciences Pharmaceutical Collection
O
OIDD Open Innovation Drug Discovery
P
xii
PAR-1 Proteinase-Activated Receptor 1
PASS Prediction of Activity Spectra For Substances
PBMC Peripheral Blood Mononuclear Cells
PC-1 Polycystin-1
PC-2 Polycystin-2
PDB Protein Data Bank
PDGFC Platelet-Derived Growth Factor C
PKC Protein Kinase C
PKD Polycystic Kidney Disease
PPA Picropodophyllin Acetate
PPAR-% Peroxisome-Proliferator-Activated Receptor Gamma
PPB Polypharmacology Browser
PPP Potential Pharmacophoric Points
PXR Pregnane X Receptor
Q
QSAR Quantitative structure-activity relationship
R
RF Random Forest
S
SALI Structure-Activity Landscape Index
SARI Structure-Activity Relationship Index
SEA Similarity Ensemble Approach
SLC5A1 Solute Carrier Family 5 Member 1
SOM Self Organising Maps
SRB Sulforhodamine B
sSOM Supervised Self-Organising Maps
SVM Support Vector Machine
T
Tc(s) Tanimoto coefficient(s)
TCM Traditional Chinese Medicine
TNF-α Tumor Necrosis Factor Alpha
TRAIL TNF-Related Apoptosis-Inducing ligand
V
VEGF Vascular Endothelial Growth Factor
1
Chapter 1
Introduction
A recent report by the World Health Organization (WHO) reported that 54% of the mortality observed in 2016 was due to 10 causes, 9 of which being diseases. These included various heart and respiratory diseases, Alzheimer’s disease, diabetes and tuberculosis.1 Furthermore, there are about 7000 orphan diseases for which only about 100 drugs exist, but affect more than 30 million people in Europe and 25 million in North America.2–4 Therefore, there is no question regarding the societal impact and the strong need for the development of drugs that can either prevent or stop those disorders.
Drug discovery involves interdisciplinary research aimed at discovering novel therapies. Chemistry combined with progress made in enzymology, biochemistry and pharmacology enabled the discovery and validation of protein targets related to diseases.5 These led to the development of the nowadays called target-based screening assays.
2
1.1
From target-based to phenotypic-based drug discovery
1.1.1
Target-based screening and limitations
The aim of target-based drug discovery is to either block a protein’s signalling activity that is responsible for the disease state or on the contrary to re-establish normal signalling activity in the cell.6 To discover compounds that can modulate these proteins, target-based screening assays were developed to measure the binding of compounds to a defined protein that has been obtained through recombinant technology and genetics.7 The pharmaceutical industry has been relying on these assays over the last 30 years to discover new drugs, and the majority of first-in-class drugs have been discovered through target-based assays.8
However, the number of drugs reaching the market has progressively decreased over the last two decades. While pre-clinical toxicology and solubility are the main reason of attrition rates at pre-clinical and phase I trials, efficacy remains the main reason for drugs failing in phase II.9 Indeed, the percentage of drugs that failed in phase II increased from 43% to 66% between 1990 and 2010, and those that failed in phase III increased from 20% to 30% over the same period of time.10 The lack of efficacy of the drug was the reason for failure in phase II in 51% of the trials between 2008 and 2010, and 59% of the trials between 2011 and 2012.11–13 In phase III trials, efficacy was the reason for failure in 66% of the trials between 2007 and 2010 and reduced to 52% between 2011 and 2012.11–13
This lack of efficacy of drugs was attributed to downsides of target-based approaches.14 In a study of the reproducibility of published data in the drug target literature, only about 20% of the scientific literature was in line with in-house findings.15 Another article claimed that the
3
number of unreproducible findings in the literature is about 50%.16 Another reason for the lack of efficacy is the difficulties and the lack of resources in identifying the precise molecular binding mode of the drug to the target, a pre-requisite of the usage of confirmatory target-based assays.17 Therapeutic opportunities identified in target-based approaches may translate poorly to the desired effect in vivo, as they fail to capture complex disease biology in vivo and/or cannot account for polypharmacology (the desired effect may be exerted through binding of several targets).7
1.1.2
Phenotypic-based screening compensates for the limitations of
target-based screening
In those cases where target-based approaches are not sufficient on their own, phenotypic-based screening assays have been developed that overcome the challenges of target-based assays. In these assays, rather than assessing whether a compound can modulate a specific protein target, a certain feature of a disease is exploited e.g. selective eliminating of a specific cell population or modulation of a specific pathway within a cell are instead measured.18 Measuring such readouts paints a more comprehensive picture of a compound’s effect on a native cellular environment or tissue since they use living cells in which a compound will modulate the enzymatic or signalling activity of several targets, change signalling cascades and affect various cellular processes.7,18 Under the current polypharmacology paradigm, drugs are more likely to exhibit the desired effect by affecting several targets at a time rather than modulating single targets, and the modulation of multiple targets is more likely to be assessed in phenotypic screens than in target-based assays.19
4 Phenotypic screens have had varying degrees of success and usage over the years. Between 1999 and 2008, 37% of the first-in-class drugs were discovered using phenotypic-screening while target-based approaches led to the discovery of 27% of the first-in-class drugs over the same period.20 When increasing the timeframe of the analysis and including biological therapeutics (e.g. antibodies) in addition to small molecules, only 7% of the first-in-class drugs were discovered through phenotypic screens between 1999 and 2013, while 41% of the first-in-class drugs were discovered through target-based assays.8 Rather than a way to discover new chemical entities that can serve as drugs, phenotypic screening is seen as an approach that can complement target-based approaches. Indeed, phenotypic screens can be used to discover new indications for an already marketed drug and combine them with target-based approaches to identify its mechanism of action (MoA).21 These assays are described in the next section.
1.1.3
Assays used in phenotypic-based screening
Mainly three types of assays can be found in phenotypic screening: cell viability assays, cell signalling pathway assays and disease-related assays.21 There are three types of cell viability and proliferation assays in phenotypic compound activity databases. One of the most common types of assays in this category is colourimetric assays measuring tetrazolium dyes22–24 in which living cells are detected by how they metabolise these substances using mitochondrial enzymes. Another frequently encountered cell viability assay is using Sulforhodamine B (SRB), an aminoxanthene dye which binds intracellular proteins, indicating the protein content present in a cell culture, which in turn is correlated to cell mass.25 One of the most popular cell viability assay, the Alamar Blue assay, employs a resazurin dye changing colour with the oxidation/reduction potential observed in the cell media as cells proliferate.26
5
Cell signalling pathway assays detect the modulation of a pathway by a chemical. For example, certain assays label a protein effector and member of the target pathway with Green Fluorescent Protein (GFP) and measuring the nuclear translocation of this protein to the nucleus upon a compound’s binding to the target receptor of this pathway.21 Another example includes assays where compounds are screened for their effects modulating the Wnt pathway by measuring alkaline phosphatase activity which is expressed downstream of this pathway.27,28
The last type of phenotypic assay measures disease-specific endpoints. Typical assays from this category include those found in the Biologically Multiplexed Activity Profiling (BioMAP) systems which use human primary cells to mimic a broad range of physiological responses to compounds such as inflammation, angiogenesis or microtubule function among others by measuring biomarkers (protein readouts) from 8 different cell systems29,30. High-content screening (HCS) is also very popular in the phenotypic screening literature, where cells are grown to mimic their 3D arrangement, similarly to their arrangement in biological tissues. This would, therefore, maintain their physiological properties as opposed to what would be observed within Petri dish cultures,31 and would allow developing assays which are more relevant to the in vivo disease state.
1.1.4
In vitro deconvolution in phenotypic screens and limitations
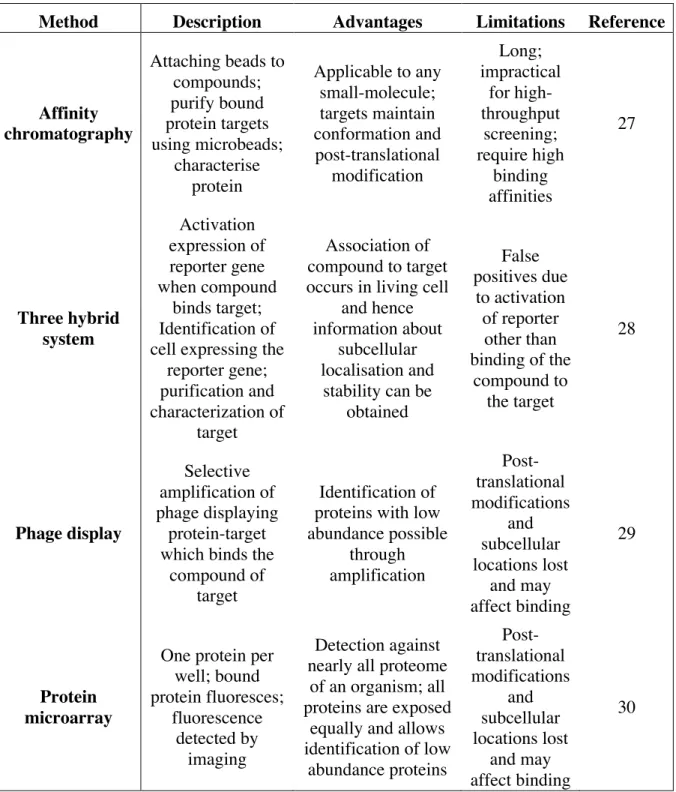
Once a compound has been successfully screened for its modulation of the phenotype of interest, several methods are available to deconvolute the activity of the compound in the phenotypic assay (Table 1), i.e. to identify the MoA of the compound responsible for the phenotypic readout in the assay.32,33 Affinity chromatography is one of the oldest
6 deconvolution methods and probes an ensemble of proteins using beads followed by identification of the bound targets with Western blots or mass spectrometry.34 However, this method is time-consuming and expensive, and therefore impractical if a relatively large number of compound signals need to be deconvoluted (Table 1).
Other techniques utilise gene expression for target identification. The three-hybrid system involves the isolation of cells associated with the expression of a reporter gene activated by the interaction of the compound with the target expressed in those cells (Table 1).35 A similar concept uses the amplification of phage colonies specifically displaying the protein targets that interact with the compound.36 The challenges with this type of assays are that post-translational modifications are often lost and that it is not possible to screen for protein complexes (Table 1).32
Protein microarrays allow probing for binding to nearly all targets in the proteome of a species. 37 Each protein is immobilised in each well of a plate, and therefore each protein has a known position on the plate. The compound can then be engineered to react to a fluorescent or radioactive conjugate enabling the detection of the compound-protein complexes upon binding. Even though this approach seems more efficient than the other approaches, the issue of detecting compound-target interactions as observed in vivo remains problematic, since post-translational modifications, location and complexes may not be amenable to this type of assay (Table 1).32 All these techniques are time-consuming and costly. It is, therefore, necessary to shortlist and prioritize compounds that are to be used in these in vitro deconvolution experiments. In silico deconvolution can help in making such decisions. These approaches rely on the molecular and biological similarity concepts which are introduced in the following section.
7
1.2
Molecular and biological similarity
This section focuses on the processing of chemical information and how it relates to the bioactivity data observed in target-based and phenotypic assays. This starts by finding an appropriate representation for the compounds in the dataset. This representation is then used to calculate the structural similarity of a query compound to other compounds of known properties.
1.2.1
Representation of chemicals
The starting point of computational approaches aimed at understanding the behaviour of compounds in in vitro assays is to find an effective representation of the chemicals. In its most simple form, a molecule may be represented as a graph, that is to say, a set of atoms (nodes) linked by bonds (edges) with labels (simple, double, etc.) from which a more complex encoding of the compound can be derived.38
8 Method Description Advantages Limitations Reference
Affinity chromatography Attaching beads to compounds; purify bound protein targets using microbeads; characterise protein Applicable to any small-molecule; targets maintain conformation and post-translational modification Long; impractical for high-throughput screening; require high binding affinities 27 Three hybrid system Activation expression of reporter gene when compound binds target; Identification of cell expressing the
reporter gene; purification and characterization of target Association of compound to target occurs in living cell
and hence information about subcellular localisation and stability can be obtained False positives due to activation of reporter other than binding of the compound to the target 28 Phage display Selective amplification of phage displaying protein-target which binds the
compound of target
Identification of proteins with low abundance possible through amplification Post-translational modifications and subcellular locations lost and may affect binding 29 Protein microarray
One protein per well; bound protein fluoresces; fluorescence detected by imaging Detection against nearly all proteome
of an organism; all proteins are exposed
equally and allows identification of low abundance proteins Post-translational modifications and subcellular locations lost and may affect binding 30
9
One possible encoding may be numeric through the molecular properties of the compound such as solubility, partition coefficient, melting point, molecular weight and electronic properties.38– 40 Other types of molecular encodings are based on torsions and angles between the atoms of a molecule, which is found to perform consistently well, according to several performance metrics, for virtual screening approaches in which query compounds are compared to reference compounds with desirable properties or activity.41 Some representations are based on pairs or triplets of atoms and represent yet another possibility to represent compounds but are not often used in cheminformatics applications.38–40
Alternative and more frequently encountered chemical representations employ a 2D molecular encoding called a fingerprint. Fingerprints are binary vectors indicating either the presence or absence of a certain structural motif in a chemical or count vectors of the molecule’s substructures 38–40. Two types of 2D fingerprints are found in the literature: molecule-based fingerprints where each bit is computed from the structure of the compound through hashing algorithms, and the dictionary-based type where each element of the binary vector represents a pre-defined chemical substructure.42
In the first category, the Morgan fingerprints or Extended-Connectivity Fingerprints (ECFP) can be found,43 which are by far the most used 2D fingerprint in the cheminformatics literature. Each bit in the vector represents hashed identifiers extracted from individual atom properties of the compound in the first iteration of the algorithm. The bit vector is then supplemented by combinations of the previous identifiers, which include up to 2 neighbouring (non-hydrogen) atoms (ECFP4) or up to 3 neighbours (ECFP6). The ECFPs outperformed most 2D fingerprints for virtual screening tasks41, which explains their popularity. The Daylight fingerprint is another type of fingerprint which is computed from linear substructures of the query compound. Each substructure is computed with a maximum pre-defined length, and identifiers
10 describing atom and bond properties are hashed to produce a binary fingerprint.44 MOLPRINT2D is another type of molecule-based fingerprint in which strings are employed to describe atomic environments for each atom,45 instead of identifiers as in the ECFP algorithm. The rest of the MOLPRINT2D fingerprint generation is similar to that of the ECFP algorithm. In the second category of 2D fingerprints, the dictionary-based fingerprints, the MACCS MDL keys are found, which encode an ensemble of 166 keys corresponding to atom and bond types,46 while PubChem fingerprints encode 881 and have additional atom counts, atomic neighbourhoods and substructures.47 The Unity fingerprint is a 988-bit vector which is a hybrid between dictionary-based and molecule-based representation since pre-defined generic atom and bond types are encoded, but paths of specified lengths are generated in a similar fashion to the Daylight algorithm.48
3D descriptors such as pharmacophores are derived from steric and electronic properties of a chemical, which are important for describing the interactions with the binding pocket of a specific target.38–40 Finally, another encoding uses projections of 3D structures into 2D circular planes, which are then used to derive potential pharmacophoric points (PPP), generating a 1D descriptor for which it becomes possible to apply bioinformatics algorithms designed to work with sequences of letters as input such as base-pair alignment.49
1.2.2
Molecular similarity principle in virtual screening and
neighbourhood property
As mentioned previously, one of the main application of the fingerprints is virtual screening.50,51 In this approach, compounds which have desired properties or activity in a
11
target-based or in a phenotypic-based screening assay are employed as a reference. After converting compounds to a suitable representation, query compounds are “screened” against the reference by measuring the similarity of the representation of the query compounds to that of the reference. This leads to filtering of the query compounds to those with the desired activity. This important property is based on the molecular similarity principle which states that structurally similar compounds should have similar properties and yield similar readouts in target-based and phenotypic-based assays.52,53 Even though virtual screening is discussed in this introduction, it is also acknowledged that the molecular similarity principle is useful for combinatorial chemists when designing new libraries of compounds based on existing libraries.54
The Tanimoto coefficient (Tc) is a measure that assesses the number of bits in common between two binary vectors and is therefore usually well-suited to measure the structural similarity between two compound’s fingerprints.55 Otherwise, the Pearson correlation coefficient is used instead to measure the similarity of two non-binary fingerprints or bioactivity profiles.
Several studies investigated the molecular similarity principle by comparing the chemical and biological similarity of pairs of compounds in a dataset. A study of the correlation between chemical similarity and activity in a monoamine oxidase inhibition assay in which Daylight fingerprints were employed. The authors found that a structural Tc similarity of 0.85 for two compounds corresponds to a 30% probability that two compounds are active in the monoamine oxidase inhibition assay used in the study.56 This observation was later repeated with 23 assays measuring the inhibition of various protein targets, mostly kinases and aminergic receptors.57 With the use of both ECFP6 fingerprints and MACCS keys, it was shown that two chemical similarity definitions of ECFP6 Tc similarity >0.4 and MACCS key Tc similarity > 0.8 correctly identified the target of one compound based on structural similarity to another
12 compound with 90% and 87% accuracy, respectively, although this was attributed to the composition of the WOMBAT dataset (congeneric chemical series) rather than the performance of the descriptors themselves.58
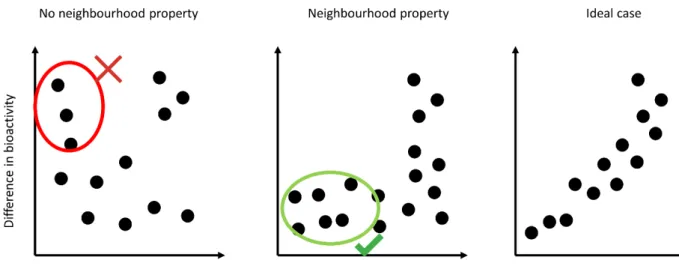
It is evident from the above studies that different descriptors capture the molecular similarity principle differently. Aiming to quantitively compare these differences, Patterson et al. found that descriptors commonly used in virtual screening applications, such as 2D fingerprints, exhibit a “neighbourhood property”, meaning that they can be used to search for compounds that fall within activity regions of interest in those descriptor spaces (Figure 1).59 Fingerprints for which two compounds are highly similar should yield similar biological activity and have such neighbourhood property (Figure 1). In contrast, descriptors which yield structurally similar compound pairs with large differences in biological activity do not display such property and are undesirable for cheminformatics applications (Figure 1).
However, the relationship between molecular similarity and activity is often more complex in reality, since small changes in chemical structure can lead to important modification of the activity against targets between two highly structurally similar analogues,53,60,61 and the “neighbourhood property” concept also allows for the evaluation of descriptors in terms of their sensitivity to such activity cliffs.59 Other studies attempted to capture and rationalize activity-cliffs in target-based bioactivity datasets by developing metrics such as the Structure-Activity Relationship Index (SARI)62 and the Structure-Activity Landscape Index (SALI)63 which have been shown to retrieve known activity-cliffs for classes of targets where these are predominant.
13
Figure 1. Illustration of the neighbourhood property principle. A descriptor for which
compound pairs display no or very little differences in bioactivity when compounds are structurally similar i.e. compound pairs with low structural similarity. On the contrary, if compounds show high differences in bioactivity despite their structural similarity, then the descriptor doesn’t have the neighbourhood property. In the ideal scenario, differences in structural similarity and bioactivity are correlated.
14
1.3
In silico
deconvolution methods of compound activity in
phenotypic screens
1.3.1
Data-driven deconvolution
The development of various omics techniques and the public availability of historical bioactivity datasets gave rise to in silico deconvolution techniques exploiting these data.33 Gene expression databases such as the Library of Integrated Network-based Cellular Signatures (LINCS) can be used to query compounds active in phenotypic screens for their gene expression profiles, already narrowing down the number of candidate protein targets to explore using in vitro deconvolution methods.64 However, due to the higher cost and lower throughput of gene expression technologies, bioactivity databases usually contain more data.
Hence, the wealth of bioactivity data can be exploited in cheminformatics analyses aimed at deconvoluting the signal of phenotypic screening campaigns. For example, bioactivity data from ChEMBL was extracted and corresponding targets were grouped by pathway annotations from the Gene Ontology (GO) framework. This grouping was used to deconvolute the activity of compounds in a screen measuring the inhibition of tumour necrosis factor alpha (TNF-α) production in leukemic cells.65 The authors found that the targets they identified for their compounds from ChEMBL were consistent with the literature on TNF-α production. In another study, enrichment analyses using Sanofi historical high-throughput screening allowed to explain the MoA of compounds active in DNA fragmentation and TNF-related apoptosis-inducing ligand (TRAIL) assays: a large number of targets were identified for the TRAIL assay
15
including a range of cyclin-dependent kinases (CDKs), vascular endothelial growth factor receptors (VEGFRs) and other kinases; whereas fewer but very relevant targets were identified for the DNA fragmentation assay, including GSK3b, Tubulin, Aurora 2 and Eg5.66
In addition to relying on the structural similarity of the compounds, the correlation of biological spectra can be used for the deconvolution. For example, the activity of a pyrimidine compound in an assay aimed at measuring the induction of senescence was attributed to targeting tubulin.67 This was performed by computing the correlation of the biological profile of this compound to the profiles of other compounds in a proprietary bioactivity database as well as employing structural similarity.
It is also possible to facilitate the deconvolution step by pre-selecting compounds with known bioactivity prior to their use in phenotypic screens. Indeed, a recent study employed a biologically annotated library of compounds, which was collected from publicly available databases and used in a phenotypic screening of compound combinations measuring the inhibition of serine palmitoyltransferase, a model for the necrosis of lung cancer. Since the compounds were already annotated from the public databases, this facilitated the identification of the putative MoA of cyclooxygenase 2 (COX-2) modulation behind the activities observed in the combination screen.68
16
1.3.2
Deconvolution methods based on in silico ligand-target predictions
While current in silico deconvolution techniques employ pre-existing bioactivity data, other methods rely on the molecular similarity principle in bioactivity datasets to predict putative targets from the fingerprint of compounds (Figure 2). These methods are the emphasis of this section.
1.3.2.1 Bioactivity datasets and limitations relevant to target prediction
Target prediction methods were developed thanks to the increasing availability of large-scale chemical information publicly available.69 While many bioactivity databases exist, only the datasets which are mentioned or used in this thesis are discussed here (Table 2) and readers are referred to Gaulton et al.69 for a more comprehensive overview of such datasets.
Database Number of
compounds Number of Targets References
Pubchem 2,570,179 10,857 70,71
ChEMBL 1,735,442 11,538 72,73
Drugmatrix 1,291 132 75,76
WOMBAT 136,091 1,320 77,78
17
Figure 2. Target prediction approach. A compound bioactivity database is employed to extract
known active ligands for a large set of targets. These are converted into fingerprints which machine learning algorithms identify and “learn”. When the fingerprint of a query compound is presented to the algorithm, it is matched to those of known actives. If the matching is successful, then the target is predicted for the compound. Repeating this process against all the known active ligand datasets of other targets will generate a predicted target profile for the query compound from which novel MoA hypotheses can be drawn.
The Molecular Libraries and Imaging program launched by the National Institutes of Health (NIH) gave rise to Pubchem47,70,71,74, one of the largest repository of high-throughput screening (HTS) data of both target-based screens and phenotypic screens. It comprises three related sub-databases: Substance, Compound and BioAssay. The latter contains bioactivity data (mostly IC50, EC50, Ki, Kd) for small molecules and RNAi, along with a suite of tools to query,
18 analyse and summarise the data. 70,71 In the latest versions, PubChem BioAssay contained more than 700,000 bioassays for more than 2,000,000 tested small molecules contributed by 50 organisations (Table 2).71
PubChem is the biggest repository and shares data with many other databases including ChEMBL, another comprehensive database developed by the EMBL-EBI containing bioactivity data extracted from more than 50,000 publications, and calculated molecular properties of chemicals, which yield data points for a total number of more than 1.3 million bioactive compounds in relation to more than 2,800 human targets (Table 2).72,73 Recent developments included information about the development stage of a chemical, new target annotation (e.g., binding site information), and the possibility to filter results based on the quality of the data via several additional fields identifying duplicates or data validity.73 While ChEMBL overlaps with PubChem, ChEMBL active compounds to inactive compounds ratio is very high, meaning that ChEMBL contains mainly potent compounds.
ChEMBL is also large enough to overlap with other databases. In particular, the Drugmatrix is a comprehensive pharmacogenomics database. It comprises gene expression profiles of chemicals, on-target binding affinities and ADME assays results, along with pathology data such as haematology, histopathology and clinical readouts in relation to these chemicals. 75,76 It has recently been in integrated with ChEMBL. It contains a complete bioactivity matrix for 1,291 compounds and 130 in vitro assays, even though the inactivity data points are not quantified in the matrix (Table 2).
PubChem also overlaps with WOMBAT, another bioactivity database which resulted from a collaboration of Astra Zeneca with the Romanian Academy Institute in Timisoara and contains 307,700 activity points on 1320 targets, and covers 136,091 unique compounds (Table 2).77,78
19
However, these datasets are not without limitations. The sparse nature of this data is the main limitation and HTS is indeed still far from giving the full picture of drug-target interactions. In addition, certain compounds do not exhibit any activities in HTS (also called “dark matter compounds”), despite them being active in other types of screening such as gene expression experiments and antifungal assays.79
While integrating data from different vendors helped in generating more complete datasets, inconsistencies were found between the different datasets.80 These inconsistencies were later attributed to errors in manual extraction and curation of bioactivity values from the literature.81 It is therefore important to recognise those limitations when using ligand-target prediction models and to keep in mind that these could potentially affect the validity of the MoA uncovered with these models. It is noted however that the likelihood of invalid results is proportional to the errors rate encountered in the databases, which in databases such as ChEMBL or PubChem, is constantly reduced thanks to the ongoing curation efforts.71,73
1.3.2.2 Current target prediction methods
Many algorithms are currently employed for ligand-target predictions. Predicting targets from fingerprints using machine learning is one of the most used approaches in the literature (Table 3). Nidhi et al. developed a multi-category Naïve Bayes (NB) model, a model which combines the probabilities of all the targets in WOMBAT.82 The model retrieved the correct first target for 82% of the compounds and the correct first target class for 89% of the compounds in the test set. They employed this model for chemicals which were only associated with a therapeutic class, in order to generate a putative novel MoA for these chemicals. This model has been extended and successfully used in other MoA studies of potential therapeutics for tuberculosis83
20 or to improve hit list triaging in a Luciferase gene reporter assay.84 Target prediction models similar to the one developed by Nidhi et al. are so far the most frequently used and have been integrated with other types of data such as high-content screening,85 gene expression profiles,86 or proteochemometric features87 in order to draw more interpretable MoA hypotheses. Even though Naïve Bayes models such as the one by Nidhi et al. are popular for target prediction, other machine learning approaches also exist (Table 3). Support Vector Machine (SVM) models were developed on the same database (WOMBAT) to generate more accurate target prediction (mean balanced accuracy of 0.912 ± 0.093), and which were used to profile drugs and hypothesise the MoA leading to liver-related adverse events.88 Self-organising maps (SOMs) were also successfully employed to predict the selectivity of glutamate receptor antagonists,89 or to predict human targets for de novo synthesised compounds.90 A more recent approach called DeepDTI employed deep neural networks to predict 10 novel drug-target interactions from drug target annotations in Drugbank which were in agreement with the literature, and the model outperformed some of the most frequently used machine learning algorithms used in target prediction, such as NB and Random Forest (RF).91
However, machine learning is not the only mean for target prediction and approaches based on similarity are also frequently employed (Table 3). The earliest attempt to employ similarity-based target prediction approach, called “prediction of activity spectra for substances” or PASS, employs a scoring function that relates the number of compounds with a certain chemical descriptor to the number of compounds active against a target.92 The popular Similarity Ensemble Approach (SEA) approach employs the Tc to compute the chemical similarity to known ligands of targets to generate predictions and evaluates the statistical significance of the scores by employing an expected value similar to the e-value employed in NCBI’s BLAST for gene alignment, which measures the likelihood of a result being random.93
21
Nickel et al. developed a web-server for target prediction called SuperPred, which is based on normalised similarity to target known actives, which takes into account differences in ligand number for the targets, and which achieved 94% accuracy (when predictions are filtered by quality), but performed poorly for targets bound by structurally diverse compounds.94 The authors behind the Polypharmacology browser (PPB), another similarity-based target prediction tool, recognised that the choice of the fingerprint impacts the predictions, and therefore decided to use a consensus prediction based on 10 descriptors (6 fingerprints and 4 combinations thereof).95 The choice of the Manhattan distance (called “city block” in the manuscript) used in this algorithm was based on computational speed but is questionable, as it was established that Tc similarity and similar methods outperform Manhattan distances among others for molecular similarity application.55
Other similarity studies using similarity were based on other descriptors than 2D fingerprints
(Table 3). Nigsch et al. investigated the use of gene expression profiles for target prediction
based on profile correlation.96 They found that a minimal number of 128 genes achieved the highest accuracy of 0.3. The iRaise target prediction algorithm is based on structural information where triangle pharmacophores are computed from the Protein Data Bank (PDB) structures and which describe hydrogen bond acceptors, donors or hydrophobic interactions.97 A similar approach is employed by the PharmMapper web server which employs pharmacophores that take into account additional properties such as positive and negative charges.98 The LT-scanner algorithm takes as input a ligand-protein complex and uses a scoring function to identify whether similar interactions can be found in other proteins across the genome.99 However, such structural information is not always available and can limit the number of targets this type of approach can find. Moreover, availability of gene expression profiles can be an issue for certain compounds, and protein structure database may not entirely cover certain protein families such as transmembrane proteins. Structure-based target
22 prediction is also more time-consuming and resource-intensive compared to approaches employing 2D fingerprints.
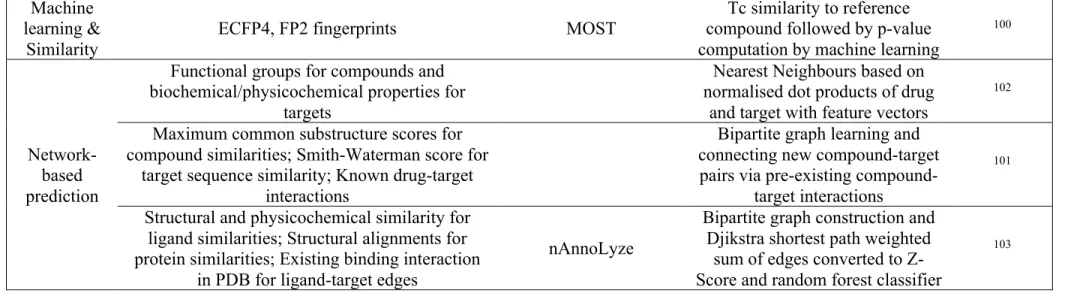
A more recent approach combined the similarity methods with machine learning algorithms, and used the actual potency of compounds in the training set to weight the Tc similarity to known ligands of targets when making predictions (Table 3).100 Downsides of this approach is the reliance on older versions of ChEMBL (versions 19 and 20) for the training set, as well as the imbalanced training sets which were biased towards potent compounds, and contained fewer inactive compounds as a result.
Network-based analyses are also employed to predict putative ligand-target pairs (Table 3). Yaminishi et al. extracted drug-target interaction network from the KEGG database and employed those in an attempt to predict novel drug-target interactions based on the proximity of both novel compounds and novel targets to already known drug-target interactions.101 The proximity of compounds was computed as the size of the common substructure set, while the proximity in target space was computed using amino acid sequence similarity. They then integrated these similarities using bi-partite graphs to predict new compound-target pairs, which is a form of network representation where edges can only be found between two sets of vertices but not within the sets themselves. He et al. have also employed KEGG networks and used instead functional group composition and amino acid composition as feature vectors for compounds and targets, respectively.102 They combined a k-Nearest Neighbour (kNN) algorithm with two feature selection methods in order to achieve accuracies around 80% depending on the target family. A more recent approach called nAnnoLyze was developed based on the construction of several sub-networks linking query compounds to ligands co-crystallised with protein targets, themselves linked to human protein targets 3D models through both sequence and structural similarity.103 This last step enhanced the number of predictable
23
targets. Additionally, compounds in a benchmark dataset compiled from Drugbank were associated with these 3D target models through Djikstra-like shortest path analyses from which scores were computed and combined in random forest classifiers. The prediction on the benchmark dataset yielded a precision of 73% and a recall of 66%. Finally, signalling and metabolic networks were also utilized for target prediction104. However, these two network approaches are at an early stage and lack evaluation on benchmarking datasets.
24
Type Input Model name Description References
Machine learning
ECFP6 fingerprints modified naïve Bayesian model Multiple-category Laplacian- 82–85
Tc similarity to reference compounds Support Vector Machine 88
Pharmacophores Self-organising maps 89
Pharmacophores and physicochemical properties SPIDER Self-organising maps 90 ECFP2, ECFP4, ECFP6 for compounds and
amino acid, dipeptide and tripeptide composition DeepDTI Deep neural networks 91
Similarity & Scoring
Multilevel neighbourhood of atoms (second level) spectra for substances Prediction of activity (PASS)
Scoring function taking into account the number of compounds
active against the target and the number of compounds
92
Daylight fingerprints Similarity Ensemble Approach (SEA)
Tc similarity and
conversion to Z-Score 93 FP24, MDL MACCS keys, ECFP4 fingerprints SuperPred Tc similarity and
conversion to Z-Score 94 Apfp, Xfp, MQN, SMIfp, Sfp, ECFP4
fingerprints and combinations
Polypharmacology
browser (PPB) Manhattan similarity 95 Gene expression profiles
Nearest Neighbours based on Pearson product-moment
correlation coefficient
96
Pharmacophores iRaise
Cascade of binding mode scoring based on spatial alignment to
reference ligand and pocket coverage
97
Pharmacophores PharmMapper Pharmacophoric fit score and conversion to Z-Score 98
Ligand-protein complex LT-scanner
Scoring function that identifies proteins with similar binding site interactions than the one observed
in ligand-target complex
25
Machine learning &
Similarity
ECFP4, FP2 fingerprints MOST compound followed by p-value Tc similarity to reference computation by machine learning
100
Network-based prediction
Functional groups for compounds and biochemical/physicochemical properties for
targets
Nearest Neighbours based on normalised dot products of drug
and target with feature vectors
102 Maximum common substructure scores for
compound similarities; Smith-Waterman score for target sequence similarity; Known drug-target
interactions
Bipartite graph learning and connecting new compound-target
pairs via pre-existing compound-target interactions
101
Structural and physicochemical similarity for ligand similarities; Structural alignments for protein similarities; Existing binding interaction
in PDB for ligand-target edges
nAnnoLyze
Bipartite graph construction and Djikstra shortest path weighted
sum of edges converted to Z-Score and random forest classifier
103
26 Since the computation of fingerprints is possible for most compounds, they provide a more readily available feature space for compounds than gene expression profiles or 3D structures which are not always available. Machine learning models may be preferred over similarity-based methods for target prediction since they achieve better accuracies on average, which may be due to the former better accounting for non-linearities in the bioactivity training data than the latter approach. Moreover, even though some of these similarity approaches were successful and some of their prediction validated,93 their predictive power is expected to be limited when it comes to novel pharmacological actions since this type of approach is based on achieving high similarity to already known ligands. Machine learning algorithms are more flexible, hence less affected by such biases. Indeed, applicability domain analyses generally circumvent those issues105 or a scoring mechanism that allows obtaining the confidence of such predictions through e.g. conformal predictions.106 Finally, target predictions based on machine learning models have been evaluated more thoroughly over the past decade than the more recent approaches based on networks, are more intuitive and are simpler to implement through the use of open-source and maintained programming libraries.
1.3.2.3 Applications to deconvolution of compounds active in phenotypic screens
Several publications illustrate the use of ligand-target prediction for the deconvolution of the activity of compounds in phenotypic screens. Such target prediction models were employed to rationalise the effects of compounds in high-content cell screens aimed at identifying compounds that modulate the cell cycle.107 They found that while most clusters putatively targeted tubulin, the group of kinase inhibitors was associated with CDK1 and CDK2 predictions, which indeed play a role in cell cycle regulation. Similar approaches were used
27
to understand the difference of MoA between cytostatic and cytotoxic compounds, where cytostatic compounds were linked to DNA damage reversal, metabolism and processes regulating the cytoskeleton.108 The same type of approach was used in rationalising the MoA for compounds present in plant extracts used in Traditional Chinese Medicine (TCM), where the phenotypic effect of the active ingredients is usually known, but not the molecular targets.109 Compounds with the cold nature affected targets involved in detoxification and sedation processes, while compounds with hot nature were linked to targets that affect fertility and cardioprotection. These target prediction methods can be combined with decision trees, such as in Liggi et al., to identify the MoA of compounds inducing different phenotypes in
Xenopus Laevis.110 Compounds affecting pigmentation were predicted to bind Carbonic anhydrase II which is in accordance with the literature on pigmentation biology. They also found that compounds affecting melanophore function targeted alpha-2a adrenergic receptor, delta-type opioid receptor metabotropic glutamate receptor 1 and tyrosine-protein kinase Fyn. A similar approach was used to rationalise the MoA of compounds that have sedative effects and were subsequently used to predict sedative and/or hypnotic function in Drugbank compounds.111 The predicted target profile implicated in the sedative-hypnotic effect was comprised of a variety of aminergic G-protein-coupled receptors (GPCRs) such as Dopamine receptors D1B, D2, D4, muscarinic receptors M1 and M4, histamine receptors H1 and adrenergic receptor alpha among others.
Methods involving similarity networks of compounds can also be used as powerful deconvoluting tools. Indeed, using a large-scale network of compound-compound similarities (named CSNAP) compounds active in a microtubule polymerization assay were grouped into five distinct target profiles, which were subsequently validated in vitro.112
28
1.4
Conclusions and aims of the thesis
Many studies have used the molecular similarity principle to generate target predictions to identify the MoA of compounds active in phenotypic screens. While the molecular similarity principle has been well-characterised in bioactivity datasets generated by target-based screening, it is not entirely clear how well the molecular similarity principle holds in datasets generated from phenotypic-based screening. In this thesis, the molecular representations described in Chapter 2 were employed to evaluate and quantify the molecular similarity principle in two datasets generated by phenotypic screening assays in Chapter 3.
The molecular similarity principle is implicitly applied in a target prediction workflow described in Chapter 2. This workflow is based on two conceptually different target prediction algorithms and it is shown how this workflow allowed to augment the coverage of MoA hypotheses.
Furthermore, while target prediction algorithms relying on this molecular similarity principle have been successfully employed in the literature to deconvolute signals in phenotypic screens, there was not any study, which assessed how the MoAs uncovered by these algorithms compare to the MoAs obtained using publicly available experimental bioactivity data of the compounds active in phenotypic screens. This is the focus of Chapter 4 where the target prediction workflow described in Chapter 2 was used to predict targets for compounds active in a phenotypic screening dataset. The MoA generated through this target prediction workflow were then compared to MoA hypotheses obtained through experimental bioactivity data of compounds active in similar phenotypic endpoints. This comparison will allow generating more insights into why these in silico methods are appropriate for the
29
deconvolution of compounds in phenotypic screens and evaluating their contribution in generating novel MoA hypotheses.
Finally, based on the insights gained from Chapter 4, the target prediction workflow was applied to generate MoA hypotheses for compounds active in a kidney cyst screening dataset in Chapter 5. It will be shown how these predictions can be improved by additional metrics to rank the predicted targets according to their relevance to the phenotypic endpoint measured in the assay. These MoA hypotheses will be further prioritised through their integration with gene expression profiles and occurrence counts in the literature. Structural bioinformatics studies of the shortlisted MoA hypotheses were also performed to strengthen their confidence. Therefore, this chapter shows how target prediction can be integrated with additional data domains to narrow down relevant MoA hypotheses for compounds active in a phenotypic screening assay.
30
Chapter 2
Computational methods
This chapter introduces the target prediction workflow employed in this thesis. This chapter introduces molecular descriptors and similarity scoring metrics used mainly in Chapter 3. One of the descriptors, namely ECFP4, is then used as input for the target prediction workflow employed in Chapter 4 and 5, and details about these algorithms are also given in this chapter.
2.1
Workflow overview
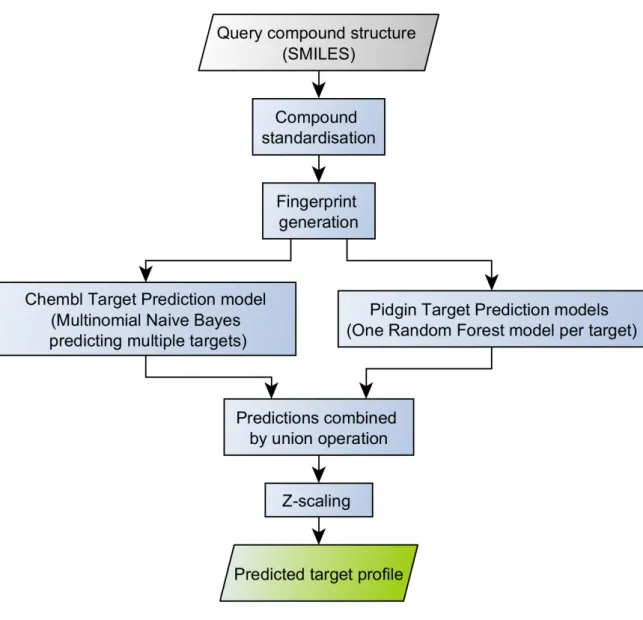
The target prediction workflow is depicted on Figure 3. The input is a query compound
structure in SMILES format. The structure is first standardized as recommended by Fourches
et al.113 The ChemAxon standardizer114 (version 15.1.19.0) was used with the options “Remove Fragment” (keep largest), “Neutralize”, “RemoveExplicitH”, “Clean2d”, “Mesomerize”, and “Tautomerize”. Then a fingerprint is generated from the compound structure. For target prediction, compounds are converted to ECFP4 fingerprints and this process is described in the next section (Figure 3).
Generated ECFP4 fingerprints are then used as input for two machine learning models that will output binding probabilities for a large number of protein targets. These will be combined and Z-scaled to filter predictions that may be obtained randomly and/or predictions that are outside the applicability domain represented by molecules active against the corresponding targets (Figure 3). More details about all of these steps are given in this chapter.
31
32
2.2
Molecular fingerprints
2.2.1
ECFP4 fing