1
How do drivers respond to silent automation failures? Driving
1simulator study and comparison of computational driver
2braking models
3Giulio Bianchi Piccinini1*, Esko Lehtonen1, Fabio Forcolin2, Johan Engström3, Deike Albers1,4, 4
Gustav Markkula5, Johan Lodin2, Jesper Sandin6 5
1 Chalmers University of Technology, Göteborg, Sweden
6
2 Volvo Group Trucks Technology, Göteborg, Sweden
7
3 Virginia Tech Transportation Institute, Blacksburg, VA, USA
8
4 Technical University of Munich, Munich, Germany
9
5 University of Leeds, Leeds, United Kingdom
10
6 VTI, Göteborg, Sweden
11
*Corresponding author at: Chalmers University of Technology, Department of 12
Mechanics and Maritime Sciences, Division of Vehicle Safety, Crash Prevention 13
Group, Lindholmspiren 3, Lindholmen Science Park, 41756 Gothenburg, Sweden, 14
Tel.: +46 31 772 69 01 15
E-mail address: [email protected] 16
17
Précis
18This article presents novel computational models predicting drivers’ brake reaction times to 19
lead vehicle braking, during driving with CC and ACC, when the latter silently fails. The 20
predictions of the computational driver models were validated using the data from a driving 21
simulator study and compared between them using the AIC. 22
23
Running head
24
Drivers response to automation failures 25
2
Abstract
26
Objective
27
This paper aims to describe and test novel computational driver models, predicting drivers’ 28
brake reaction times (BRTs) to different levels of lead vehicle braking, during driving with 29
Cruise Control (CC) and during silent failures of Adaptive Cruise Control (ACC). 30
31
Background
32
Validated computational models predicting BRTs to silent failures of automation are lacking 33
but are important for assessing safety benefits of automated driving. 34
35
Method
36
Two alternative models of driver response to silent ACC failures are proposed: a looming
37
prediction model, assuming that drivers embody a generative model of ACC, and a lower gain
38
model, assuming that drivers’ arousal decreases due to monitoring of the automated system. 39
Predictions of BRTs issued by the models were tested using a driving simulator study. 40
41
Results
42
The driving simulator study confirmed the predictions of the models: a) BRTs were 43
significantly shorter with an increase in kinematic criticality, both during driving with CC and 44
ACC; b) BRTs were significantly delayed when driving with ACC compared to driving with 45
CC. However, the predicted BRTs were longer than the ones observed, entailing a fitting of the 46
models to the data from the study. 47
48
Conclusion
49
Both the looming prediction model and the lower gain model predict well the BRTs for the 50
ACC driving condition. However, the looming prediction model has the advantage of being 51
able to predict average BRTs using the exact same parameters as the model fitted to the CC 52
driving data. 53
3
Application
55
Knowledge resulting from this research can be helpful for assessing safety benefits of 56
automated driving. 57
Keywords
58Adaptive Cruise Control; Autonomous driving; Cruise Control; Driver models; Visual looming. 59 60 61 62 63 64 65 66 67 68 69 70 71 72 73 74 75 76 77 78 79
4
1. Introduction
80
Human limitations are widely recognized as a main contributing factor to road crashes 81
(Hendricks et al., 2001; Treat et al., 1979) and the introduction of automated driving is expected 82
to address this issue by automating the driving task (Victor et al., 2017). The degrees of 83
automation for on-road vehicles are classified by the Society of Automotive Engineers (SAE, 84
2018) into different levels, from manual driving up to full driving automation. At the highest 85
levels (4-5), the automated driving system (ADS) should perform the entire dynamic driving 86
task (DDT), without any expectation that a user will respond to a request to intervene. However, 87
at lower levels, the driver is either expected to be receptive to ADS’ request to intervene (level 88
3) or to supervise the driving automation system1 (level 1 and level 2). 89
Existing research has warned about possible human factors issues associated to the supervisory 90
role of the driver, including among others skill degradation (Skottke et al., 2014), complacency 91
(Payre et al., 2016) and negative behavioral adaptations (Jamson et al., 2013; Reimer et al., 92
2016). Given that automated vehicles may fail (Dikmen & Burns, 2016), a relevant question is 93
how drivers will react in those situations. Many previous studies have investigated driver 94
response to takeover requests from the automated vehicle (Gold et al., 2018) and to a lesser 95
extent also driver responses to silent failures, where the automation fails without alerting the 96
driver (Blommer et al., 2017; Strand et al., 2012; Young & Stanton, 2007). 97
Given a detailed enough understanding of drivers’ reaction to automation silent failures, it is 98
possible to develop computational driver models that can be used to assess the safety benefits 99
of driving automation systems (Bärgman et al., 2017; Kusano & Gabler, 2012; McLaughin et 100
al., 2008). To our knowledge, computational driver models describing drivers’ reactions to 101
automation silent failures are lacking, exception made for the model developed by Seppelt & 102
Lee (2015): however, this model is limited in that it only predicts an expected average brake 103
reaction time (BRT) for a given kinematical scenario, not full BRT distributions, and it also 104
does not predict BRTs for manual driving. Therefore, the current paper aims to: 105
1 For a detailed definition of an automated driving system (ADS) and a driving automation system, please refer to the recommended practice SAE J3016 (SAE, 2018)
5 1. Present three computational driver models predicting full probability distributions for 106
BRTs in lead vehicle braking scenarios, across different kinematic conditions, both 107
during driving with Cruise Control (CC) and driving with Adaptive Cruise Control 108
(ACC), when the latter silently fails. 109
2. Show the results from a driving simulator study conducted to test the predictions of the 110
computational driver models. 111
3. Carry out a detailed comparison of the three computational driver models, after fitting 112
them to the driving simulator data. 113
114
2. Models of driver response in manual and automated mode
1152.1 Model
s’
descriptions
116
The classical view of drivers’ reactions to critical traffic events heavily relies on the concept of 117
reaction time (Green 2000; Olson 1989; Olson & Sivak 1986), often considered a property of 118
the individual driver, and potentially influenced by age, expectancy, and other factors (Barrett 119
et al., 1968; Fambro et al., 1998; Green, 2000; Muttart, 2003; Muttart, 2005). However, recent 120
experimental (Ljung Aust et al., 2013) as well as naturalistic (Markkula et al. 2016a; Victor et 121
al. 2015) data suggest that the timing of driver reactions in unexpected emergency situations is 122
to a large extent also determined by the situation kinematics (Engström, 2010). Such kinematics 123
dependence of driver reaction timing has also been experimentally demonstrated in automation 124
take-over situations (Gold et al., 2018). 125
The kinematics of a driving scenario translates into patterns of optical flow as well as perceptual 126
inputs in non-visual modalities, such as kinesthetic and tactile cues (Flach et al., 2004). In rear-127
end scenarios, the kinematics of the lead vehicle is reflected by its optical expansion on the 128
retina of the following driver (looming). For example, the quantity τ – calculated as the optical 129
angle subtended by the lead vehicle, θ, divided by the angular rate of expansion, 𝜃̇ – provides 130
an estimation of time-to-collision (Lee, 1976), as reported below: 131 132 𝜏 =𝜃 𝜃̇ (1) 133 134
6 Several models of driver reactions in rear-end scenarios have been developed based on these 135
ideas (Flach et al., 2004; Markkula, 2014; Markkula et al., 2016; Markkula & Engström, 2017; 136
Engström et al., 2017; Venkatraman et al., 2016; Svärd et al., 2017). More specifically, these 137
models suggest that drivers react after some fixed looming threshold, or after accumulation 138
(integration) of the looming signal to a threshold, potentially also together with other perceptual 139
cues such as brake lights (Markkula, 2014; Engström et al., 2017; Xue et al., 2018). The 140
accumulation of the looming signal was included in the model by Svärd et al. (2017), based on 141
a framework by Markkula (Markkula, 2014; Markkula et al., 2018), but this model also 142
assumed that drivers in emergency rear-end situations react to unexpected looming rather than
143
to looming per se (Engström et al., 2018). The unexpected looming can be understood as the 144
discrepancy between the predicted and actual looming, that is, the looming prediction error. 145
This idea aligns with the broader framework known as predictive processing that has recently 146
become a major force in neuroscience and cognitive science (e.g., Clark, 2013; Clark, 2016; 147
Friston et al., 2010). 148
The accumulative part of the driver reaction model described by Svärd et al. (2017) has the 149 following form: 150 151 𝑑𝐴 𝑑𝑡 = 𝑘𝜀(𝑡) − 𝑚 + 𝜈(𝑡) (2) 152 153
where ε(t) is the looming prediction error, k and m are free model parameters, and braking is 154
initiated once 𝐴 exceeds a threshold, set to one. Variability is included in the model using 𝜈(𝑡), 155
a zero-mean Gaussian noise signal with standard deviation 𝜎√Δ𝑡 for a simulation time step Δ𝑡. 156
The looming prediction error is given by: 157
158
𝜀(𝑡) = 𝜏𝑎−1(𝑡) − 𝜏𝑝−1(𝑡) (3) 159
160
where 𝜏𝑎−1 refers to the actual looming (inverse tau) signal and 𝜏𝑝−1 to the predicted looming. 161
The parameter k in Equation 2 can be interpreted as the gain determining the impact of the 162
7 prediction error on the accumulator while m can be interpreted as the sum of all non-looming 163
evidence for and against the need of braking (Svärd et al., 2017; Markkula, 2014). 164
The models proposed in the current paper directly use the formulation by Svärd et al. (2017) 165
for scenarios where the driver is driving with CC. For scenarios where the driver is driving with 166
ACC and the system has a silent failure, two alternative (but not necessarily mutually exclusive) 167
extensions of the model by Svärd et al. (2017) are proposed: 168
1. Looming prediction model: in this model, it is assumed that the driver continuously 169
predicts the looming that would arise from a properly functioning ACC, in response to 170
a decelerating lead vehicle, and what is being accumulated in the braking decision 171
process are deviations from this prediction. For simplicity, the predictions are here 172
computed assuming that the driver has a perfect mental representation of the ACC 173
working principle, that is, the driver embodies a perfect generative model (Friston et al., 174
2010) of how looming cues are generated by the ACC. 175
2. Lower gain model: in this model, it is assumed that a decrease in driver arousal occurs 176
due to the monitoring of the ACC, sometimes referred to in terms of passive fatigue
177
(Desmond & Hancock, 2001; Greenlee et al., 2018; Saxby et al., 2013). It has been 178
shown that empirically observed effects on response times of increases and decreases in 179
arousal can be well accounted for by increases and decreases in the accumulation gain 180
k in evidence accumulation models (Jepma et al., 2008; Markkula & Engström, 2017; 181
Ratcliff & Van Dongen, 2011). 182
The next section describes the a priori predictions of BRTs obtained from these models. 183
184
2.2. A priori model predictions of BRTs
185
We applied the computational driver models in simulations to make initial predictions about 186
the brake reaction times (BRTs) in rear-end conflicts, during driving with CC – henceforward 187
referred as manual mode – and ACC – henceforth referred as driver assistance mode. The 188
simulations aimed to reproduce a typical highway driving scenario, and the same scenario was 189
also used in the driving simulator study described later. Each simulation started with the 190
modelled driver driving either manually or with engaged ACC, at a speed of 100 km/h and 191
keeping a time headway to the lead vehicle of 2.5 seconds. The lead vehicle, initially travelling 192
at 100 km/h, applied a constant deceleration which was varied, between simulations, in the 2.5 193
8 - 4.5 m/s2 range. During driving with engaged ACC, the system had a silent failure when the 194
lead vehicle started to decelerate. 195
To predict BRTs during driving in manual mode, we implemented a deterministic (𝜎 = 0) 196
looming accumulator model (hereafter named manual drivingmodel),based on Equations 1-3. 197
A key challenge in the parametrization was that the model should represent driver reactions in 198
truly surprising situations with different kinematics. Since each study participant can only be 199
truly surprised in the first exposure of the critical scenario, there exists no single dataset with a 200
sufficient number of driver reaction data points for a range of kinematics. However, there exists 201
a set of published lead vehicle studies that implemented a similar lead vehicle braking scenario 202
with different kinematics, where the first braking event was designed to be truly surprising to 203
the participant. Among these studies, we selected research experiments (Engström et al., 2010; 204
Ljung Aust et al., 2012; Markkula et al., 2013; Markkula et al., 2016; Nilsson et al., 2018) 205
where we had full access to the dataset and where the kinematics (initial speeds, time headway 206
and lead vehicle deceleration rates) differed between the studies. These studies also differed 207
somewhat in other aspects of their methodology and experimental conditions (e.g., vehicle type, 208
type of driving simulator and driver characteristics) but were deemed to be sufficiently similar 209
for the parametrization of the present reaction model. The common lead vehicle (LV) braking 210
scenario used in these studies involved a vehicle overtaking the subject vehicle (SV) and then 211
cutting in front. After the cut-in, the LV continued to accelerate away from the SV before 212
suddenly braking at a predefined time headway with a set deceleration rate. In this way, the 213
kinematics at lead vehicle brake onset could be controlled with a high degree of precision. In 214
two of the studies (Ljung Aust et al., 2013; Nilsson et al., 2018), the LV speed was 215
instantaneously reset (to SV’s speed or a lower value respectively) at LV brake onset. The 216
kinematic parameter values and observed average BRTs are given in Table 1 (for more details, 217
please see the individual publications). 218
Table 1: Scenario parameters and observed BRT values for the driving simulator studies used for the
219 model parametrization 220 Study Number of participants SV type SV instructed initial LV initial speed [km/h] Initial THW [s] LV deceleration [g] Observed average BRT [s]
9 speed [km/h] Engström et al. (2010) 20 Car 70 80 1.5 0.51 2.18 Ljung Aust et al. (2013) 8 Car 90 90 2.5 0.55 3.16 Markkula et al. (2013) 48 Truck 80 80 1.5 0.35 1.82 Nilsson et al., (2018) 10 Car 80 48 1.3 0.6 1.04 Markkula et. al (2016) 46 Truck 90 90 5 0.92 3.32 221
The first braking events for each of the five studies reported in Table 1 were used for the 222
parameterization. Moreover, while some of the studies involved conditions with cognitively 223
loading secondary tasks, only data from the no task (baseline) conditions were used. We 224
implemented the respective scenarios in simulation and searched for the values of the model 225
parameters k and m which best fitted the BRT averages reported in each study in terms of the 226
coefficient of determination, R2 (Field, 2009). It was found that varying m did not make a strong 227
contribution and, with m = 0, the maximum R2 of 0.77 was obtained for k = 2.7. This relatively 228
high R2 value, suggesting that almost 80% of the variance in the observed BRT values is
229
explained by the model, supports the pooling of data from different studies for the present model 230
parameterization. 231
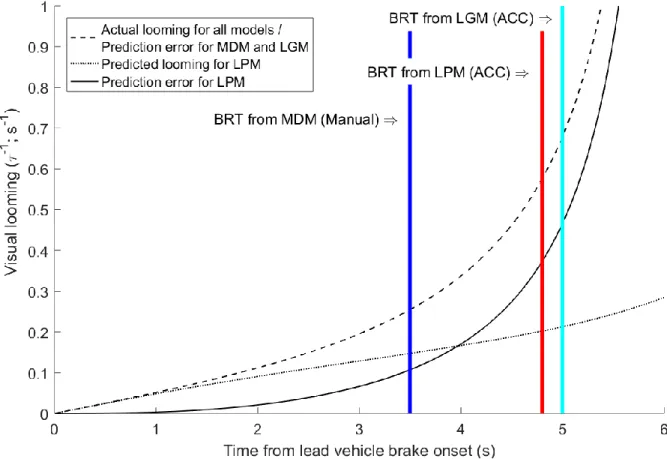
10 In the manual driving model, the driver does not expect any initial looming (𝜏𝑝−1= 0) and, 232
therefore, the looming prediction error equals the actual looming (dashed line in Figure 1) and 233
increases sharply when the lead vehicle decelerates. The corresponding predicted drivers’ 234
braking response is shown as a blue vertical line in Figure 1. 235
For the predictions of BRTs during driving in driver assistance mode, we implemented 236
computational versions of the looming prediction model and the lower gain model described 237
earlier. 238
In the looming prediction model, the values of the model parameters were the same as in the 239
manual driving model (k = 2.7, m = 0 and 𝜎 = 0). However, while 𝜏𝑝−1= 0 (no expected 240
looming) in the manual driving model, in the looming prediction model, 𝜏𝑝−1 was the looming 241
that would have been generated in the scenario, had the ACC braked (dotted line in Figure 1). 242
This model thus sees a smaller looming prediction error (solid line in Figure 1) than the manual 243
driving model, and consequently the driver reacts later (red vertical line in Figure 1). 244
The lower gain model assumes a change in gain k. Here, k = 1.1 was chosen to obtain BRTs 245
roughly comparable to those of the looming prediction model. The remaining parameters (m = 246
0 and 𝜎 = 0) and the calculation of the looming prediction error (Equation 3) were the same as 247
in the manual driving model, that is the driver did not expect any initial looming (𝜏𝑝−1= 0). 248
However, due to the lower gain, also in this model the driver reacts later (magenta vertical line 249
in Figure 1). 250
11 252
Figure 1: Looming profiles and predicted BRTs during manual driving (manual driving model, MDM)
253
and driving with ACC (looming prediction model, LPM; lower gain model, LGM) in response to lead
254
vehicle deceleration equal to 3.5 m/s2. Note: BRT was measured as the time that elapsed between
255
the time of lead vehicle deceleration initiation (t = 0) and the time of first braking reaction of the
256
subject vehicle’s driver 257
258
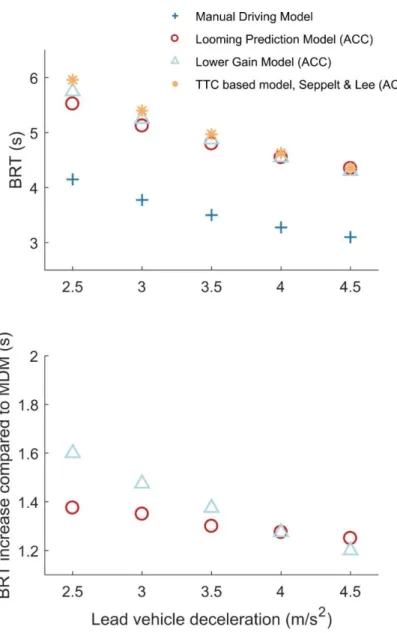
The upper panel of Figure 2 displays the BRTs predicted by the computational models during 259
manual and driver assistance mode for the simulated scenario, across different lead vehicle 260
deceleration levels. For both driving modes, an increase in lead vehicle deceleration produces 261
a shorter predicted brake reaction time. Furthermore, both the looming prediction model and 262
thelower gain model predict longer BRTs in automated mode compared to the predictions of 263
the manual driving model. For comparison, the upper panel of Figure 2 also shows the 264
predictions of the TTC-based (or looming threshold-based) model by Seppelt and Lee (2015), 265
which assumes a fixed brake response time of 1.5 s after the TTC falls to 4 s (and inverse tau 266
reaches 0.25 s-1). This model predicts very similar BRTs as the models for driver assistance 267
mode – especially the lower gain model – but only makes predictions for ACC, not manual 268
driving. 269
12 As shown in the lower panel of Figure 2, the lower gain model predicts a clear interaction effect 270
between lead vehicle deceleration rate and automation mode: the difference in BRT between 271
ACC and manual driving is smaller for increasingly critical lead vehicle decelerations. A 272
similar interaction is discernible for the looming prediction model, but much less markedly so. 273
274
275 276
Figure 2: (top) BRTs predicted by the manual driving model (MDM) and by three models (looming 277
prediction model, lower gain model and TTC-based model) for driving in driver assistance mode, as
278
a function of lead vehicle deceleration rate. (bottom) Difference in BRTs between models for driving
279
in driver assistance mode (looming prediction model and lower gain model) and model for driving in
280
manual mode (manual driving model) as a function of lead vehicle deceleration rate. Note: BRT was
13
measured as the time that elapsed between the time of lead vehicle deceleration initiation and the
282
time of first braking reaction of the subject vehicle’s driver 283
284
3. Driving simulator study
285This section describes the driving simulator study, carried out to test the following predictions 286
from the computational driver models: 287
• The manual driving model and the models fordriver assistance mode predict that BRTs 288
will be shorter for higher lead vehicle decelerations. 289
• The models for driver assistance mode predict longer BRTs compared to the manual 290
driving model. 291
• The lower gain model predicts a clear interaction between automation mode and lead 292
vehicle deceleration level, whereas the looming prediction model does not. 293
The simulator study also served the purpose of providing data for refitting the models and 294
conduct a more detailed model comparison, which will be described in Chapter 4. 295
296
3.1 Materials and methods
297
3.1.1 Participants
298
The recruitment of the final 54 participants was conducted via mailing lists, leaflets, and 299
personal advertising (e.g. social media). To take part in the study, the subjects were required to 300
hold a valid driving license, to have driving experience in Sweden for at least three years, to 301
drive at least three times a week, and to not use ACC in their regular car. The last requirement 302
was introduced to avoid the confounding effects of the experience with ACC on the results of 303
the study. Overall, 44 participants had previous experience with CC and 22 participants had 304
previous experience with ACC but no information was collected about previous experience 305
with other ADAS. 306
During the experiment, five drivers had to be excluded reducing the sample to 49 participants. 307
One participant experienced simulator sickness: the participant needed a longer than usual 308
break after the trial with CC. Although no reason was provided by the participant, the frequent 309
14 decelerations experienced during the drive might have been the factor causing the simulation 310
sickness (Stoner et al., 2011). Besides, three participants experienced technical issues during 311
the drive, due to scenario programming errors. Finally, the remaining excluded participant did 312
not understand the functional principle of CC during the experiment and its data was therefore 313
not used for the analysis. 314
The resulting 49 drivers (12 female and 37 male) were aged between 19 and 63 years (M = 315
41.7; SD = 12.3) and drove about 7.0 times per week (SD = 4.4). Also, they reported to hold a 316
driving license for 23.2 years on average (SD = 12.5) with a life-time mileage of more than 317
30.000 km for 38 participants and between 3.000 km and 30.000 km for 11 participants. 318
319
3.1.2 Apparatus
320
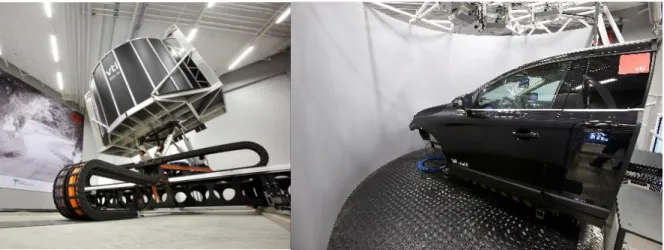
The study was conducted in the SIM IV moving-base, high-fidelity simulator at VTI premises 321
in Gothenburg (Figure 3; Jansson et al., 2014). The simulator included a mock-up of a Volvo 322
XC60 cabin where the left and right-hand side mirrors were replaced with LCD screens, and a 323
forward screen using front projection technique from nine projectors with resolution of 324
1280x960 pixels. The overall field of view was about 180 x 50 degrees. 325
326
327
Figure 3: VTI Sim IV driving simulator (Photo by Hejdlösa bilder)
328 329
The CC and ACC used in this simulator were simplified versions of the systems available on 330
the market. CC always maintained the ‘set speed’ of 100 km/h when activated and did not take 331
15 over longitudinal control in reaction to the lead car braking and acceleration. The driver was 332
not able to change the speed, so that the kinematic conditions of braking events could be 333
controlled. ACC maintained a speed of 100 km/h when activated but it also adjusted the speed 334
of the car dynamically to keep a set time headway of 2.5 s to the lead vehicle. Both systems 335
could be activated by pressing a button on the steering wheel and deactivated by pressing the 336
button again, by braking or by using the throttle. Since the participants were not able to change 337
the settings of the systems (speed for CC and speed and time headway for ACC), there was no 338
specific information shown on the main display of the vehicle. 339
340
3.1.3 Procedure and experimental design
341
The study was conducted in October 2017 and took about 1.5 hours for each participant to 342
complete. Before starting, the participants were informed about the purpose (evaluation of 343
driver assistance systems) and the general procedure of the experiment but no details were 344
provided about the ACC failure. After the introduction, the participants gave informed consent 345
to participate. 346
The participants were then introduced to the simulator and were instructed about the main 347
controls to drive the vehicle (e.g. steering wheel, gearshift, pedals). Additionally, they were 348
provided with customized written manuals for either the CC or ACC before starting the drive 349
with the respective system. Once they completed the study, the participants were requested to 350
fill in a questionnaire, including queries about demographic information (e.g. age), driving 351
experience (e.g. weekly mileage driven) and systems’ performance during the study (e.g. ACC 352
failure). Afterwards, they were rewarded with two cinema tickets, of which the monetary value 353
was approximately equivalent to 25 euros. The choice of the cinema tickets was guided by 354
previous driving simulator studies conducted at VTI, where the same compensation was 355
provided to the participants. 356
The driving part was divided into two drives of about 25 minutes each, the first one dedicated 357
to the use of CC and the second one dedicated to the use of ACC. The choice of a within-subject 358
design was mainly driven by the need to have enough participants for the analysis and the 359
modelling of BRTs. Besides, the order of the drives was not counterbalanced among the 360
participants to ensure that the failure situations experienced with ACC would not affect the 361
driving behavior during the drive with CC (where drivers always had to respond themselves to 362
16 lead vehicle deceleration). In the first drive, the participants started with a guided simulator 363
training to get familiar with the behavior of the simulator. After that, the participants received 364
a guided training for CC and, then, the driving task with CC started. In the second drive, the 365
participants received a guided training for ACC, followed by the driving task with ACC. 366
Between the drives with CC and ACC the participants left the simulator for a short break and 367
instructions for the second drive. 368
In both drives, the participants followed a white van on a 2+1 Swedish road. These roads are 369
three-lane highways, consisting of two lanes in one direction, and one lane in the other, 370
alternating every few kilometers and usually separated by a steel-cable barrier. The two-lane 371
segments allow for overtaking without the risk of oncoming vehicles. Driving sections could 372
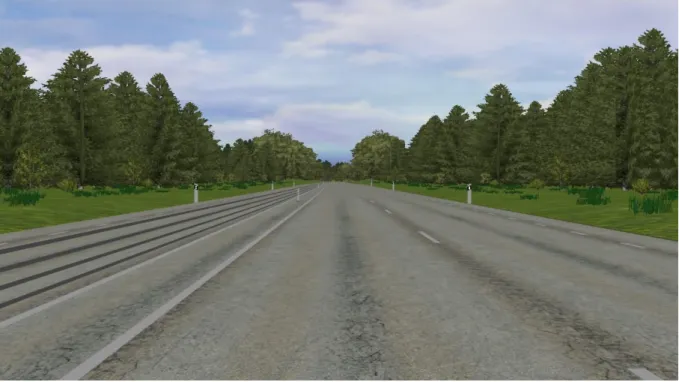
contain either one or two lanes whose widths were set at 3.25 m (Figure 4). The participants 373
were instructed to stay in the right lane and follow the lead vehicle without overtaking it. 374
Furthermore, participants were instructed to always use the respective driver assistance systems 375
and to reactivate it as soon and as safely as possible, in case of deactivation. 376
377
378
Figure 4: Simulated scenario showing the 2+1 Swedish road
379 380
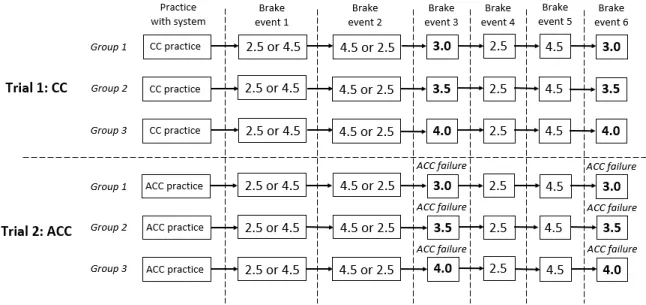
17 During each drive with CC and ACC, the participants encountered six events with different 381
lead vehicle decelerations (Figure 5): the participants drove for about 2.5 minutes – depending 382
on the travelling speed – between each event. The deceleration of the lead vehicle was triggered 383
on road sections where there was only one lane in the driving direction and physical barrier on 384
the left side, to promote avoidance by braking rather than steering. The presence of a reduction 385
in the number of lanes (from 2 to 1) was always associated to the lead vehicle deceleration but 386
the exact location of the lead vehicle braking within the one-lane section was randomized to 387
prevent participants to anticipate the exact timing of the lead car braking. 388
The participants were divided in three groups and the lead vehicle deceleration in both drives 389
differed among the groups in the third and sixth braking events. For the remaining events, the 390
lead vehicle deceleration in both drives was the same for all participants. During the ACC drive, 391
failures occurred in the third and sixth braking events: in those situations, the ACC did not react 392
to the lead car braking and the subject vehicle proceeded with speed of 100 km/h unless the 393
driver deactivated the system. 394
395
396
Figure 5: Experimental design. In the figure, the numbers indicate the different levels of lead vehicle
397
decelerations from 2.5 m/s2 to 4.5 m/s2. For the first and second events, the levels of decelerations
398
2.5 m/s2 and 4.5 m/s2 were counterbalanced between the participants but all participants
399
experienced both. For the third and sixth events, the participants experienced different lead vehicle
400
decelerations (3.0 m/s2, 3.5 m/s2 or 4.0 m/s2) according to the group they belonged to. Also, for the
401
drive with ACC, the failures of the systems occurred in the third and sixth events.
18 403
3.1.5 Data processing
404
The analyses assessed the BRTs for the six braking events with both systems. However, for 405
ACC driving, the focus was on the failure events since we did not expect drivers to brake when 406
ACC was properly functioning. The data were extracted with MATLAB (version 2016b) and 407
the statistical analyses and plotting were performed with R (version 3.4.3). 408
409
3.2 Results
410
The results report the analysis of BRTs during driving with CC and ACC (section 3.2.1) and 411
the analysis of the subjective data, encompassing the answers to the queries about systems’ 412
performance during the driving simulator study (section 3.2.2). 413
3.2.1 BRTs
414
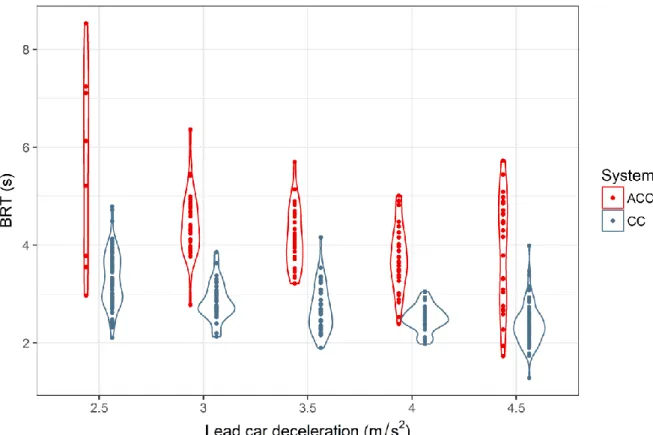
Figure 6 shows BRTs as a function of driving mode and kinematic criticality: the BRTs during 415
ACC driving have more variability compared to CC driving. 416
19 418
Figure 6. BRTs as a function of driving mode (CC in blue vs. ACC in red) and lead vehicle deceleration.
419
All participants experienced lead vehicle decelerations corresponding to 2.5 m/s2 and 4.5 m/s2,
420
whereas any given participant only experienced one of the three intermediate deceleration levels
421
(3.0 m/s2, 3.5 m/s2 and 4.0 m/s2), at which also ACC failures occurred. The ACC worked properly for
422
lead vehicle decelerations of 2.5 m/s2 and 4.5 m/s2 but nevertheless some drivers braked, and their
423
BRTs are reported in the figure.
424 425
Figure 7 reports the four linear regressions models fitted to the data – one for each system-426
repetition combination – and shows a clear trend for BRTs becoming longer when the kinematic 427
criticality decreases. 428
20 430
Figure 7. Four linear regression models fitted to the BRTs as a function of system (CC and ACC) and
431
repetition (first vs. second) using the three level of kinematic criticality which were varied between
432
subjects. Points shifted horizontally for readability. Regression line with 95 % CI.
433 434
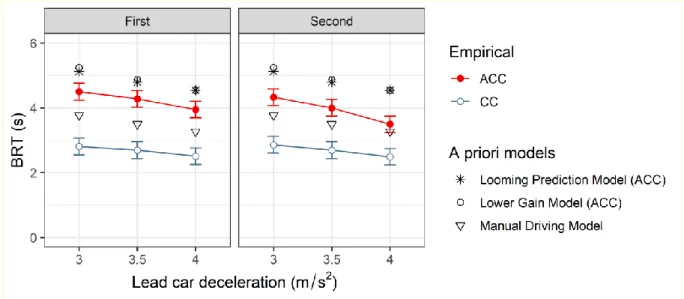
The effect of variations in driving mode and kinematic criticality and the effect of repetition on 435
BRTs were tested with repeated measures ANOVA, using the data from the third and sixth 436
braking events (Figure 8). The kinematic criticality (3.0, 3.5, and 4.0 m/s2) was a between-437
subjects factor, and the system (CC or ACC) and repetition (the first and the second failure 438
situation) were within-subjects factors. All significant (p < .05) effects are reported. 439
Situations with lower kinematic criticality had longer BRTs, F(1,46) = 9.58, p < .01, ηp2 = 0.29 440
and polynomial contrasts indicated a linear trend. BRTs were longer when driving with ACC 441
compared to CC, F(1,46) = 329.53, p < .01, ηp2 = 0.88. Specifically, the interaction of 442
kinematic criticality and system was not significant, F(2,46) = 1.81, p = .17, providing tentative 443
support for the looming prediction model over the lower gain model; it should be noted however 444
that the observed interaction was nevertheless in the direction predicted by the latter model. 445
The interaction between repetition and system was significant, F(1,46) = 5.81, p = .02, ηp2 = 446
0.11; with ACC, BRTs were longer in the first failure compared to the second one (p < .01), 447
21 but with CC there was no significant difference. This suggests that, after the first failure, drivers 448
already expected that ACC may not function and were more prepared to intervene. 449
Figure 8 also reports the a priori average BRT predictions of the computational models 450
described in Section 2.2, together with the empirical data from the driving simulator study. The 451
a priori computational models, while reproducing a similar overall pattern of results, do not 452
accurately predict the absolute BRTs from the driving simulator study. 453
454
455
Figure 8. BRTs obtained from the driving simulator study (empirical) and predicted by the a priori
456
computational models (a priori models) as a function of kinematic criticality (lead vehicle
457
deceleration values from 3.0 m/s2 to 4.0 m/s2), system (CC or ACC), and repetition (first vs. second).
458
For empirical data, Least Squares Means with 95% CIs based on the repeated measures ANOVA (see
459 3.2.) are shown. 460 461
3.2.2 Subjective data
462In the questionnaire filled in at the end of the driving simulator study, the participants were 463
required to provide an answer to the following query, regarding the performance of ACC: 464
“What was the first thing that alarmed you that there was a failure?” Most of the drivers (27 465
participants, 55.1% of the sample) realized that a failure occurred because the ACC did not 466
handle the situation as they expected, through appropriate initiation of braking. For example, 467
the participants wrote “I didn't feel or hear the car decelerate, when I experienced it decelerate 468
22 before or where I would have chosen to start the process of decelerating” or “The distance 469
became shorter and the car didn't decelerate” or “The system tried to brake, but my reaction 470
was that the braking distance was too short.” Besides, 12 participants (24.5% of the sample) 471
recognized the failure because the distance to the lead vehicle decreased more than they would 472
have expected, as stated in these replies: “I was too close to the car in front” or “The car in front 473
of me got closer too quickly” or “I approached the vehicle in front of me too fast.” Finally, the 474
remaining participants did not notice a failure of the system (9 participants, 18,4% of the 475
sample) or identified a system failure different from the one simulated during the experiment 476
(1 participant, 2,0% of the sample). 477
Overall, the subjective data seem to provide support for the looming prediction model since 478
most of the drivers (55.1% of the sample) had expectations about the ACC deceleration or about 479
the ACC functionality to maintain a minimum distance to the lead vehicle, during the 480
emergency rear-end situations. 481
482
4. Fitting and comparison of the computational driver models
483
As reported in section 3.2.1, the a priori computational models do not accurately predict the 484
absolute BRTs from the driving simulator study. To yield better predictions of BRTs, and to 485
allow a detailed model comparison, the models were fitted to the driving simulator data. First, 486
the manual driving model was fitted to the data from driving with CC. Predictions for the ACC 487
condition could then be directly generated for the looming prediction model, retaining all the 488
parameters from the manual driving model fitted to the CC data. For the lower gain model 489
instead, the k parameter was refitted to the ACC data, while keeping the other parameters fixed 490
as in the manual driving model fitted to the CC data. Since a significant interaction effect 491
between repetition and system was found from the analyses of the driving simulator study, the 492
models were fitted only to the data from the first lead vehicle deceleration event per participant. 493
Also, only the scenarios in the range 3.0 – 4.0 m/s2 were considered for the fitting given that 494
ACC failures occurred for those lead vehicle decelerations. Table 2 reports the values of the 495
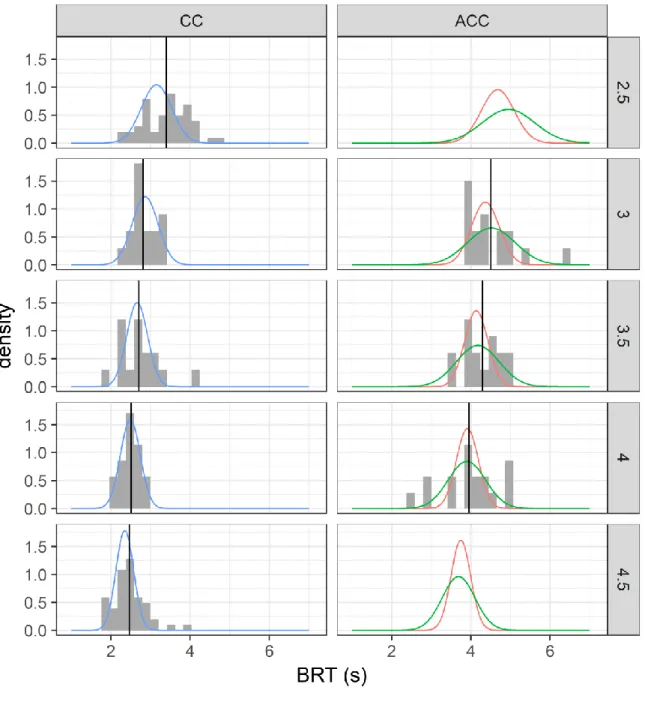
parameters for the models fitted to the driving simulator data. In addition, Figure 9 shows the 496
distribution of BRTs predictions yielded by the three fitted models and the BRTs from the 497
driving simulator study, in the first repetition. 498
23
Table 2: Values of the parameters for the models fitted to the driving simulator data. The values in
500
bold are free model parameters while the other values are fixed model parameters
501
Model Values of model parameters
K m 𝜎
Manual driving model (CC) 4.8 0.025 0.16
Looming prediction model (ACC) 4.8 0.025 0.16
Lower gain model (ACC) 1.6 0.025 0.16
24 503
Figure 9: Distribution (histograms) and average values (vertical lines) of BRTs from the driving
504
simulator study and distributions of BRTs predicted by the fitted computational models (curves) as
505
a function of kinematic criticality (deceleration values from 2.5 to 4.5 m/s2) and system (CC or ACC).
506
For the driving simulator data, only the first three events (the first encounter of each kinematic
507
criticality) were included in the figure. Besides, the distributions of BRTs from the driving simulator
25
study are not reported for deceleration values of 2.5 and 4.5 m/s2 during driving with ACC, due to
509
the small number of drivers braking.
510 511
Overall, it can be observed that: 1) the fitted manual driving model predicts relatively well the 512
BRT distributions during driving with CC, both in terms of average BRT and variability; 2) 513
both the fitted looming prediction model and the lower gain model predict relatively well the 514
average BRTs during driving with ACC, but both models, and especially the looming prediction 515
model, predict somewhat lower BRT variabilities than observed. From a comparison of the two 516
models by the Akaike Information Criterion (AIC; Akaike, 1973), the lower gain model had a 517
notable lower AIC (260.39) than the looming prediction model (266.40). Overall, the lower 518
gain model appears to predict better the increased variability of BRTs with ACC, and it had 519
also a lower AIC.; however, the lower gain model introduces an additional free parameter, 520
compared to the looming prediction model, and predicts a clear interaction effect between 521
kinematic criticality and automation mode, which was not confirmed by the driving simulator 522 data. 523 524
5. Discussion
525This paper presented novel kinematics-dependent computational driver models to predict BRTs 526
in rear-end critical scenarios during driving manually (manual driving model) and with ACC 527
(looming prediction model and lower gain model). The computational models were developed 528
as instances of the model described by Svärd et al. (2017) and assumed that drivers respond to 529
visual looming,reflecting the kinematics of the situation. Compared to previous models based 530
on visual looming (Flach et al., 2004; Markkula, 2014; Markkula et al., 2016; Markkula & 531
Engström, 2017; Engström et al., 2017; Venkatraman et al., 2016), the computational models 532
described in this paper assume that, in emergency rear-end situations, drivers react to 533
unexpected looming rather than to looming per se (Engström et al., 2018). Furthermore, our 534
computational models broaden previous work by providing a description of drivers’ responses 535
not only during manual driving, but also during driving with ACC when the latter fails. 536
The predictions of the computational models yielded shorter BRTs with increase of kinematic 537
criticality for all models and a delay in BRTs during driving with ACC compared to driving 538
26 manually. In the models, this delay originated from a slower accumulation of looming 539
prediction error either due to drivers’ expectations of ACC braking (looming prediction model), 540
in line with the framework of predictive processing (e.g., Clark, 2013; Clark, 2016; Friston et 541
al., 2010; Engström et al., 2018), or due to lower arousal (lower gain model) caused by 542
monitoring of the ACC system, inducing passive fatigue (Desmond & Hancock, 2001; Greenlee 543
et al., 2018; Saxby et al., 2013; see also Markkula and Engström, 2017). 544
A driving simulator study was conducted to test the predictions of the computational driver 545
models: 49 participants drove with CC and ACC and experienced six critical events where the 546
lead vehicle braked with different levels of decelerations. In two of the six events, the ACC 547
failed and, therefore, the drivers were expected to take back control from the system. The results 548
of the driving simulator study confirmed the predictions of the computational driver models: 549
• The BRTs significantly decrease with higher levels of kinematic criticality, both during 550
driving with CC and ACC. This outcome is in line with previous research (Markkula, 551
2014; Markkula et al., 2016; Markkula & Engström, 2017; Engström et al., 2017; 552
Venkatraman et al., 2016) but shows for the first time this phenomenon in silent failures 553
of automation. 554
• The BRTs are significantly longer during driving with ACC compared to driving with 555
CC. However, the a priori models’ BRTs predictions were longer than the ones observed 556
in the driving simulator study, with this difference ranging between 0.7 and 0.9 seconds. 557
This difference could possibly be explained by the fact that the previous experiments 558
used to parameterize the manual driving model (Engström et al., 2010; Ljung Aust et 559
al., 2012; Markkula et al., 2013; Markkula et al., 2016; Nilsson et al., 2018) had different 560
driving conditions. Most notably, these past studies only considered BRTs for 561
unexpected lead vehicle events, whereas the present driving simulator study had 562
repeated scenario exposures, for which response times are known to be reduced (Lee et 563
al., 2002; Ljung Aust et al., 2013). Also, in past studies, the critical scenario was 564
different (lead vehicle braking after cutting in), the manual driving was performed 565
without CC, and the considered lead vehicle decelerations were also higher compared 566
to the current driving simulator study. 567
The subjective data collected after the rides in the driving simulator suggest that most of the 568
drivers reacted, during the emergency rear-end situations, due to a mismatch between the 569
expected and the perceived visual cues, when the silent failure of ACC occurred: the drivers 570
27 expected the ACC to brake and/or maintain a constant time headway (referred as ‘distance’ by 571
the participants) to the lead vehicle but the visual cues perceived from the environment revealed 572
to the drivers that “The distance became shorter and the car didn't decelerate.” This outcome 573
might provide support for the looming prediction model since the drivers seemed to embody a 574
generative model of ACC working principle, although probably still a basic one considered the 575
short experience in driving with the system. Besides, it underlines the importance of appropriate 576
drivers’ prediction/expectation about the actions (e.g. braking or steering) undertaken by 577
automated driving systems or driving automation systems (Engström et al., 2018; Victor et al., 578
2018). 579
The models were directly fitted to the data from the driving simulator study and were found to 580
capture relatively well the observed BRT distributions. According to the AIC model 581
comparison, the lower gain model was preferable to the looming prediction model, seemingly 582
mainly due to the latter model predicting too low BRT variabilities. However, this should not 583
be taken as strong evidence that the underlying cause for the BRT delay in ACC driving was 584
reduced arousal in this study. Driver arousal was not experimentally measured during the 585
driving simulator study, and the re-fitting of the gain parameter does introduce additional model 586
flexibility. In comparison, arguably a more striking finding was that the looming prediction 587
model was able to predict the average BRTs directly from the manual driving model fitted to 588
the CC data, without any re-fitting of parameters. If nothing else, this property of the looming 589
prediction model may be considered an applied advantage. It should be noted that, in our 590
tests, the looming prediction model was also potentially disadvantaged to some extent by 591
the assumption that the driver has a perfect generative model of the looming profile generated 592
by ACC. Indeed, variability in drivers' looming prediction accuracy could help explain the 593
larger BRT variability in the observed data, compared to the looming prediction model's BRTs. 594
As mentioned, the subjective responses from the participants also aligned well with the looming 595
prediction model. It is also worth noting that – although we described two different models, 596
testing distinct explanatory mechanisms – the two models are not mutually exclusive and may 597
be combined in future studies. 598
Overall, the present study provided new insights into driver braking reactions in rear-end 599
critical situations originated by automation failures. The key novel contribution of the present 600
paper is the proposal of two computational driver models, parametrized based on driving 601
simulator data, which were both found to be capable of accounting for the delay in drivers’ 602
28 responses to silent ACC failures, compared to driving with CC. These models can then be 603
applied in computer simulations aiming to assess the safety benefits of active safety systems or 604
automated driving (Bärgman et al., 2017; Kusano & Gabler, 2012; McLaughin et al., 2008). 605
The current study has some limitations. Due to the experimental settings and repeated braking 606
events always occurring at the one-lane section of the road, the participants may have had 607
increased expectancy for lead vehicle braking on these road sections. In addition, all the 608
participants had experienced the CC drive with critical braking events before ACC failures, 609
likely priming the drivers for such events. Due to these limitations, the models might 610
underestimate the delay in response during driving with ACC compared to driving with CC. 611
Besides, during the driving simulator study, the participants were prevented from avoiding the 612
lead vehicle through steering, by the physical barrier on the left side. Therefore, the models 613
presented in this paper consider only braking – and not steering – as possible drivers’ avoidance 614
maneuver to the lead vehicle braking. Also, the exposure to driving with ACC in the driving 615
simulator was very brief before experiencing the silent failure of the system: such a short time 616
might have not been sufficient to induce a decrease of arousal in the participants. Hence, 617
additional studies – not least naturalistic driving studies – are needed to further test the lower 618
gain model, as well as thelooming prediction model, in situations where drivers are exposed to 619
a failure after long-term use of the system. Furthermore, the models assessing BRTs to rear-620
end critical scenarios during driver assistance mode are solely valid for situations in which 621
there is a silent failure of the system. Future work should address how drivers would react in 622
the same scenario when a warning (e.g. auditory HMI warning) is provided, to inform the 623
drivers about a performance-relevant system failure. Finally, the models assessing BRTs to 624
rear-end critical scenarios during driver assistance mode did not include kinesthetic cues (e.g. 625
ACC deceleration). Morando et al. (2016) and Fancher et al. (1998) showed that drivers 626
perceive the longitudinal deceleration of ACC in emergency rear-end situations as a cue to 627
direct their gaze towards the forward roadway. Future models describing BRTs in unexpected 628
emergency rear-end situations – originated by functional limitations of ADS (level 3) or driving 629
automation systems (level 1 and level 2) – should incorporate kinesthetic cues, especially in 630
situations where drivers are not looking ahead and might miss visual cues associated to the lead 631
vehicle deceleration. 632
29
Key points
634
• Three computational driver models were described and applied in simulations to predict 635
BRTs in rear-end critical scenarios, induced by different levels of lead vehicle 636
deceleration: one manual driving model to predict BRTs during manual driving (or 637
during driving with CC) and one looming prediction model and one lower gain model
638
to predict BRTs during driving with ACC. The looming prediction model assumes that 639
drivers embody a generative model of ACC while the lower gain model assumes that 640
drivers’ arousal decreases due to monitoring of the automated system. 641
• A driving simulator study was conducted with 49 participants to test the predictions of 642
BRTs issued by the three computational driver models. The study confirmed the 643
predictions of the models: BRTs were significantly shorter with an increase in kinematic 644
criticality, both during driving with CC and ACC and BRTs were significantly delayed 645
when driving with ACC compared to driving with CC. However, the predicted BRTs 646
were longer than the ones observed in the study and, for this reason, a fitting of the 647
models to the data from the driving simulator study was performed. 648
• Both the fitted looming prediction model and the lower gain model predicted well the 649
BRTs obtained from the driving simulator study in the chosen range of lead vehicle 650
decelerations. Although the lower gain model performs better based on the Akaike 651
Information Criterion (AIC), the looming prediction model has the advantage of being 652
able to predict the average BRTs, directly using parameters of the model fitted to the 653
CC driving data.
654
• The models resulting from this study can have application in computer simulations 655
aiming to assess the safety benefits of active safety systems or automated driving. 656
657
Acknowledgments
658
The authors are grateful to Vinnova – Swedish governmental agency for innovation – for 659
providing funding to this research as part of the project Quantitative Driver Behaviour 660
Modelling for Active Safety Assessment Expansion (QUADRAE). We would also like to thank 661
Bruno Augusto, Frida Reichenberg and Laura Wörns for the assistance during the data 662
30 collection, and all the colleagues who joined the interesting discussions within the project. This 663
work has been carried out at SAFER - Vehicle and Traffic Safety Centre at Chalmers, Sweden. 664
665
References
666
Akaike, H. (1973). Information theory as an extension of the maximum likelihood principle. 667
In: Petrov, B.N., Csaki, F. (Eds.), 2nd International Symposium on Information Theory. 668
Budapest, pp. 267–281. 669
Barrett, G. V. (1968). Feasibility of studying driver reaction to sudden pedestrian emergencies 670
in an automobile simulator. Human Factors, 10(1), 19-26. 671
Bärgman, J., Boda, C. N., & Dozza, M. (2017). Counterfactual simulations applied to SHRP2 672
crashes: The effect of driver behavior models on safety benefit estimations of intelligent 673
safety systems. Accident Analysis & Prevention, 102, 165-180. 674
Blommer, M., Curry, R., Swaminathan, R., Tijerina, L., Talamonti, W., & Kochhar, D. (2017). 675
Driver brake vs. steer response to sudden forward collision scenario in manual and 676
automated driving modes. Transportation research part F, 45, 93-101. 677
Clark, A. (2013). Whatever Next? Predictive Brains, Situated Agents, and the Future of 678
Cognitive Science. Behavioral and Brain Sciences, 36(3): 181–204. 679
Clark, A. (2016). Surfing Uncertainty. Oxford: Oxford University Press. 680
Desmond, P. A., & Hancock, P. A. (2001). Active and passive fatigue states. In P. A. Hancock 681
& P. A. Desmond (Eds.), Human factors in transportation. Stress, workload, and
682
fatigue (pp. 455-465). Mahwah, NJ, US: Lawrence Erlbaum Associates Publishers. 683
Dikmen, M., & Burns, C. M. (2016). Autonomous Driving in the Real World: Experiences with 684
Tesla Autopilot and Summon. In Proceedings of the 8th International Conference on
685
Automotive User Interfaces and Interactive Vehicular Applications. Ann Arbor, Michigan, 686
USA, October 24-26, 2016. 687
Engström, J. (2010). Scenario criticality determines the effects of working memory load on 688
brake response time. In J. Krems, T. Petzoldt, & M. Henning (Eds.), Proceedings of the
31
EuropeanConference on Human Centred Design for Intelligent TransportSystems (pp. 25– 690
36). Lyon, France: HUMANIST. 691
Engström, J., Ljung Aust, M., & Viström, M. (2010). Effects of working memory load and 692
repeated scenario exposure on emergency braking performance. Human Factors, 52, 551– 693
559. 694
Engström, J., Markkula, G., & Merat, N. (2017). Modeling the effect of cognitive load on driver 695
reactions to a braking lead vehicle: A computational account of the cognitive control 696
hypothesis. Paper presented at the 5th International Conference of Driver Distraction and
697
Inattention. Paris, France, March 20-22, 2017. 698
Engström, J., Bärgman, J., Nilsson, D., Seppelt, B., Markkula, G., Bianchi Piccinini, G. F., & 699
Victor, T. (2018). Great expectations: A predictive processing account of automobile 700
driving. Theoretical Issues in Ergonomics Science, 19(2), 156-194. 701
Fambro, D., Koppa, R., Picha, D., & Fitzpatrick, K. (1998). Driver perception-brake response 702
in stopping sight distance situations. Transportation Research Record: Journal of the
703
Transportation Research Board, (1628), 1-7. 704
Fancher, P., Ervin, R., Sayer, J., Hagan, M., Bogard, S., Bareket, Z., Haugen, J., (1998). 705
Intelligent cruise control field operational test. Final report (DOT HS 808 849). 706
Field, A. 2009. Discovering statistics using SPSS. SAGE Publication. 707
Flach, J. M., Smith, M. R., Stanard, T., & Dittman, S. M. (2004). Collisions: Getting them under 708
control. Advances in psychology, 135, 67-91. 709
Friston, K. J. (2010). The Free-energy Principle: A Unified Brain Theory? Nature Reviews
710
Neuroscience, 11(2): 127–138. 711
Gold, C., Happee, R., & Bengler, K. (2018). Modeling take-over performance in level 3 712
conditionally automated vehicles. Accident Analysis & Prevention, 116, 3-13. 713
Green, M. (2000). How long does it take to stop? Methodological analysis of driver perception-714
brake times. Transportation Human Factors, 2(3), 195–216. 715
Greenlee, E. T., DeLucia, P. R., & Newton, D. C. (2018). Driver vigilance in automated 716
vehicles: hazard detection failures are a matter of time. Human factors, 60(4), 465-476 717
32 Hendricks, D. L., Fell, J. C., & Freedman, M. (2001). The relative frequency of unsafe driving
718
acts in serious traffic crashes. Final Report of the National Highway Traffic Safety 719
Administration. 720
Jamson, A. H., Merat, N., Carsten, O. M., & Lai, F. C. (2013). Behavioural changes in drivers 721
experiencing highly-automated vehicle control in varying traffic conditions. Transportation
722
research part C: emerging technologies, 30, 116-125. 723
Jansson, J., Sandin J., Augusto, B., Fischer, M., Blissing, B., & Källgren, L. (2014). Design and 724
performance of the VTI SIM IV. In Proceedings of the 2014 Driving Simulation
725
Conference. Paris, France, September 4-5, 2014. 726
Jepma, M., Wagenmakers, E., Band, G. P. H., & Nieuwenhuis, S. (2008). The Effects of 727
Accessory Stimuli on Information Processing : Evidence from Electrophysiology and a 728
Diffusion Model Analysis. Journal of Cognitive Neuroscience, 21(5), 847–864. 729
Kusano, K. D., & Gabler, H. C. (2012). Safety benefits of forward collision warning, brake 730
assist, and autonomous braking systems in rear-end collisions. IEEE Transactions on
731
Intelligent Transportation Systems, 13(4), 1546-1555. 732
Lee, D.N. (1976). A theory of visual control of braking based on information about time-to-733
collision. Perception, 5, 437–459. 734
Lee, J. D., McGehee, D. V, Brown, T. L., & Reyes, M. L. (2002). Collision warning timing, 735
driver distraction, and driver response to imminent rear-end collisions in a high-fidelity 736
driving simulator. Human Factors: The Journal of the Human Factors and Ergonomics
737
Society, 44(2), 314–335. 738
Ljung Aust, M., Engström, J., & Viström, M. (2013). Effects of forward collision warning and 739
repeated event exposure on emergency braking. Transportation Research Part F, 18, 34– 740
46. 741
Markkula, G., Benderius, O., Wolff, K., Wahde, M. (2013). Effects of experience and electronic 742
stability control on low friction collision avoidance in a truck driving simulator. Accident
743
Analysis and Prevention, 50, 1266–1277. 744
Markkula, G. (2014). Modeling driver control behavior in both routine and near-accident 745
driving. In Proceedings of the 58th Annual Meeting of Human Factors and Ergonomics 746
Society. Chicago, Illinois, USA, October 27–31, 2014 747
33 Markkula, G., Engström, J., Lodin, J., Bärgman, J., & Victor, T. (2016a). A Farewell to Brake 748
Reaction Times? Kinematics-dependent Brake Response in Naturalistic Rear-end 749
Emergencies. Accident Analysis and Prevention, 95, 209–226. 750
Markkula, G., Lodin, J., & Wells, P. (2016b). The many factors affecting near-collision driver 751
response: A simulator study and a computational model. Unpublished manuscript. 752
Markkula, G., & Engström. J. (2017). Simulating effects of arousal on lane keeping: Are 753
drowsiness and cognitive load opposite ends of a single spectrum? Abstract presented at the 754
10th International Conference on Managing Fatigue. San Diego, CA, March 20-23, 2017. 755
Markkula, G., Boer, E., Romano, R., & Merat, N. (2018). Sustained sensorimotor control as 756
intermittent decisions about prediction errors: Computational framework and application to 757
ground vehicle steering. Biological cybernetics, 112(3), 181-207. 758
McLaughlin, S. B., Hankey, J. M., & Dingus, T. A. (2008). A method for evaluating collision 759
avoidance systems using naturalistic driving data. Accident Analysis & Prevention, 40(1), 760
8-16. 761
Morando, A., Victor, T., & Dozza, M. (2016). Drivers anticipate lead-vehicle conflicts during 762
automated longitudinal control: sensory cues capture driver attention and promote 763
appropriate and timely responses. Accident Analysis & Prevention, 97, 206-219. 764
Muttart, J. W. (2003). Development and evaluation of driver response time predictors based
765
upon meta analysis. SAE Technical Paper 2003-01-0885. 766
Muttart, J. W. (2005). Quantifying driver response times based upon research and real life data. 767
Proceedings of the Third International Driving Symposium on Human Factors in Driver
768
Assessment, Training and Vehicle Design, pp. 9-17 769
Nilsson, E., Ljung Aust, M., Engström, J., Svanberg, B., Lindén, P., Walletun, L., & Victor, T. 770
(2017). The effects of cognitive load on response time in unexpected lead vehicle braking 771
scenarios and the Detection Response Task (DRT). Unpublished manuscript. 772
Olson, P. L., & Sivak, M. (1986). Perception-response time to unexpected roadway hazards. 773
Human Factors, 28(1), 91–96. 774
Olson, P. L. (1989). Driver Perception Response Time. Society of Automotive Engineers, 775
Technical Report 890731. 776
34 Payre, W., Cestac, J., & Delhomme, P. (2016). Fully automated driving: impact of trust and 777
practice on manual control recovery. Human factors, 58(2), 229-241. 778
Ratcliff, R., & Van Dongen, H. P. A. (2011). Diffusion model for one-choice reaction-time 779
tasks and the cognitive effects of sleep deprivation. Proceedings of the National Academy
780
of Sciences, 108(27), 11285–11290. 781
Reimer, B., Pettinato, A., Fridman, L., Lee, J., Mehler, B., Seppelt, B., et al. (2016). Behavioral 782
Impact of Drivers' Roles in Automated Driving. In Proceedings of the 8th International
783
Conference on Automotive User Interfaces and Interactive Vehicular Applications. Ann 784
Arbor, Michigan, USA, October 24-26, 2016. 785
SAE (2018). Taxonomy and Definitions for Terms Related to Driving Automation Systems for 786
On-Road Motor Vehicles. Standard J3016, Revised version, June 2018. 787
Saxby, D. J., Matthews, G., Warm, J. S., Hitchcock, E. M., & Neubauer, C. (2013). Active and 788
passive fatigue in simulated driving: Discriminating styles of workload regulation and their 789
safety impacts. Journal of experimental psychology: applied, 19(4), 287. 790
Seppelt, B. D., & Lee, J. D. (2015). Modeling driver response to imperfect vehicle control 791
automation. Procedia Manufacturing, 3, 2621-2628. 792
Skottke, E. M., Debus, G., Wang, L., & Huestegge, L. (2014). Carryover effects of highly 793
automated convoy driving on subsequent manual driving performance. Human Factors, 794
56(7), 1272-1283. 795
Stoner, H. A., Fisher, D. L., & Mollenhauer, M. (2011). Simulator and scenario factors
796
influencing simulator sickness. In Handbook of Driving Simulation for Engineering, 797
Medicine and Psychology. CRC Press, Boca Raton, United States. 798
Strand, N., Nilsson, J., Karlsson, I. M., & Nilsson, L. (2014). Semi-automated versus highly 799
automated driving in critical situations caused by automation failures. Transportation
800
research part F, 27, 218-228. 801
Svärd, M., Markkula, G., Engström, J., Granum, F., & Bärgman, J. (2017). A quantitative driver 802
model of pre-crash brake onset and control. In Proceedings of the 61st Human Factors and
803
Ergonomics Society Annual Meeting. Austin, Texas, US, October 9-13, 2017. 804
Treat et al. (1979). Tri-level study of the causes of traffic accidents. executive summary. No. 805
DOTHS034353579TAC Final Report. 806
![Table 1: Scenario parameters and observed BRT values for the driving simulator studies used for the 219 model parametrization 220 Study Number of participants SV type SV instructed initial LV initial speed [km/h] Initial THW [s] LV decelerat](https://thumb-us.123doks.com/thumbv2/123dok_us/797096.2600768/8.892.73.811.1018.1136/scenario-parameters-observed-simulator-parametrization-participants-instructed-decelerat.webp)