Smart Metering and Its Use for
Distribution Network Control
Alasdair H. Burchill
School of Engineering
Cardiff University
Thesis submitted in partial fulfilment of the requirements for the degree of Doctor of Philosophy
Abstract
Global energy demand is increasing, with the adoption of electric vehicles, in particular, representing a significant prospective demand on electricity distribution networks. The exploitation of renewable generation sources, driven by increased economic viability, technological maturity, and the need for environmental sustainability, is expected to play an increasingly important role in meeting this demand. However, the adoption of such low-carbon technologies necessitates a significant change in the way that distribution networks are monitored and controlled. This work examines the state of the art in the impact of low-carbon technologies on distribution networks, the technical strategies available to mitigate these impacts and their relative merits, and the architecture of the control systems used to effect such strategies. Smart metering and advanced metering infrastructure (AMI) are a fundamental component of these smart grid systems, providing widespread visibility of conditions at the very periphery of distribution networks which has not previously been feasible, but where the impact of low-carbon technologies is significant. This work describes the development of a hardware-in-the-loop test rig incorporating multiple, custom-built, hardware smart meter test beds, and the use of this test rig to demonstrate the implementation of real-time voltage control within a simulated low voltage (LV) distribution network. However, the adoption of smart metering and AMI inevitably incurs cyber security vulnerabilities which did not exist in the case of meters with no facility for remote communication. This work examines cyber security issues pertinent to smart grids and AMI in particular, and describes the analysis of the cyber security vulnerabilities of a commercially deployed smart electricity meter. The exploitation of these vulnerabilities in a manner which permits unauthorised electronic access to the device is also described. Finally, recommendations are made of revisions to the hardware, firmware and communications protocols used by the compromised meter which may mitigate the vulnerabilities identified.
Contents
Page Acknowledgements xi Abbreviations xiii Symbols xvii 1 - Introduction 1 1.1 - Background 11.1.1 - Energy demand and renewable generation 1
1.1.2 - Electric vehicles 3
1.1.3 - Smart grids 4
1.1.4 - Smart electricity meters 6
1.2 - Research objectives and structure 9
1.2.1 - Research objectives 9
1.2.2 - Thesis structure 10
2 - Literature review 11
2.1 - Introduction 11
2.2 - Conventional distribution network control 11
2.2.1 - Automatic voltage control 12
2.2.2 - Line drop compensation 14
2.2.3 - Voltage regulators and capacitor banks 14 2.3 - The impact of distributed generation 15
2.3.1 - Voltage regulation 16 2.3.2 - Voltage imbalance 24 2.3.3 - System protection 26 2.3.3.1 - Unintended islanding 26 2.3.3.2 - Protection blinding 28 2.3.3.3 - False tripping 28 2.3.3.4 - Reclosure impediment 29
2.3.4 - The impact of electric vehicle charging 29 2.4 - Strategies for distribution network voltage control 32
2.4.1 - On-load tap changers 33
2.4.2 - Reactive power control of distributed generation 39
2.4.3 - Energy storage 43
2.5.1 - Centralised vs decentralised control 43 2.5.2 - The architecture of schemes that have been deployed 46
2.6 - Smart meter and AMI security 47
2.6.1 - Conventional electricity meter security 47 2.6.2 - Electricity distribution as a target for attack 48 2.6.3 - Smart meters and AMI as targets for attack 49
2.6.3.1 - Theft of data 51
2.6.3.2 - Theft of energy 51
2.6.3.3 - Denial of energy 52
2.6.3.4 - Disruption of network control 52 2.6.4 - Vulnerabilities and constraints of smart meters and AMI 52 2.6.5 - The security of existing smart meter and AMI schemes 54 2.6.6 - Published smart meter and AMI attacks, and tools 55
3 - Design and development of the smart meter test rig 57
3.1 - Introduction 57
3.2 - Smart meter test bed platform and test rig design 58
3.2.1 - Smart meter test bed platform 58
3.2.2 - Test rig 59
3.3 - Smart meter test bed platform development 61
3.3.1 - Hardware 61
3.3.1.1 - Processor, memory and supporting devices 63
3.3.1.2 - Local interfaces 64
3.3.1.3 - WAN and HAN interfaces 64
3.3.1.4 - ADC and filtering 67
3.3.1.5 – PCB design and assembly 71
3.3.2 - Firmware 71
3.4 - Test rig development 77
3.4.1 - Real Time Digital Simulator 77
3.4.2 - SCADA server 78
3.4.3 - GPRS server 79
3.4.4 - Controller 81
3.4.5 - Physical architecture 81
3.5 - Commissioning 83
3.5.1 - Commissioning test design 83
3.5.2 - Simulated network 84
3.5.3 - Voltage control script 85
3.5.4 - Test setup 86
3.5.5 - Commissioning test results 86
3.7 - Conclusion 90
4 - Distribution network voltage control using smart meters 91
4.1 - Introduction 91
4.2 - LV network model 92
4.2.1 - Simulation topology 92
4.2.2 - Network source and transformer configuration 93
4.2.3 - Cable modelling 94
4.2.4 - Load/source block design 95
4.2.5 - Dynamic load module control 95
4.2.6 - Power injection subsystem design and control 96 4.3 - Development of the smart meter voltage alarm function 100 4.4 - Development of the automatic voltage controller 101
4.5 - Experimental setup 108
4.5.1 - Configuration of measuring equipment 108
4.5.2 - Telecommunications system 109
4.5.3 - Test parameters 111
4.6 - Test scenarios 111
4.6.1 - Scenario 1: High demand 111
4.6.2 - Scenario 2: High levels of distributed generation 116 4.6.3 - Scenario 3: Heavy, imbalanced loading 120 4.6.4 - Scenario 4: Heavy loading and high levels of distributed generation 124
4.7 - Discussion 128
4.8 - Conclusion 131
5 - Smart meter and AMI security 133
5.1 - Introduction 133
5.2 - Vulnerability analysis 134
5.2.1 - Prior information 134
5.2.2 - Analysis of hardware 135
5.2.3 - Testing of optical interface 136
5.2.4 - Choice of attack methodologies 137
5.3 - Attack toolkit 138
5.3.1 - Architecture 138
5.3.2 - Hardware 138
5.3.3 - Base operating system and software 139
5.4 - Attack procedure 139
5.4.1 - Attack 1 139
5.4.2 - Attack 2 148
5.5.1 - Introduction 150
5.5.2 - Attack 1 150
5.5.3 - Attack 2 151
5.6 - Recommendations 152
5.7 - Conclusion 155
6 - Conclusions and further work 157
6.1 - Conclusions 157
6.1.1 - Distribution network control 157
6.1.2 - Smart meter and AMI security 159
6.1.3 - Further achievements of research 160
6.2 - Further work 161
6.2.1 - Distribution network control 161
6.2.2 - Smart meter and AMI security 161
Acknowledgements
I am indebted to Prof Nick Jenkins for his unfaltering encouragement, patience, and meticulous review of my work.
Thanks are also due to Dr Jianzhong Wu, Dr Janaka Ekanayake, Dr Carlos Uglade-Loo and Dr Lee Thomas, for their academic wisdom and support, to Denley Slade, Paul Farrugia, Richard Rogers and Bill Whitehouse, for their technical support and good humour, and to Aderyn Reid, Jeanette Whyte, Chris Lee and Chiara Singh-Fisher, for their administrative support and free sandwiches.
I am of the opinion that the refectory and the public house are at least as fertile venues for inspiration as the office and the laboratory, so I thank my colleagues and friends for their companionship and intellectual discussion, in particular George O'Malley, Dr Luke Livermore, Dr Marc Rees, Dr Jonathan Stevens, Dr Ben Whitby, Dr Ian Moore, Dr Dave Clark, Dr Tracy Sweet and Catherine Roderick.
Finally, I would like to thank close friends for their patience and support over the journey which this thesis represents, in particular Jon Dickerson, Fabian Moore, Sarah Tatum, Julie Crowley, Tracey Plowman, Dr Davina Darmanin and Dr Edd Lewis. I would like to thank my mother, for instilling in me a sense of self-belief and confidence which has served me well, and my partner Claire, for her immense patience and care.
Abbreviations
2G Second-Generation cellular technology AC Alternating Current
ACCM Asynchronous Control Character Map ADC Analogue to Digital Converter
AES Advanced Encryption Standard AMI Advanced metering infrastructure AMR Automatic Meter Reading
ANSI American National Standards Institute
AT Attention
AVC Automatic Voltage Control AVR Automatic Voltage Regulator
AVRS Automatic Voltage Reference Setting BEV Battery Electric Vehicle
BPL Broadband over Power Line
CCDF Complementary Cumulative Distribution Function
CCITT Consultative Committee for International Telephony and Telegraphy CESG Communications-Electronics Security Group
CHAP Challenge Handshake Authentication Protocol CHP Combined Heat and Power
CIA Confidentiality, Integrity and Availability CNE Combined Neutral and Earth
COSEM Companion Specification for Energy Metering CPA Commercial Product Assurance
CPU Central Processing Unit CRC Cyclic Redundancy Check CSC Constant Set-Point Control CTS Clear To Send
DAC Digital to Analogue Converter
DECC Department of Energy & Climate Change DG Distributed Generation
DH Diffie-Hellman
DLMS Device Language Message Specification DNO Distribution Network Operator
DNP3 Distributed Network Protocol DoS Denial of Service
DSA Digital Signature Algorithm DSM Demand-Side Management
DSTATCOM Distribution Static Compensator DTI Department of Trade and Industry
EEPROM Electrically Erasable Programmable Read-Only Memory EHP Electric Heat Pump
ENWL Electricity North West Limited ETX End of Text
EU European Union EV Electric Vehicle
FIPS Federal Information Processing Standard FLAG Ferranti and Landis+Gyr
FP7 7th Framework Programme GNU GNU's Not Unix
GPC Giga Processor Card
GPRS General Packet Radio Service
GSM Global System for Mobile communications GTAO Giga Transceiver Analogue Output
GTNET Giga Transceiver Network interface GTWIF Giga Transceiver Workstation Interface HAN Home Area Network
HDLC High-level Data Link Control HMI Human Machine Interface HV High Voltage (36–300 kV) IDE4L Ideal Grid for All
IEC International Electrotechnical Commission IEEE Institute of Electrical and Electronics Engineers IP Internet Protocol
IPCP Internet Protocol Control Protocol IPsec Internet Protocol security
IRA Irish Republican Army IRQ Interrupt Request
ISO International Organization for Standardization JTAG Joint Test Action Group
LAN Local Area Network LCD Liquid Crystal Display LCNF Low Carbon Networks Fund LCP Link Control Protocol LCT Low-Carbon Technology LDC Line Drop Compensation LED Light Emitting Diode
LOVIA Low Voltage Integrated Automation LV Low Voltage (<1 kV)
MCU Metrology and Communications Unit MDC Meter Data Concentrator
MITM Man-In-The-Middle MOSI Master Out Slave In
MPAN Meter Point Administration Number MRU Maximum Receive Unit
MV Medium Voltage (1–36 kV) NAT Network Address Translation NCSC National Cyber Security Centre
OECD Organisation for Economic Co-operation and Development OLTC On-Load Tap Changer
OPC Open Platform Communications OPERA Open PLC European Research Alliance PAP Password Authentication Protocol PCB Printed Circuit Board
PDP Packet Data Protocol
PGA Programmable-Gain Amplifier PHEV Plug-in Hybrid Electric Vehicle PLC Power Line Carrier
PMIC Programmable Multilevel Interrupt Controller PPM Parts Per Million
PPP Point-to-Point Protocol PQ Power Quality
PV Photovoltaic QoS Quality of Service
R&D Research and Development RAM Random Access Memory RF Radio frequency
RMC Remote Monitoring-Based Control RMS Root Mean Square
RPC Remote Procedure Call RS-232 Recommended Standard 232 RTC Real-Time Clock
RTDS Real Time Digital Simulator RTP Room Temperature and Pressure RTS Ready to Send
RTT Round-Trip Time RTU Remote Terminal Unit
RX Receive
SAU Substation Automation Unit
SCK Serial Clock
SDRAM Synchronous Dynamic Random-Access Memory SHA Secure Hash Algorithm
SIM Subscriber Identity Module
SM Smart Meter
SMETS Smart Metering Equipment Technical Specifications SPI Serial Peripheral Interface
SRAM Static Random-Access Memory SSL Secure Sockets Layer
STX Start of Text
TBC Time-Based Control
TC Timer/Counter
TCP Transmission Control Protocol
TIA Telecommunications Industry Association TLS Transport Layer Security
TX Transmit
UART Universal Asynchronous Receiver Transmitter UDP User Datagram Protocol
UK United Kingdom
UKERC UK Energy Research Centre
USART Universal Synchronous/Asynchronous Receiver Transmitter USB Universal Serial Bus
V2G Vehicle-to-Grid
VUF Voltage Unbalance Factor WAN Wide Area Network
Symbols
IK,gen Fault current from distributed generation source (p.u.)
IK,grid Fault current from grid (p.u.)
P Real power (p.u.)
PLINE Active power in line (p.u.) PLOAD Active power to load (p.u.)
PPV Active power from photovoltaic generation source (p.u.) Q Reactive power (p.u.)
QLINE Reactive power in line (p.u.) QLOAD Reactive power to load (p.u.)
QPV Reactive power from photovoltaic generation source (p.u) REF Substation bus reference voltage (p.u.)
RL Feeder resistance (p.u.) RSET Resistive set-point (p.u.) S Apparent power (p.u.)
U0 Busbar voltage (p.u.)
ULC Feeder-end load centre voltage (p.u.) USET Voltage set-point (p.u.)
V1 DG connection point feeder voltage (V) V2 DG voltage source voltage (V)
VDG Voltage at DG source (p.u.) VL Voltage at load (p.u.)
VMAX Maximum voltage measured (p.u.) VMIN Minimum voltage measured (p.u.)
Vpre-set Default reference voltage (p.u.)
Vref Current reference voltage (p.u.) Vs Sending-end voltage (p.u.) X DG source series reactance (Ω)
XL Feeder reactance (p.u.) XSET Reactive set-point (p.u.)
δ1 DG connection point feeder phase angle (rad) δ2 DG voltage source phase angle (rad)
ϕ Phase angle of DG source (rad)
IK,gen Fault current from distributed generation source (p.u.)
IK,grid Fault current from grid (p.u.)
P Real power (p.u.)
PLOAD Active power to load (p.u.)
1 -
Introduction
1.1 - Background
Worldwide, electricity systems are undergoing rapid change. As energy demand increases, renewable generation sources are becoming widely adopted. Smart meters are a fundamental element of the smart grids needed to accommodate such developments, and are the subject of this research.
1.1.1 - Energy demand and renewable generation
Global energy consumption in 2050 is predicted to be more than 50 % greater than in 2018. More than half of this increase is expected to be driven by economic development and growing populations in non-OECD countries, such as India and China [1]. This is shown in Figure 1.1 [1].
Figure 1.1: World energy consumption [1]
Renewable energy is predicted to be the fastest-growing electricity generation source, with increased economic viability, technological maturity, and the need for environmental sustainability expected to result in renewable sources contributing almost 50 % of world electricity generation in 2050. Of these renewable sources, the greatest increase is predicted to be in wind and solar generation [1]. This is shown in Figure 1.2 [1].
The European Union (EU) has committed to reduce greenhouse gas emissions to 80– 95 % below the levels in 1990, by 2050. In order to achieve this, a greater proportion of electricity in total energy consumption is proposed, up to 39 % by 2050, of which up to 97 % is to be generated by renewable sources [2].
Figure 1.2: Global electricity generation [1]
More immediately, the 2009 Renewable Energy Directive [3], a component of the EU’s
2020 climate & energy package, requires member countries to increase the proportion of renewable energy in their national consumption, with an overall European target of 20 % by 2020. This represents more than double the 2010 proportion of 9.8 %.
Under the Renewable Energy Directive [3], targets for renewable production were based on member countries’ current capacity, and anticipated scope for growth. In the case of the UK, the target is 15 %. In response to this, the Government’s 2010 National Renewable Energy Action Plan for the United Kingdom [4] proposed a target of 30 % renewable electricity generation by 2020. In 2019, renewables constituted 36.9 % of total UK electricity generation, with an installed capacity of 47.4 GW at the end of 2019 [5]. This is shown in Figure 1.3 [6].
At the end of May 2020, solar photovoltaic (PV) generation capacity in the UK was approximately 13 436 MW across 1 036 077 installations, or 28 % of total renewable
generation capacity. Small-scale installations of up to 4 kW represent approximately 20 % of solar PV generation capacity in the UK [7], encouraged by feed-in tariffs introduced under the Energy Act 2008 [8], and available from 2010.
Figure 1.3: UK electricity generation by fuel type [6]
1.1.2 - Electric vehicles
The global electric car stock, including both purely electric, battery electric vehicles (BEVs), and plug-in hybrid electric vehicles (PHEVs), reached 7.2 million vehicles in 2019. The stock of electric buses also increased to approximately 500 000 vehicles, and the stock of two-wheeled electric vehicles reached 350 million. By 2030, the global stock of electric cars and commercial vehicles is predicted to be as high as 245 million [9]. The evolution of the global electric car stock from 2013 to 2017, and now dominated by China, is shown in Figure 1.4 [9].
A mandate of the EU’s 2009 Renewable Energy Directive [3] was that at least 10 % of energy used for transportation in member countries should be from renewable sources by 2020. In the UK, plug-in car grants, introduced in 2011 and facilitated by the Energy Act 2008 [8], have contributed to a total of over 244 000 licensed plug-in electric cars on the road, as of the end of December 2019 [10]. The Society of Motor Manufacturers and Traders expects plug-in vehicles to constitute approximately 10 % of new car registrations in 2020 [11]
Electric vehicle charging, ranging from connections to domestic outlets to commercial charging stations, represents a significant prospective demand on distribution networks. For example, the Supercharger charger, manufactured by Tesla, is capable of charging a single vehicle at 120 kW, with 16 585 such chargers installed worldwide as of the end of May 2020 [12].
1.1.3 - Smart grids
The adoption of low-carbon technologies, such as renewable generation, energy storage, and electric vehicles, imposes a significant change in the demands on electricity distribution networks, and necessitates a change in the way that they are monitored and controlled. The adoption of renewable energy sources, in particular, is leading to a departure from the historical approach of centralised generation by a comparatively small number of large-scale, typically thermal plants. Instead, generation is increasingly decentralised and geographically distributed, existing at the very periphery of distribution networks in the case of, for example, domestic solar PV installations. A smart grid may be broadly defined as one which accommodates such low-carbon technologies, with monitoring and control achieved by means of additional technology installed on distribution networks, and associated telecommunications infrastructure [13], [14]. An overview of the topology and components typical of prospective smart grids is illustrated in Figure 1.5 [15].
The American Recovery and Reinvestment Act of 2009 [16] provided $4.5 billion of funding for power system modernisation, including smart grid development. China's State Grid Corporation presented plans for a pilot smart grid programme in 2010, with $96 billion expected to have been invested by 2020 [17].
Figure 1.5: Smart grid topology and components [15]
In Europe, at least 950 projects have been, or are being, undertaken, across the 28 EU member countries plus Norway and Switzerland, totalling approximately €5 billion of investment [18]. The distribution of smart grid research and development (R&D) and deployment projects in Europe is shown in Figure 1.6 [18].
In the UK, the Low Carbon Networks Fund (LCNF) provided approximately £250 million of funding to 65 projects between 2010 and 2015. This was intended to stimulate the development and trial of the low-carbon technologies and infrastructure constituting smart grids, and to promote energy saving schemes. Examples of the projects undertaken include trials of energy storage, analysis based on the enhanced visibility provided by electrical measurement devices located at points on distribution networks which were not previously monitored, and measures to provide the additional network automation and control which may be required in the presence of high penetrations of distributed generation [19].
Figure 1.6: Smart grid R&D and demonstration projects in Europe [18]
1.1.4 - Smart electricity meters
In their most basic form, smart meters are distinguished from conventional utility meters by the facility to electronically communicate the values they measure and record to utilities, for the purpose of billing. This negates the requirement for manual meter reading, and provides the facility for more granular recording of energy consumption. Meters which fulfil this requirement are typically referred to as components of an automatic meter reading (AMR) infrastructure. More advanced smart electricity meters, capable of high-speed, two-way communication with utilities and other head-end systems, offer the facility of readings taken on demand, as well as the potential for demand-side management (DSM), for example by means of real-time pricing, or electrical measurements taken for the purpose of distribution network monitoring. Such meters are typically referred to as components of an advanced metering infrastructure (AMI) [13], [20]. The evolution of smart meter technology is shown in Figure 1.7 [21].
Figure 1.7: Smart meter technology evolution [21]
The fundamental elements of a smart meter, from acquisition of measurements of the electrical network to which it is connected, to communication with the utility or head-end system via a wide area network (WAN), are illustrated in Figure 1.8 [13].
Figure 1.8: Functional block diagram of a smart meter [13]
AMI is considered to be a foundation investment in smart grids by enabling control at customer level, for example in the case of DSM, as well as by providing real-time visibility for the purpose of distribution network control and automation [20], [22]. This is shown in Figure 1.9 [20]
Globally, smart meter penetration is expected to reach approximately 53 % by the end of 2025 [23]. In Europe, legislation [24] under the EU’s Third Energy Package mandates that, subject to a positive long-term cost-benefit analysis, member countries should equip 80 % of consumers with smart electricity meters by 2020. In the UK, there were approximately 16 485 000 smart meters operating in domestic and small commercial
premises, as of the end of December 2019 [25].
From the perspective of both cyber security and security of supply, the adoption of AMI incurs significant potential vulnerabilities. These range from the compromise of consumer privacy by the inference of behaviour from energy consumption patterns, to the disruptive injection of false data, in the case that measurements from smart meters
Figure 1.9: Smart metering and smart grid return on investments [20]
are used to inform distribution network control and automation. Where a remote supply disconnection facility is included within the smart meter, this represents a critical further vulnerability [26]–[28].
In the United States, the National Institute of Standards and Technology (NIST) has issued guidelines for security in smart grid infrastructure, including smart meters [29]. In turn, these guidelines cite existing standards for more general cyber security, for example the Federal Information Processing Standard (FIPS) Minimum Security Requirements for Federal Information and Information Systems [30], and Security Requirements for Cryptographic Modules [30], commonly known as FIPS 140-2. Such standards are readily applicable to AMI, owing to its close relation to existing, security-critical infrastructure, such as that for smart payment cards.
In 2012, the European Commission issued recommendations outlining the necessity for the mitigation of risks to privacy, personal data and security in the course of smart metering deployment [31]. An expert working group established by the European Commission, within its Smart Grids Task Force [32], has also issued broad cyber security guidance on smart grids, including AMI [33].
In the UK, the current Smart Metering Equipment Technical Specifications (SMETS 2) [34], issued by the Department of Energy & Climate Change (DECC), stipulate basic
security functions required of smart metering equipment, for example the support of specific cryptographic algorithms, and the secure storage of security credentials. The specification is supported by companion documents from other UK Government bodies, for example guidance on achieving certification under the National Cyber Security Centre’s (NCSC) Commercial Product Assurance (CPA) scheme, issued by the former Communications-Electronic Security Group (CESG) [35]. This extends the DECC specification to outline the required behaviour and response of smart metering equipment in order to mitigate typical vulnerabilities and attacks.
Despite such guidelines and specifications, cyber security attacks have been demonstrated against commercially deployed smart meters in both the United States [36] and Europe [37], [38].
1.2 - Research objectives and structure
1.2.1 - Research objectives
The objective of the research described in this thesis was to investigate the impact of low-carbon technologies such as distributed, renewable generation on distribution networks, to demonstrate the use of smart metering in mitigating this impact, and to examine the issue of cyber security in the context of AMI. Particular contributions include:
• The development of a hardware smart meter test bed platform on which functions
both within the capacity of existing smart meters, and expected to be within the capacity of future smart meters, may be tested.
• The development of a hardware-in-the-loop test rig, incorporating hardware smart
meter test beds, the infrastructure required for WAN communication with the meters and for SCADA communication, and a Real Time Digital Simulator (RTDS) simulating a section of distribution network.
• The demonstration of a closed-loop control system which mitigates the impact of a
high penetration of solar PV generation and electric vehicle charging on a section of distribution network, informed by real-time measurements from smart meters, and effected by a distribution transformer equipped with an on-load tap changer (OLTC).
• The demonstration of a cyber security attack in which a security vulnerability present
in a commercially deployed smart meter is analysed, and exploited in a manner which permits unauthorised electronic access to the device.
1.2.2 - Thesis structure
Subsequent chapters are structured as follows:
• Chapter 2 examines the state of the art in the impact of low-carbon technologies
such as distributed, renewable generation on distribution networks, the technical strategies available to mitigate these impacts, and their relative merits, the architecture of the control systems used to effect such strategies, and the cyber security issues pertinent to smart grids and AMI in particular.
• Chapter 3 describes the design, development and commissioning of a
hardware-in-the-loop test rig to demonstrate the use of smart meter measurements for distribution network control, and incorporating multiple hardware smart meter test beds, the infrastructure required for WAN communication with the meters and for SCADA communication, and a Real Time Digital Simulator simulating a section of distribution network. The smart meter test bed platform developed permits the execution of custom firmware functions, and for the configuration of a wide range of measurement and communications parameters as required for a particular experiment.
• Chapter 4 describes the use of the smart meter test rig to demonstrate the
implementation of real-time voltage control within a low voltage (LV) network. This employs the hardware, and builds on the foundation software and firmware, described in Chapter 3. A simplified LV network model is developed for execution on a Real Time Digital Simulator. The development of a voltage alarm firmware function for the smart meter test bed platform described in Chapter 3, and a voltage controller, is described. Finally, the operation of the controller is demonstrated in case studies illustrating scenarios of heavy loading, high levels of distributed generation, heavy, imbalanced loading, and the conflicting requirements of a combination of heavy loading and high levels of distributed generation.
• Chapter 5 describes the analysis of the cyber security vulnerabilities of a
commercially deployed smart electricity meter resulting from inadequate provision for the protection of WAN communication, and for authentication when establishing connections with the local communications interface of the meter. These vulnerabilities are exploited, and are demonstrated to permit unauthorised electronic access to the meter. Recommendations are made of measures to mitigate the vulnerabilities identified and exploited.
• Chapter 6 provides a conclusion of the research undertaken, and identifies
2 -
Literature review
2.1 - Introduction
The techniques employed for conventional network control, as well as the state of the art of the impact of distributed generation, strategies to mitigate this impact including the use of smart metering, and cyber security issues pertinent to smart grids and advanced metering infrastructure (AMI), are presented.
Subsequent sections are structured as follows:
• Section 2.2 examines the control techniques employed on conventional distribution
networks, in the absence of a high penetration of distributed generation.
• Section 2.3 examines the impact of distributed generation on voltage regulation,
power quality, and system protection, along with the potentially conflicting impact of electric vehicle (EV) charging.
• Section 2.4 examines control strategies to mitigate the impact of distributed
generation on distribution networks, including the use of smart metering.
• Section 2.5 examines the architecture of schemes to mitigate the impact of
distributed generation on distribution networks.
• Section 2.6 examines the basis for cyber security attacks on smart meters (SMs) and
AMI, as well as the vulnerabilities of such systems, and published attacks.
2.2 - Conventional distribution network control
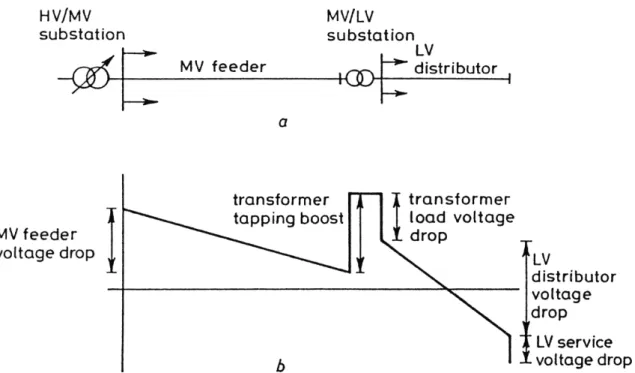
Voltage control has been employed in conventional distribution network control in order to provide a voltage at the connection point of customers which is compliant with applicable standards, for example The Electricity Safety, Quality and Continuity Regulations 2002 [39] in the UK. Such control is required to accommodate the impact of varying demand on the voltage drop across transformers and conductors, as power is conveyed through the distribution network from high voltage (HV), through medium voltage (MV), to low voltage (LV). This is illustrated in Figure 2.1 [40].
Figure 2.1: Voltage regulation on MV and LV networks. a: Simplified distribution network diagram. b: MV and LV network voltage variation [40]
The above figure shows the voltage drop across the MV and LV feeders and the MV/LV transformer, and the compensatory boost provided by the tap setting of the MV/LV transformer.
The principal mechanism of voltage control on conventional UK distribution networks is the variation of transformer tap setting. In the case of HV/MV, or primary transformers, this is typically achieved by means of on-load tap changers (OLTCs), operating automatically under load in order to maintain busbar voltage within an acceptable range. In the case of MV/LV transformers, this is typically achieved by means of manual, off-load tap selection [40], [41].
2.2.1 - Automatic voltage control
A conventional automatic voltage control (AVC) scheme for the control of OLTC-equipped HV/MV transformers is illustrated in Figure 2.2 [42].
Figure 2.2: Basic AVC scheme [42]
Given the voltage set-point USET, the control scheme in the above figure acts to maintain
the busbar voltage Uo within the range:
(2.1)
where the lower boundary ULB is defined as:
(2.2)
and the upper boundary UUB is defined as:
(2.3)
The bandwidth element serves to prevent hunting of the control scheme. This can arise if a tap change performed to correct for what is deemed to be a low busbar voltage, results in what is deemed to be a high busbar voltage, or vice versa, resulting in a continuous sequence of alternate tap-change operations. Accordingly, a bandwidth of just under twice the transformer tap step is typically employed. The time-delay element serves to prevent the control scheme performing tap-change operations on the basis of brief voltage variations, and to limit the total number operations, with the associated wear on the tap changer mechanism and contacts [40].
2.2.2 - Line drop compensation
AVC schemes may be extended to account for the resistance and reactance of the feeder supplied by the transformer, and the current demand, known as line drop compensation (LDC) [40], [41]. This is illustrated in Figure 2.3 [42]:
Figure 2.3: AVC scheme with LDC [42]
Given the voltage set-point USET, the control scheme in the above figure acts to maintain
the voltage at the feeder-end load centre ULC with the range:
(2.4)
where the lower and upper boundaries are defined as per Equations (2.2) and (2.3) respectively. In addition to the busbar voltage, the load is also considered under this scheme, based on measured current, the resistive and reactive set-points RSET and XSET,
derived from the ratios of the voltage and current transformers, and the feeder resistance and reactance, RL and XL.
2.2.3 - Voltage regulators and capacitor banks
In order to compensate for excessive voltage drop at critical points, voltage regulators and capacitor banks have sometimes been employed on UK distribution networks. The voltage regulators are typically autotransformers, equipped with OLTCs. The capacitor banks may be permanently connected and of a fixed value, or switched in order to
provide reactive power compensation and boost voltage according to demand [40]– [43].
2.3 - The impact of distributed generation
The principal impacts of distributed generation (DG) on distribution networks may be categorised as follows [44]–[50]:
• Voltage regulation: DG may cause a voltage rise at the point of connection. The
additional demand of other low-carbon technologies, for example EV charging or heat pumps, if these are located elsewhere on a distribution network, may present a conflicting technical impact, compounding the issue of voltage regulation. Reverse power flow resulting from a high DG penetration may also result in undesirable behaviour in voltage regulation control schemes, for example LDC.
• Power quality: Transient voltage events such as dips and swells may result from
sudden variation in the output of DG sources. DG sources interfaced to the network by means of power electronics may introduce harmonic distortion. Resonance or other interactions may also occur between DG sources and other elements of the distribution network, including voltage control systems. The uneven distribution of single-phase DG sources across phases, particularly on LV feeders, may result in voltage imbalance.
• Network losses: DG may reduce network losses by offsetting demand with local
generation. However, if generation significantly exceeds local demand, with associated reverse power flow, losses may be increased. The thermal limits of distribution transformers and cables may limit the penetration of DG, as a result of increased power flow.
• System protection: DG may result in increased fault current levels on a distribution
network. Furthermore, adding additional power sources to a distribution network may alter the pattern of power flow, and power flow in the opposite direction to conventional operation may occur. DG may also energise a network, or part of it, which is otherwise expected to be isolated from the upstream network.
Of the impacts listed above, the effect of DG on voltage regulation, the power quality issue of voltage imbalance, and system protection, along with the potentially conflicting impact of EV charging on distribution networks, are considered in further detail in the following sections.
2.3.1 - Voltage regulation
Injection of real power into a distribution network by a DG source results in a voltage rise at the point of connection [46], [51]. The regulatory limits prescribing voltage on a distribution network may result in voltage rise being the limiting factor to the penetration of DG. In a simple, radial feeder, the voltage rise caused by a DG source at its point of connection may be approximated as [45], [52], [53]:
(2.5)
where PG and QG are the real and reactive power output of the DG source, PL and QL are
the real and reactive power dissipation of the load, R and X are the resistance and reactance of the feeder, and V is the line voltage at the connection point of the DG source [45]. From this, it can be seen that the effect on voltage of DG sources located further from the substation will be more significant than those located closer to it. It can also be seen that whilst the injection of active power will result in a voltage rise, the injection or consumption of reactive power by the DG source will also result in an increase or decrease in voltage, respectively [46], [51]. At present, however, standards prescribing the operation and connection of small scale DG sources typically restrict their power factor to approximately unity, such as 1.00 ± 0.05 in the case of
Engineering Recommendation G83/2 in the UK [54], and an average, lagging power factor of no less than 0.90, at 50 % load, in the case of IEC 61727 [55].
Real power injected by DG sources serves to offset the power dissipation of local loads which would otherwise be served by the upstream network. If the power injection of DG sources exceeds the power dissipation of local loads then reverse power flow, relative to the direction of flow in the absence of DG, will occur. A simplified, radial feeder is illustrated in Figure 2.4 [56].
Figure 2.4: Simplified distribution system model [56]
Given a fixed load, the reduction and subsequent reversal of real power flow in such a network, as a result of increasing power injection, will cause the voltage at the point of connection to rise until a limit is reached. This is shown in Figure 2.5 [56].
Figure 2.5: Voltage at the load bus and line current as a function of PLINE [56]
The effect which DG may have on the voltage profile of a radial feeder under different levels of demand is shown in Figure 2.6 [50].
Figure 2.6: Voltage profile on an LV feeder. The second column shows the effect of solar photovoltaic (PV) inverters [50]
In [57], Ingram et al. present a generic, UK distribution network. This model extends from a 33 kV, three-phase source, to four 400 V, radial feeders, representative of urban, low voltage distribution systems. A single line, overview diagram of this network is illustrated in Figure 2.7 [45].
Figure 2.7: Single-line diagram of the UK Generic Network [45]
DG sources were modelled as single-phase, with a rating of 1.1 kW. DG Penetration is defined as the percentage of customers with these sources installed, such that 100 % penetration represents all customers having 1.1 kW of generation capacity, and 200 %
penetration represents all customers having 2.2 kW. A minimum load of 0.16 kVA per customer was considered. Of the four LV feeders, three were modelled as lumped loads, with the fourth represented in detail. The simulation study found that, assuming a uniform distribution of generation, an upper voltage limit of 10 % was exceeded at between 40 % and 50 % penetration of the 1.1 kW DG sources operating at rated output, under minimum load conditions, and dependent on whether a constant impedance or constant power model was used to represent system loads. Results of the low voltage feeder remote end voltages, for the constant impedance and constant power load models, are shown in Figure 2.8 and Figure 2.9 respectively [57].
Figure 2.8: Voltage variation at the remote end of a 400 V feeder with increasing generation penetration, using a constant impedance equivalent load on the MV system
[57]
Figure 2.9: Voltage variation at the remote end of a 400 V feeder with increasing generation penetration, using a constant power equivalent load on the MV system [57]
The study of [57] further illustrated that local concentration of DG sources on a particular feeder results in an upper voltage limit being reached at the feeder end at a
lower level of DG penetration than can be achieved with uniform distribution of DG sources.
In [45], Trichakis et al. also performed a simulation study, using the generic, UK distribution network presented in [57] and illustrated in Figure 2.7. This study concluded that, assuming a uniformly distributed, minimum load of 61.44 kW at unity power factor, the maximum, uniformly distributed generation which could be supported by the network was 185 kW, before an upper voltage rise limit of 10 % was exceeded. The study further found that this voltage rise limited DG penetration before the cable and transformer thermal limits, and voltage regulation limits, were reached. Clustering of the DG sources to one of the four LV feeders was found to reduce the maximum generation which could be accommodated to 48 kW, whilst clustering of the DG sources at the ends of the LV feeders was found to limit the maximum generation to 28 kW, before a 10 % voltage rise limit was reached in both cases.
In [45], Trichakis et al. also performed a study based on an existing UK, urban, underground, LV distribution network. The network was modelled in Manitoba HVDC Research Centre’s PSCAD. A single line, overview diagram of this network is illustrated in Figure 2.10 [45].
The network illustrated in Figure 2.10 hosts 198 single-phase customers, as well as public street lighting. For the purpose of the study conducted, all demand is attributed to customer loads, with a minimum demand of 0.375 kW per customer at unity power factor. The maximum DG which can be accommodated on this network before a voltage rise limit of 10 % is reached is concluded to be 204 kW, or 1.03 kW per customer, with generation distributed uniformly across all customers, and under minimum loading. With the DG sources distributed uniformly across the 107 customers of the second LV feeder, the maximum generation which could be accommodated before this voltage rise limit was reached was found to be 85 kW, or 0.79 kW per customer.
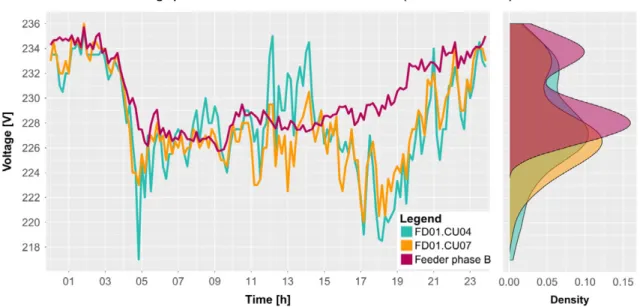
In [58], Barbato et al. present the results of LV network monitoring by means of smart meters and MV/LV substation sensors, under the European FP7 project IDE4L. The network is located in the city of Brescia, Northern Italy, and hosted 299 customers, 118 with residential PV installations, across ten feeders. Figure 2.11 [58] shows the voltage of the second phase of Feeder 1 of this network, as well as the voltage measured at the connection points of two customers on the same phase, over one day.
Figure 2.11: Voltage of Feeder 1-phase B compared with the voltage measured on customer 4 and 7 connected on the same phase. October 10th, 2016 [58]
It can be seen that the voltage at the connection point of customer CU04, with a PV installation, exhibits a significant rise during the afternoon period of maximum solar irradiance, compared to that of customer CU07, without a PV installation. Figure 2.12 [58] shows the voltages presented in Figure 2.11, over a period of one week. It is observed in [58] that, whilst PV generation is responsible for a significant voltage rise, the customer voltages recorded were within the 230 V ± 10 % range of EN 50160 [59].
Figure 2.12: Histogram of one week of voltage measurements (Oct. 10th – Oct. 16th) [58]
The Low Voltage Network Solutions project [60], commissioned by distribution network operator (DNO) Electricity North West (ENWL), monitored substation voltage and imbalance, as well as a number of other parameters, on 200 substations across the ENWL network during 2012 and early 2013. Of these substations, 28 comprised pole mounted transformers, and 172 ground mounted, with a total of over 1000 LV feeders. With regard to the penetration of PV, the project found that 61 % of the substations assessed had between 0.2 % and 49 % of customers with PV installations, with an average PV installation capacity of 3 kW. Notably, the report found that in 7 % of the substations, busbar voltages were consistently above 253 V (1.1 p.u.), based on ten-minute sampling. Further to the project, and to estimate the impact of a greater penetration of PV generation, a probabilistic impact assessment was performed on 25 ENWL LV networks, with a total of 128 feeders [61]. Under this assessment, PV installations were modelled with random sizes, distributed according to the statistics of registered PV installations in the UK at the time of the study [62]. Irradiance was based on actual measurements recorded by Whitworth Meteorological Observatory at The University of Manchester. In considering the effect of a range of penetration levels of PV from 0 to 100 %, defined as the percentage of customers with the technology installed, a five-minute resolution of the PV data was used with a Monte Carlo method, and 100 simulations per penetration level. In the feeders with more than 25 customers connected, the percentage of feeders exhibiting technical issues of non-conformance with the one-week or ten-minute average voltage ranges of EN 50160 [59], or
exceeding the capacity of the transformer or conductors, at any level of penetration, is shown in Figure 2.13 [61]. Other technologies considered in the study, including EVs, are also shown.
Figure 2.13: Feeders with technical problems per technology (more than 25 customers) [61]
The above figure shows that voltage issues were found in 64 % of the feeders modelled with up to 100 % of PV penetration. Figure 2.14 [61] shows the percentage of the occurrence of either voltage or thermal limits as the first issue in the case of increasing PV penetration on the feeders found to exhibit either technical issue. Again, other technologies considered in the study, including EVs, are also shown.
This above figure shows that, in all cases where a feeder is found to exhibit a technical issue, the voltage impact of PV generation is a more significant limit than the thermal constraints of the transformer and conductors.
2.3.2 - Voltage imbalance
The report System Integration of Additional Micro-generation [63], commissioned by the Department of Trade and Industry (DTI), asserts that the stochastic model presumed for the distribution of single-phase loads across the population of customers served by a three-phase feeder may reasonably be applied to the distribution of single-phase generation sources, such as PV systems, on an LV network. However, where imbalance in the distribution of single-phase DG sources across phases does exist, this can cause a voltage imbalance between phases [64]. This effect will be most pronounced at downstream points on radial feeders [65]–[67]. As well as resulting in increased losses from neutral conductor heating, a voltage imbalance is a particular issue for three-phase motors [64], [68] and variable-frequency drives [69]. Furthermore, the same power flow, imbalanced across phases, will result in less 'headroom' between the lowest or highest phase and prescribed limits, compared to a balanced condition [67], [70].
True voltage imbalance is defined in the UK [71], and Europe [59], as the ratio of the negative sequence voltage component to the positive sequence voltage component, expressed as a percentage. This is referred to as the voltage unbalance factor (% VUF):
(2.6)
The IEEE defines an approximation to this, the phase voltage unbalance rate [72], [73]:
(2.7)
In the UK, Engineering Recommendation P29 defines a % VUF limit of 1.3 %, with up to 2 % permitted for less than one minute [71]. EN 50160 defines a range of 2 % for 95 % of the ten-minute average period over one week [59].
In [57], analysis of the impact of imbalanced connection of DG sources was conducted by only connecting generation sources to phase A of the 400 V feeder modelled in
detail. The resulting % VUF, for the constant impedance and constant power load models, are shown in Figure 2.15 and Figure 2.16 respectively [57].
Figure 2.15: Voltage imbalance results due to connection of generation on one phase of a 400V feeder, using constant impedance equivalent load on MV system [57]
Figure 2.16: Voltage imbalance results due to connection of generation on one phase of a 400V feeder, using constant power equivalent load on MV system [57]
It can be seen from the above figure that the % VUF limit of 1.3 % defined by P29 [71] is exceeded with a penetration of 1.1 kW DG sources of approximately 150 %.
In [45], Trichakis et al. also examined the issue of imbalance, using the generic, UK distribution network presented in [57] and illustrated in Figure 2.7. It was found that, in the case of uniformly distributed, unity power factor DG sources, and at minimum, uniformly distributed unity power factor load conditions of 61.44 kW or 0.16 kW per customer, a maximum of 47.8 kW of generation could be supported on one phase of one feeder before a % VUF limit of 1.3 % was exceeded. In the case of the existing UK, underground, LV distribution network model also considered in [45] and illustrated in Figure 2.10, the maximum generation which could be supported, uniformly distributed
on one phase of the second feeder was approximately the same as for the generic, UK network, at 47.8 kW. This also reflects the maximum penetration of 150 % of 1.1 kW DG sources found in [57].
2.3.3 - System protection
In addition to the effect it may have on voltage, the introduction of distributed generation onto a distribution feeder may increase the magnitude of fault current flow in the feeder to which it is connected, and in adjacent feeders. It may also have the effect of changing the direction of fault current flow. Such impacts may require the uprating of assets such as transformers and conductors, and also have the potential to cause a number of issues with the operation of protection devices. Existing protection schemes predicated on one-way current flow may no longer be adequate to protect feeders hosting a high penetration of distributed generation, and an increase in the use of dedicated communication to coordinate protection may be required [49], [74]. Protection operation issues of particular concern are the following [44], [46], [75], [76]:
• Unintended islanding
• Protection blinding
• False tripping
• Reclosure impediment
These issues are considered in further detail in the following sections.
2.3.3.1 - Unintended islanding
Islanding occurs when a section of distribution network no longer connected to the upstream network continues to be energised by distributed generation connected to it. Although circumstances exist under which this may be desirable, it may present considerable hazards to equipment, those working on the network, and consumers, particularly if it is unintended. The most fundamental hazard is injury to consumers or those working on the network arising from an assumption that, since the local distribution network is no longer connected to the upstream network, it is no longer energised [49], [76], [77]. In the event that protection devices have isolated the section of distribution network from the upstream network due to the detection of a fault on the local network, DG sources may continue to contribute current to the fault, causing further damage [49]. A compounding issue is that, whilst it may be sufficient to cause damage, the fault current contribution of individual DG sources may not be sufficient
to trigger protection which would otherwise isolate the fault, in a timely manner [46], [74], [76].
Due to what may be a significant, step change in the load presented to DG sources on a section of network at the point that it becomes islanded, and also dependent on the control scheme of the individual DG sources, the voltage and frequency of the islanded network section may deviate rapidly and substantially from their values prior to disconnection from the upstream network. This presents a power quality issue which may damage assets and consumer equipment. It also presents a challenge to resynchronisation with the upstream network, prior to reconnection to it, and a considerable hazard if reconnection is attempted without resynchronisation. This requires dedicated protection infrastructure which would not have been required in the absence of DG sources [49], [74], [76], [77].
Deviation of voltage and frequency values following islanding of a section of network are currently the principal means by which islanding is detected [49], [77]. Standards prescribing the operation of DG sources, such as IEC 61727 [55] and IEEE 1547 [78], require the inclusion of islanding prevention measures in order that the sources quickly cease to energise a section of network if it becomes islanded. In the event of a rapid deviation of voltage and frequency values, ‘passive’ protection may be employed to isolate the DG source from the network when these values fall outside of an acceptable window. In the event that the match of load and DG capacity on the islanded network section is sufficiently good that the deviation of voltage and frequency occurs too slowly for islanding detection to occur in an acceptable time, ‘active’ protection may be employed. Under such a scheme, the control scheme of the otherwise voltage following DG source is designed to deviate more rapidly from the voltage and frequency values prior to islanding, by design. This enables the anti-islanding protection to detect values which fall outside of an acceptable window, and hence an islanded condition, more quickly than would otherwise be the case [49], [77].
In the case that auto-reclosing is employed, it is imperative that anti-islanding protection operates quickly enough that temporary faults are not sustained by the fault current contribution of DG sources during the dead time of the recloser. Such onerous timing requirements may preclude the use of voltage and frequency deviation to detect islanding, and instead require the use of dedicated communication between DG sources and distribution network protection equipment [74], [76].
2.3.3.2 - Protection blinding
Protection blinding, also known as protection under-reach, occurs as a result of the contribution of fault current from DG sources to a fault, in addition to the fault current from the upstream network. Consequently, the total current at the fault location will increase, while the contribution from the upstream network will decrease [44], [76]. Dependent on the impedance of the upstream network, the DG sources, and assets such as transformers and conductors, the current contribution of the upstream network may be reduced to such a degree in the event of a fault that protection does not detect it [74], [75]. This is illustrated in Figure 2.17 [44].
Figure 2.17: Principle of blinding of protection [44]
2.3.3.3 - False tripping
Where two or more feeders are supplied from a common substation bus, DG sources on one feeder may contribute fault current to a fault occurring on an adjacent feeder, via that bus. In addition to increasing the total fault current, the contribution of current from the feeder on which no fault is present may be sufficient to trigger the protection of that feeder, isolating it unnecessarily [44], [49], [75], [76], [79]. This is illustrated in Figure 2.18 [44]. Directional protection may be used to prevent erroneous tripping of this sort [44], [46], [49], [76], [80].
2.3.3.4 - Reclosure impediment
Since 80 % of faults occurring on distribution networks are temporary in nature, reclosers are widely employed, particularly to protect overhead circuits [44], [80]. However, DG sources may continue to supply fault current to a fault on a section of network during the dead time of the recloser protecting it, preventing arc extinction and sustaining the fault [44], [74]–[76].
In protection coordination schemes under which an upstream recloser is intended to prevent downstream protection devices such as fuses from operating in the case of temporary faults, the additional fault current contributed by DG sources may cause the downstream protection to operate before the recloser can operate [44], [49]. This is illustrated in Figure 2.19 [49].
Figure 2.19: How fault contributions from other feeder energy sources such as PV can interfere with fuse and circuit breaker coordination in fuse-saving schemes [49]
Even during the dead time of a recloser, typically in the order of 0.3–0.6 s [81], significant deviation of voltage and frequency may occur in an islanded section of network, energised by DG sources present on it. This loss of synchronisation with the upstream network presents a significant hazard upon reconnection [74], [76], [77].
2.3.4 - The impact of electric vehicle charging
EV charging, not considering future vehicle-to-grid (V2G) technology, represents a significant potential load on distribution networks. A typical, residential charging point
has a rating of 16 A or 3.68 kW [82]. In [70], Rodriguez-Calvo et al. conclude that, since EV charging is expected to take place predominantly at night, during the period in which demand from other loads is typically lowest, it does not present such an immediate issue to voltage compliance as PV adoption. In [83], an aggregated charge profile for plug-in hybrid electric vehicle (PHEVs) is presented which reflects this, shown in Figure 2.20. However, it is noteworthy that such a profile is approximately an inverse of daily solar irradiance and, hence, potential PV output, and EV charging does have the potential to result in under-voltage conditions, particularly at the ends of long, radial LV feeders, or on already heavily loaded networks [84], [85].
Figure 2.20: PHEV Charge Profile (Hour 1 represents 12:01 a.m. to 1:00 a.m. Hour 24 represents 11:01 p.m. to 12:00 a.m.) [83]
Even if the demand of EV charging does not result in under-voltage conditions on a distribution network, it has the potential to affect voltage regulation and balance.
In [84], a study of the impact of EV charging was undertaken, based on the generic and existing UK, LV distribution networks presented in [57] and [45], and illustrated in Figure 2.7 and Figure 2.10 respectively. Customer load, not including EV charging, was modelled according to half-hourly data provided by the UK Energy Research Centre (UKERC). The study considered a slow charging rate of 1.3 kW, and a fast rate of 9.6 kW, with a total of 66 customers using EVs, as per the penetration scenarios examined in the study. Figure 2.21 [84] shows the load effect of EV charging on a secondary transformer of the existing UK, LV distribution network, on both weekdays and weekends.
Figure 2.21: 100 % home slow-charging scenario for the UK existing LV distribution network during winter [84]
It can be seen from the above figure that the transformer rating is exceeded by EV charging under this scenario, on winter evenings. The study further found that EV charging resulted in transformer overloading in both autumn and winter when the generic UK network model was employed. Customer voltage was not found to exceed current UK voltage limits [39] under any of the scenarios considered. Under the worst-case scenario presented in Figure 2.21, the feeder end customer voltages were found to be approximately 236 V in the case of the generic UK network, and 239 V in the case of the existing UK network, with a substation voltage of approximately 250 V. With regard to voltage regulation, under the worst-case scenario, a voltage difference of approximately 6 % was found between the substation and feeder end in the case of the generic UK network, and approximately 4.7 % in the case of the existing UK network. The study also found that a maximum of approximately 48 kW of charging load may be accommodated on one phase of one of the 400 V feeders before a % VUF limit of 1.3 % [71] is exceeded. However, the report concludes that it is transformer loading which is expected to be the limiting factor with regard to EV penetration, although brief overloading may be tolerated by distribution transformers without the requirement for upgrading by the DNO.
Further to the Low Voltage Network Solutions project [60], commissioned by DNO Electricity North West (ENWL), and to estimate the impact of prospective EV adoption, a probabilistic impact assessment was performed on 25 ENWL LV networks, with a total of 128 feeders [61]. Under this assessment, EV profiles were created based on the
result of a one-year EV field trial conducted in Dublin. In the feeders with more than 25 customers connected, the percentage of feeders exhibiting technical issues of non-conformance with the one-week or ten-minute average voltage ranges of EN 50160 [59], or exceeding the capacity of the transformer or conductors, at any level of penetration, is shown in Figure 2.13 [61]. The figure shows that both issues of voltage non-conformance and issues of thermal overloading of network assets were found in approximately 25 % of the feeders modelled with up to 100 % of EV penetration. Figure 2.14 [61] shows the percentage of the occurrence of either voltage or thermal limits as the first issue in the case of increasing EV penetration on the feeders found to exhibit either technical issue. This figure shows that in this study, in all cases where a feeder is found to exhibit a technical issue, the thermal impact of EV adoption was slightly more significant than the voltage impact, presenting the limiting factor to EV penetration in approximately 65 % of cases.
2.4 - Strategies for distribution network voltage
control
The principal strategies for voltage control in distribution networks hosting a large penetration of DG, also considering the potentially conflicting impacts of other low-carbon technologies (LCTs) such as EVs, may be categorised as follows [46], [85]–[90]:
• Network reinforcement: Reduction of the resistance and reactance of distribution
network feeders reduces the effect of real and reactive power flow on voltage, as per Equation (2.5).
• Curtailment: The real power injection of DG sources may be constrained in order to
limit the resulting voltage rise.
• Demand-side management (DSM): Appliances, domestic and commercial heating and
cooling, and EV charging, may be controlled in order to optimally schedule their demand.
• On-load tap changers: By changing the distribution transformer tap position under
load, busbar voltage may be controlled to reflect the balance of generation and demand on a feeder at a given time.
• Reactive power flow control: By absorbing reactive power, DG sources may mitigate
the voltage rise resulting from real power injection, as per Equation (2.5). In the case that conflicting requirements exist, for example an over-voltage condition on a feeder resulting from a high penetration of PV and an under-voltage condition on an
adjacent feeder supplied by the same busbar resulting from high demand, injection of reactive power by switched capacitors may be employed to raise the voltage on the feeder exhibiting under-voltage, as per Equation (2.5).
• Storage: Local storage of real power from, for example, PV generation, may be used
to limit the instantaneous real power injection into a feeder. Energy stored and consumed locally in this way does not contribute to active power flow in the feeder.
In all cases of active control, the distributed measurements offered by smart meters located at the periphery of the distribution network enhance the scope for, and effectiveness of, coordinated control [46], [85], [91].
Of the control strategies listed above, the use of OLTCs, reactive power flow control by DG sources, and energy storage, are considered in further detail in the following sections.
2.4.1 - On-load tap changers
On-load tap changers have not typically been used at secondary substation level in the UK and Europe [92], [93]. However, the requirement for voltage control in the presence of high DG penetration on distribution networks and, in particular, to mitigate the voltage rise associated with real power injection by these technologies, increasingly justifies the costs of additional transformer, communications and control infrastructure, and of the wear of tap-change operations [51], [94]. The implementation of OLTCs with electronic commutation in addition to [95] or replacing mechanical commutation [96]–[100], may mitigate these issues by offering faster commutation without mechanical wear or arcing. The use of decoupled OLTCs, capable of changing the tap position of each phase independently, has also been proposed [101], [102].
The performance of conventional AVC schemes, based on maintaining a constant busbar voltage, and LDC, in the presence of high penetrations of DG, have been examined in literature [42], [46], [49], [103], [104]. However, high penetrations of DG resulting in low load current and even reverse power flow may adversely affect such schemes [105]–[109]. Hence, control strategies have been presented which augment or supplant such control, as well as considering both time of day, significant due to the daily profile of solar irradiance, and the potential for distributed network voltage monitoring, even on LV networks, offered by technologies such as smart meters. In [103], a scheme by which historical voltage data from a feeder is used to augment more basic LDC control in the absence of real-time voltage measurements is proposed. In [106], conventional LDC is augmented by considering power flow direction. The use
![Figure 1.5: Smart grid topology and components [15]](https://thumb-us.123doks.com/thumbv2/123dok_us/762518.2596474/23.892.174.806.104.443/figure-smart-grid-topology-components.webp)
![Figure 1.6: Smart grid R&D and demonstration projects in Europe [18]](https://thumb-us.123doks.com/thumbv2/123dok_us/762518.2596474/24.892.86.724.105.602/figure-smart-grid-r-amp-demonstration-projects-europe.webp)
![Figure 2.5: Voltage at the load bus and line current as a function of P LINE [56]](https://thumb-us.123doks.com/thumbv2/123dok_us/762518.2596474/35.892.235.745.530.894/figure-voltage-load-bus-line-current-function-line.webp)
![Figure 2.6: Voltage profile on an LV feeder. The second column shows the effect of solar photovoltaic (PV) inverters [50]](https://thumb-us.123doks.com/thumbv2/123dok_us/762518.2596474/36.892.103.703.102.458/figure-voltage-profile-feeder-second-column-photovoltaic-inverters.webp)
![Figure 2.10: Single-line diagram of the case study public UK network [45]](https://thumb-us.123doks.com/thumbv2/123dok_us/762518.2596474/38.892.125.679.637.1069/figure-single-line-diagram-case-study-public-network.webp)
![Figure 2.14: First technical issue among the feeders with problems per technology [61]](https://thumb-us.123doks.com/thumbv2/123dok_us/762518.2596474/41.892.275.705.789.1111/figure-technical-issue-feeders-problems-technology.webp)
![Figure 2.15: Voltage imbalance results due to connection of generation on one phase of a 400V feeder, using constant impedance equivalent load on MV system [57]](https://thumb-us.123doks.com/thumbv2/123dok_us/762518.2596474/43.892.176.809.187.431/figure-voltage-imbalance-connection-generation-constant-impedance-equivalent.webp)
![Figure 2.21: 100 % home slow-charging scenario for the UK existing LV distribution network during winter [84]](https://thumb-us.123doks.com/thumbv2/123dok_us/762518.2596474/49.892.195.781.107.472/figure-home-charging-scenario-existing-distribution-network-winter.webp)
