o r i g i n a l a r t i c l e
The n e w e n g l a n d j o u r n a l of m e d i c i n eA Low-Carbohydrate as Compared
with a Low-Fat Diet in Severe Obesity
Frederick F. Samaha, M.D., Nayyar Iqbal, M.D., Prakash Seshadri, M.D., Kathryn L. Chicano, C.R.N.P., Denise A. Daily, R.D., Joyce McGrory, C.R.N.P.,
Terrence Williams, B.S., Monica Williams, B.S., Edward J. Gracely, Ph.D., and Linda Stern, M.D.
From the Philadelphia Veterans Affairs Med-ical Center (F.F.S., N.I., K.L.C., D.A.D., J.M., T.W., M.W., L.S.); the Department of Med-icine, Division of Cardiology (F.F.S.), and the Department of Medicine, Division of Endocrinology (N.I., P.S.), University of Pennsylvania Medical Center; and the De-partment of Family, Community, and Pre-ventive Medicine, Drexel University College of Medicine (E.J.G.) — all in Philadelphia. Address reprint requests to Dr. Samaha at Cardiology 8th Fl., MC 111C, University and Woodland Ave., Philadelphia, PA 19104, or at [email protected].
N Engl J Med 2003;348:2074-81. Copyright © 2003 Massachusetts Medical Society.
b a c k g r o u n d
The effects of a carbohydrate-restricted diet on weight loss and risk factors for athero-sclerosis have been incompletely assessed.
m e t h o d s
We randomly assigned 132 severely obese subjects (including 77 blacks and 23 wom-en) with a mean body-mass index of 43 and a high prevalence of diabetes (39 percent) or the metabolic syndrome (43 percent) to a carbohydrate-restricted (low-carbohydrate) diet or a calorie- and fat-restricted (low-fat) diet.
r e s u l t s
Seventy-nine subjects completed the six-month study. An analysis including all sub-jects, with the last observation carried forward for those who dropped out, showed that subjects on the low-carbohydrate diet lost more weight than those on the low-fat diet (mean [±SD], –5.8±8.6 kg vs. –1.9±4.2 kg; P=0.002) and had greater decreases in tri-glyceride levels (mean, –20±43 percent vs. –4±31 percent; P=0.001), irrespective of the use or nonuse of hypoglycemic or lipid-lowering medications. Insulin sensitivity, measured only in subjects without diabetes, also improved more among subjects on the low-carbohydrate diet (6±9 percent vs. –3±8 percent, P=0.01). The amount of weight lost (P<0.001) and assignment to the low-carbohydrate diet (P=0.01) were independ-ent predictors of improvemindepend-ent in triglyceride levels and insulin sensitivity.
c o n c l u s i o n s
Severely obese subjects with a high prevalence of diabetes or the metabolic syndrome lost more weight during six months on a carbohydrate-restricted diet than on a calorie-and fat-restricted diet, with a relative improvement in insulin sensitivity calorie-and triglyceride levels, even after adjustment for the amount of weight lost. This finding should be in-terpreted with caution, given the small magnitude of overall and between-group differ-ences in weight loss in these markedly obese subjects and the short duration of the study. Future studies evaluating long-term cardiovascular outcomes are needed before a carbohydrate-restricted diet can be endorsed.
a l o w - c a r b o h y d r a t e a s c o m p a r e d w i t h a l o w - f a t d i e t i n s e v e r e o b e s i t y
he differences in health
bene-fits between a carbohydrate-restricted diet and a calorie- and fat-restricted diet are of considerable public interest. However, there is concern that a carbohydrate-restricted diet will ad-versely affect serum lipid concentrations.1
Previ-ous studies demonstrating that healthy volunteers following a low-carbohydrate diet can lose weight have involved few subjects, and few used a compar-ison group that followed consensus guidelines for weight loss.2,3 The reported effects of a
carbohy-drate-restricted diet on risk factors for atheroscle-rosis have varied.2-4 We performed a study designed
to test the hypothesis that severely obese subjects with a high prevalence of diabetes or the metabolic syndrome would have a greater weight loss, without detrimental effects on risk factors for atherosclero-sis, while on a carbohydrate-restricted (low-carbo-hydrate) diet than on a calorie- and fat-restricted (low-fat) diet.
s u b j e c t s
The study was approved by the institutional review board at the Philadelphia Veterans Affairs Medical Center, and an approved consent form was signed by each subject. Inclusion criteria were an age of at least 18 years and a body-mass index (the weight in kilograms divided by the square of the height in meters) of at least 35. Exclusion criteria were a se-rum creatinine level of more than 1.5 mg per decili-ter (132.6 µmol per lidecili-ter); hepatic disease; severe, life-limiting medical illness; inability of diabetic subjects to monitor their own glucose levels; active participation in a dietary program; or use of weight-loss medications. During an enrollment period that lasted from May to November 2001, 132 subjects from the Philadelphia Veterans Affairs Medical Cen-ter were randomly assigned to either the low-car-bohydrate diet or the low-fat diet, with use of a pre-established algorithm generated from a random set of numbers. We used stratified randomization, with blocking within strata, to ensure that each group would contain approximately equal numbers of women, subjects with diabetes, and severely obese subjects (body-mass index, 40 or higher). The study was not blinded.
s t u d y d e s i g n
The two diet groups attended separate two-hour group-teaching sessions each week for four weeks,
followed by monthly one-hour sessions for five additional months; all sessions were led by experts in nutritional counseling. Subjects received a diet-overview handout, instructional nutrition labels, sample menus and recipes, and a book on counting calories and carbohydrates.5 No specific exercise
program was recommended. The subjects assigned to the low-carbohydrate diet were instructed to re-strict carbohydrate intake to 30 g per day or less.6
No instruction on restricting total fat intake was provided. Vegetables and fruits with high ratios of fiber to carbohydrate were recommended.6 The
subjects assigned to the low-fat diet received in-struction in accordance with the obesity-manage-ment guidelines of the National Heart, Lung, and Blood Institute,7 including caloric restriction
suf-ficient to create a deficit of 500 calories per day, with 30 percent or less of total calories derived from fat.
d a t a c o l l e c t i o n
The subjects’ weights were measured monthly on a single calibrated scale (SRScales, SR Instruments). Other data collected at enrollment and at six months included waist size, self-reported medical history, blood pressure, and glucose and serum lipid levels, measured in blood specimens obtained after an overnight fast (Synchron LX20 Clinical Chemistry System, Beckman Coulter). Low-density lipopro-tein cholesterol levels were calculated according to the Friedewald formula.8 Serum insulin levels
were measured by radioimmunoassay (Laboratory Corporation of America). Insulin sensitivity was es-timated with use of the quantitative insulin-sensitiv-ity check index as follows: 1÷[(log fasting insulin level, in microunits per milliliter)+(log fasting glu-cose level, in milligrams per deciliter)]; this index has a good correlation with the results of glucose-clamp studies in obese subjects and subjects with diabetes.9 Dietary compliance was estimated by
means of a previously validated10 instrument in
which subjects are interviewed to obtain data on 24-hour recall of dietary consumption. Data were analyzed with Nutribase Management software (Cy-berSoft).
s t a t i s t i c a l a n a l y s i s
The primary end point was weight loss at six months. Assuming a two-sided type I error of 5 percent, we estimated that we would need 100 subjects (50 per group) for the study to have 80 per-cent power to demonstrate a mean (±SD) weight
t
The n e w e n g l a n d j o u r n a l of m e d i c i n e
loss that was 5±12 kg greater in the low-carbohy-drate group than in the low-fat group.11 Given an
anticipated dropout rate of 25 percent, we set the enrollment target at 135 subjects. By six months, 79 subjects remained in the study (36 in the low-fat group and 43 in the low-carbohydrate group). The primary analysis included all 132 subjects: the 79 subjects who completed the study, the 29 subjects who dropped out but had six-month data available from records of routine office visits, and the 24 sub-jects for whom the weight recorded at the last fol-low-up visit was carried forward. Since the 29 sub-jects whose final weight was obtained from office records were weighed on a different scale from that used in the study, we performed a second analysis that included all subjects, with base-line weights carried forward for all 53 subjects who dropped out. For analyses of changes in dietary intake, serum lipid levels, glycemic control, and insulin sensitivi-ty, we included all subjects, with base-line values carried forward for subjects who dropped out of the study. No interim analyses were performed.
For comparison of continuous variables between the two groups, we calculated the change from base line to six months in each subject and compared the mean changes in the two diet groups using an unpaired t-test.12 We assessed the normality of
the distribution of all variables before using the t-test. Triglyceride, insulin, and glucose levels were skewed and were therefore log-transformed for analysis. Dichotomous variables were compared by chi-square analysis.12 Linear regression and
two-way analysis of covariance models were used to cor-rect for potentially confounding variables and to identify interactions between variables and diet-group assignment.12 Missing waist sizes were
im-puted by linear extrapolation on the basis of height and weight. All P values were two-sided, and a P val-ue of 0.05 or less was considered to indicate statis-tical significance. Analyses were performed with use of SPSS software (version 10.0).
b a s e - l i n e c h a r a c t e r i s t i c s
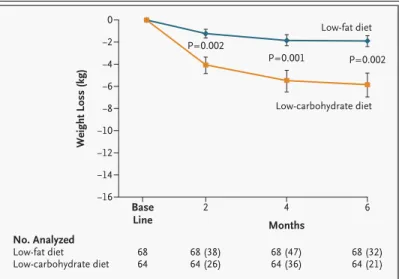
Sixty-eight subjects were randomly assigned to the low-fat diet and 64 to the low-carbohydrate diet (Fig. 1). Subjects in the two groups were well matched with regard to base-line characteris-tics (Table 1). The subjects were severely obese at base line (Table 1), with a high prevalence of dia-betes (39 percent) or the metabolic syndrome with-out diabetes (43 percent), as previously defined.13
a t t r i t i o n
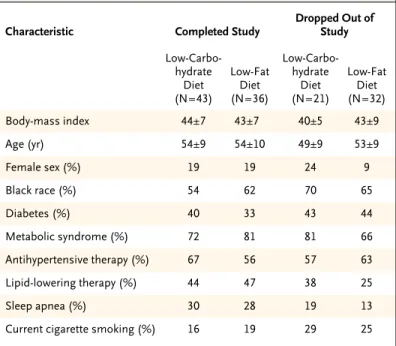
The cumulative percentage of subjects who dropped out of the study by months 1, 3, and 6 were 38, 44, and 47 percent, respectively, in the low-fat group and 25, 27, and 33 percent, respectively, in the low-carbohydrate group. Differences in attrition be-tween groups were statistically significant by the third month (P=0.03) but were not significant at six months (P=0.10). There were no significant dif-ferences between the groups in the characteristics of the subjects who dropped out of the study (Table 2). Subjects on the low-carbohydrate diet attended more dietary counseling sessions than did the sub-jects on the low-fat diet (mean, 5.7±2.7 vs. 4.3 ±2.7; P=0.006).
a s s e s s m e n t o f d i e t a r y i n t a k e
After six months of dietary counseling, subjects on the low-fat diet reported a decrease in caloric con-sumption while their macronutrient composition was close to the guidelines of the National Heart, Lung, and Blood Institute (Table 3).7 As compared
with the subjects on the low-fat diet, subjects on the low-carbohydrate diet reported a nonsignifi-cantly greater reduction in caloric intake (P=0.33), a significantly greater decrease in the percentage of calories from carbohydrates (P<0.001), and a sig-nificantly greater increase in the percentage of cal-ories from protein (P<0.001) and fat (P=0.004).
w e i g h t l o s s
Subjects on the low-carbohydrate diet lost more weight during the six-month study than did those on the low-fat diet (mean, –5.8±8.6 kg vs. –1.9± 4.2 kg; 95 percent confidence interval for the dif-ference in weight loss between groups, –1.6 to –6.3; P=0.002) (Fig. 1). The difference in weight loss between the groups remained significant after ad-justment for base-line variables alone (age, race or ethnic group, sex, line body-mass index, base-line caloric intake, and the presence or absence of hypertension, diabetes, active smoking, and sleep apnea) (P=0.002) and for base-line variables plus the number of dietary counseling sessions attend-ed (P=0.01).
A second analysis in which we carried forward the base-line weights of subjects who dropped out of the study (i.e., assumed no weight loss in these subjects) still demonstrated greater weight loss in the low-carbohydrate group than in the low-fat group (mean, –5.7±8.6 kg vs. –1.8±3.9 kg; 95 per-cent confidence interval for the difference in weight loss between groups, –1.6 to –6.2; P=0.002).
a l o w - c a r b o h y d r a t e a s c o m p a r e d w i t h a l o w - f a t d i e t i n s e v e r e o b e s i t y
As a measure of substantial weight loss, we found that a weight loss of at least 10 percent of the base-line weight occurred in 9 of 64 subjects on the low-carbohydrate diet (14 percent), as compared with 2 of 68 subjects on the low-fat diet (3 percent) (P=0.02). White subjects lost more weight than black subjects (mean, –13±19 kg vs. –5±12 kg; P= 0.009), regardless of the diet-group assignment. There were no other significant differences in weight loss between the groups.
s e r u m l i p i d s
During the six-month study, there was a greater de-crease in the mean triglyceride level in the low-car-bohydrate group than in the low-fat group (–20±43 percent vs. –4±31 percent, P=0.001) (Table 4). This difference remained significant after adjustment for base-line variables (P<0.001). Subjects on the low-carbohydrate diet also had a greater mean de-crease in triglyceride levels whether or not they were taking lipid-lowering drugs (–25±38 percent vs. –8±35 percent with lipid-lowering drugs, P=0.01; and –16±46 percent vs. –1±25 percent without lipid-lowering drugs; P=0.04). Triglycer-ide levels may also be affected by medications tak-en for diabetes. However, in a separate analysis of subjects who were not taking either diabetes medi-cations or lipid-lowering medimedi-cations (28 on the low-fat diet and 24 on the low-carbohydrate diet), we still observed a greater reduction in the mean triglyceride level among subjects on the low-carbo-hydrate diet (–20±42 percent vs. 2±28 percent, P=0.001). In a model adjusted for the amount of weight lost and the base-line variables, assignment to the low-carbohydrate diet (P = 0.01) and the amount of weight lost (P<0.001) were each inde-pendent predictors of a decrease in the triglyceride level. However, comparison of subjects within weight-loss strata demonstrated that this finding was limited to subjects who lost more than 5 per-cent of their base-line weight.
Black subjects had a smaller decrease in triglyc-eride levels than did white subjects (mean, –1±30 percent vs. –21±36 percent), independent of the diet-group assignment (P=0.002), but not after ad-justment for base-line variables and the amount of weight lost (P=0.09).
Total cholesterol, high-density lipoprotein cho-lesterol, and low-density lipoprotein cholesterol levels did not change significantly during the six-month study within or between groups (Table 4). During the study, there were no changes in
lipid-lowering therapy in the low-fat group, whereas two subjects on the low-carbohydrate diet started tak-ing a statin and one stopped taktak-ing a statin.
g l y c e m i c c o n t r o l a n d i n s u l i n s e n s i t i v i t y
The mean fasting glucose level decreased more in the low-carbohydrate group than in the low-fat group at six months (–9±19 percent vs. –2±17 per-cent, P=0.02) (Table 4). This difference remained significant after adjustment for base-line variables (P=0.004). However, the greater reduction in se-rum glucose levels in the low-carbohydrate group was limited to diabetic subjects, with no significant change in the levels in nondiabetic subjects on ei-ther diet (Table 4). Assignment to the low-carbo-hydrate diet was no longer a significant predictor of a decrease in glucose levels after adjustment for the amount of weight lost (P=0.12). There was a trend toward a greater decrease in mean glycosylat-ed hemoglobin values in diabetic subjects on the low-carbohydrate diet, as compared with those on the low-fat diet (P=0.06) (Table 4). By six months, seven subjects in the low-carbohydrate group had had dose reductions in oral hypoglycemic agents or insulin. In comparison, one subject in the low-fat group had a dose reduction in insulin and one sub-ject began oral therapy.
Insulin sensitivity was measured only in subjects
Figure 1. Mean (±SE) Decrease in Weight between Subjects on the
Low-Carbo-hydrate Diet and Those on the Low-Fat Diet.
Weights for each time point include all 132 subjects. The number of subjects at each point for whom weights were either extracted from records or carried forward from a previous visit are given in parentheses. The standard errors have not been adjusted for these imputed values.
No. Analyzed Low-fat diet Low-carbohydrate diet 68 64 68 (38) 64 (26) 68 (47) 64 (36) 68 (32) 64 (21) Weight Loss (kg) Months 0 ¡2 ¡4 ¡6 ¡8 ¡10 ¡12 ¡14 ¡16 Base Line 2 4 6 Low-fat diet Low-carbohydrate diet P=0.002 P=0.001 P=0.002
The n e w e n g l a n d j o u r n a l of m e d i c i n e
without diabetes. Among these subjects, those on the low-carbohydrate diet had a greater increase in insulin sensitivity than those on the low-fat diet (6±9 percent vs. –3±8 percent, P=0.01). This dif-ference remained significant after adjustment for base-line variables (P=0.001). In a model adjusted for the amount of weight lost and base-line varia-bles, assignment to the low-carbohydrate diet (P= 0.01) and the amount of weight lost (P<0.001) were each independent predictors of an improvement in insulin sensitivity. Comparison of subjects within
weight-loss strata demonstrated a uniformly, but nonsignificantly, greater improvement in insulin sensitivity among those on the low-carbohydrate diet within each stratum.
b l o o d p r e s s u r e
We did not observe significant overall or between-group changes in blood pressure. Systolic and dia-stolic blood pressure decreased by 2 mm Hg and 1 mm Hg, respectively, in the low-carbohydrate group. In the low-fat group, both systolic and dia-stolic blood pressure decreased by 2 mm Hg (P= 0.85 for between-group differences in the change in systolic blood pressure and P=0.70 for between-group differences in the change in diastolic blood pressure). Although many subjects were receiving antihypertensive therapy at base line (Table 1), none had a change in this therapy during the study.
a d v e r s e r e a c t i o n s
One subject on the low-carbohydrate diet was hos-pitalized with chest pain, which was ultimately de-termined to be unrelated to myocardial ischemia. One subject on the low-carbohydrate diet died from complications of hyperosmolar coma, which was thought to be due to poor compliance with drug therapy for diabetes. There was no clinically significant change in the uric acid level in either group (Table 4).
We found that severely obese subjects with a high prevalence of diabetes and the metabolic syndrome lost more weight in a six-month period on a car-bohydrate-restricted diet than on a fat- and calorie-restricted diet. The greater weight loss in the low-carbohydrate group suggests a greater reduction in overall caloric intake, rather than a direct effect of macronutrient composition. However, the explana-tion for this difference is not clear. Subjects in this group may have experienced greater satiety on a diet with liberal proportions of protein and fat. How-ever, other potential explanations include the sim-plicity of the diet and improved compliance related to the novelty of the diet.
Subjects in the low-carbohydrate group had greater decreases in triglyceride levels than did sub-jects in the low-fat group; nondiabetic subsub-jects on the low-carbohydrate diet had greater increases in insulin sensitivity, and subjects with diabetes on this diet had a greater improvement in glycemic
d i s c u s s i o n
* Plus–minus values are means ±SD. Because of rounding, percentages may not total 100. Race and the presence of diabetes, hypertension, coronary artery dis-ease, depression, current smoking, and sleep apnea were all self-reported. Sub-jects were considered to have hyperlipidemia if they reported a total cholesterol level of more than 200 mg per deciliter (5.2 mmol per liter) or were receiving lip-id-lowering therapy. There were no significant differences between groups.
Table 1. Base-Line Characteristics of the Subjects.*
Characteristic Low-Carbohydrate Diet (N=64) Low-Fat Diet (N=68) Age (yr) 53±9 54±9 Body-mass index 42.9±6.6 42.9±7.7 Weight (kg) 130.0±22.7 131.8±27.3
Systolic blood pressure (mm Hg) 133±15 135±16 Diastolic blood pressure (mm Hg) 78±11 80±9 Race or ethnic group (%)
White Black Hispanic 42 55 3 34 62 3 Sex (%) Female Male 20 80 15 85 Diabetes mellitus (%)
Treatment for diabetes Sulfonylurea Metformin Peroxisome proliferator–activated receptor g agonist Insulin 41 11 17 2 9 38 16 13 2 4 Metabolic syndrome without diabetes (%) 45 41 Hypertension (%) Antihypertensive therapy (%) 72 64 57 57 Hyperlipidemia (%) Lipid-lowering therapy Statin Gemfibrozil Niacin 51 42 3 0 50 37 0 2
Coronary artery disease (%) 16 16
Depression (%) 33 34
Current cigarette smoking (%) 20 22
a l o w - c a r b o h y d r a t e a s c o m p a r e d w i t h a l o w - f a t d i e t i n s e v e r e o b e s i t y
control. No adverse effects on other serum lipid lev-els were observed. Most studies suggest that low-ering triglyceride levels has an overall cardiovas-cular benefit.14-16 Insulin resistance promotes such
atherosclerotic processes as inflammation,17
de-creased size of low-density lipoprotein particles,18
and endothelial dysfunction.19 Impaired glycemic
control in subjects with other features of the meta-bolic syndrome markedly increases the risk of cor-onary artery disease.20 As expected, we found that
the amount of weight lost had a significant effect on the degree of improvement in these metabolic factors. However, even after adjustment for the dif-ferences in weight loss between the groups, assign-ment to the low-carbohydrate diet predicted great-er improvements in triglycgreat-eride levels and insulin sensitivity. Subjects who lost more than 5 percent of their base-line weight on a carbohydrate-restrict-ed diet had greater decreases in triglyceride levels than those who lost a similar amount of weight while following a calorie- and fat-restricted diet.
There was a consistent trend across weight-loss strata toward a greater increase in insulin sensitivi-ty in the low-carbohydrate group, although these changes were small and were not significant with-in each stratum. Although greater weight loss could not entirely account for the greater decrease in tri-glyceride levels and increase in insulin sensitivity in the low-carbohydrate group, we cannot definitively conclude that carbohydrate restriction alone ac-counted for this independent effect. Other uncon-trolled variables, such as the types of carbohydrates
selected (e.g., the proportion of complex carbohy-drates or the ratio of carbohydrate to fiber), or other unknown variables may have contributed to this ef-fect. In addition, more precise measurements of in-sulin sensitivity than we used would be needed to confirm this effect of a carbohydrate-restricted diet.
* Dietary macronutrient data are given as the mean (±SD) percentage of total calories on the basis of dietary recall by all 132 subjects, with base-line values carried forward for subjects who had dropped out of the study by six months. Because of rounding, percentages may not total 100.
† P values are for between-group comparisons and were calculated with use of the unpaired t-test.
Table 3. Change from Base Line in the Composition of the Two Diets at Six Months.*
Variable Base Line P Value† 6 Months Absolute Change P Value†
Total calories per day Low-fat diet Low-carbohydrate diet 1848±1338 2090±1055 0.25 1576±760 1630±894 –271±1260 –460±902 0.33
Protein (% of total calories) Low-fat diet Low-carbohydrate diet 16±6 17±7 0.46 16±6 22±9 1±5 6±10 <0.001
Carbohydrate (% of total calories) Low-fat diet Low-carbohydrate diet 51±14 49±17 0.41 51±15 37±18 –1±15 –13±21 <0.001
Fat (% of total calories) Low-fat diet Low-carbohydrate diet 33±12 33±14 0.66 33±14 41±16 0±14 8±18 0.004
* Plus–minus values are means ±SD. There were no significant differences be-tween groups.
Table 2. Comparison of Base-Line Characteristics between Subjects
Who Completed the Study and Those Who Dropped Out of the Study.*
Characteristic Completed Study
Dropped Out of Study Low-Carbo-hydrate Diet (N=43) Low-Fat Diet (N=36) Low-Carbo-hydrate Diet (N=21) Low-Fat Diet (N=32) Body-mass index 44±7 43±7 40±5 43±9 Age (yr) 54±9 54±10 49±9 53±9 Female sex (%) 19 19 24 9 Black race (%) 54 62 70 65 Diabetes (%) 40 33 43 44 Metabolic syndrome (%) 72 81 81 66 Antihypertensive therapy (%) 67 56 57 63 Lipid-lowering therapy (%) 44 47 38 25 Sleep apnea (%) 30 28 19 13
The n e w e n g l a n d j o u r n a l of m e d i c i n e
* Plus–minus values are means ±SD. The analysis includes all 132 subjects, with base-line values carried forward for sub-jects who had dropped out of the study by six months. To convert values for cholesterol to millimoles per liter, multiply by 0.02586. To convert values for triglycerides to millimoles per liter, multiply by 0.01129. To convert values for glucose to millimoles per liter, multiply by 0.05551.
† P values are for between-group comparisons and were calculated with use of the unpaired t-test.
‡ The low-density lipoprotein cholesterol level was not calculated in one subject on the low-carbohydrate diet who had a tri-glyceride level of more than 400 mg per deciliter (4.5 mmol per liter).
§ Insulin sensitivity was calculated only in subjects without diabetes with use of the quantitative insulin-sensitivity check index as follows: 1÷[(log fasting insulin level)+(log fasting glucose level)].
Table 4. Changes from Base Line in Serum Lipid, Glucose, Glycosylated Hemoglobin, and Uric Acid Levels
at Six Months.*
Variable Base Line P Value† 6 Months
Absolute Change P Value† Triglycerides (mg/dl) Low-fat diet Low-carbohydrate diet 176±120 188±176 0.65 169±110 150±171 –7±54 –38±80 0.001 Total cholesterol (mg/dl) Low-fat diet Low-carbohydrate diet 192±30 181±52 0.14 192±40 184±48 –1±29 2±34 0.53
High-density lipoprotein cholesterol (mg/dl) Low-fat diet Low-carbohydrate diet 41±10 41±11 0.73 40±11 41±10 –1±7 0±5 0.55
Low-density lipoprotein cholesterol (mg/dl)‡ Low-fat diet Low-carbohydrate diet 118±29 114±36 0.52 121±27 118±40 3±18 5±23 0.77 Insulin sensitivity§ Low-fat diet Low-carbohydrate diet 0.32±0.03 0.31±0.03 0.86 0.31±0.03 0.33±0.03 –0.01±0.03 0.02±0.03 0.01
Glucose level in all subjects (mg/dl) Low-fat diet Low-carbohydrate diet 124±47 128±53 0.61 122±46 117±48 ¡2±21 ¡11±24 0.017
Glucose level in nondiabetic subjects (mg/dl) Low-fat diet Low-carbohydrate diet 103±14 102±14 0.65 104±15 100±11 1±10 –2±11 0.60
Glucose level in diabetic subjects (mg/dl) Low-fat diet Low-carbohydrate diet 158±61 168±63 0.57 153±62 142±68 –5±31 –26±31 0.01
Insulin level without diabetes medication (µU/ml) Low-fat diet Low-carbohydrate diet 18±10 22±20 0.28 19±11 16±14 1±10 –6±16 0.008
Insulin level with diabetes medication (µU/ml) Low-fat diet Low-carbohydrate diet 36±26 40±42 0.66 36±25 32±27 0±20 –8±30 0.25
Glycosylated hemoglobin value in diabetic subjects (%) Low-fat diet Low-carbohydrate diet 7.4±1.5 7.8±1.2 0.42 7.4±1.8 7.2±1.7 0.0±1.0 –0.6±1.2 0.06 Uric acid (mg/dl) Low-fat diet Low-carbohydrate diet 6.6±1.4 6.3±1.4 0.5 6.5±1.2 6.4±1.4 –0.2 0.1 0.10
a l o w - c a r b o h y d r a t e a s c o m p a r e d w i t h a l o w - f a t d i e t i n s e v e r e o b e s i t y
Many of our subjects were taking lipid-lowering medications and hypoglycemic agents. Although enrolling these subjects introduced confounding variables, it allowed the inclusion of subjects with the obesity-related medical disorders typically en-countered in clinical practice. Analyses from which these subjects were excluded still revealed greater improvements in insulin sensitivity and triglycer-ide levels on a carbohydrate-restricted diet than on a fat- and calorie-restricted diet.
Our study included a high proportion of black subjects, a group previously underrepresented in lifestyle-modification studies. As compared with the white subjects, the black subjects had a smaller overall weight loss. Future studies should explore whether greater weight loss in this population can be achieved by more effective incorporation of cul-turally sensitive dietary counseling.
The high dropout rate in our study occurred very early and affected our findings. The very early drop-out of these subjects may indicate that attrition most closely reflected base-line motivation to lose weight, rather than a response to the dietary intervention itself.
Taken together, our findings demonstrate that severely obese subjects with a high prevalence of
diabetes and the metabolic syndrome lost more weight during six months on a carbohydrate-restricted diet than on a calorie- and fat-carbohydrate-restricted diet. The carbohydrate-restricted diet led to greater improvements in insulin sensitivity that were in-dependent of weight loss and a greater reduction in triglyceride levels in subjects who lost more than 5 percent of their base-line weight. These findings must be interpreted with caution, howev-er, since the magnitude of the overall weight loss relative to our subjects’ severe obesity was small, and it is unclear whether these benefits of a car-bohydrate-restricted diet extend beyond six months. Furthermore, the high dropout rate and the small overall weight loss demonstrate that die-tary adherence was relatively low in both diet groups. This study proves a principle and does not provide clinical guidance; given the known bene-fits of fat restriction, future studies evaluating long-term cardiovascular outcomes are needed before a carbohydrate-restricted diet can be en-dorsed.
Supported by funding from the Veterans Affairs Healthcare Net-work Competitive Pilot Project Grant.
We are indebted to Drs. Michael Grippi and Stephen E. Kimmel for their detailed review of and comments on the manuscript.
r e f e r e n c e s
1. St Jeor ST, Howard BV, Prewitt TE, Bovee V, Bazzarre T, Eckel RH. Dietary protein and weight reduction: a statement for healthcare professionals from the Nutrition Commit-tee of the Council on Nutrition, Physical Activity, and Metabolism of the American Heart Association. Circulation 2001;104: 1869-74.
2. Kennedy ET, Bowman SA, Spence JT, Freedman M, King J. Popular diets: correla-tion to health, nutricorrela-tion, and obesity. J Am Diet Assoc 2001;101:411-20.
3. Westman EC. A review of very low car-bohydrate diets for weight loss. J Clin Out-comes Manage 1999;6(7):36-40.
4. Westman EC, Yancy WS, Edman JS, Tomlin KF, Perkins CE. Effect of 6-month adherence to a very low carbohydrate diet program. Am J Med 2002;113:30-6.
5. Natow AB, Heslin J-A. The diabetes car-bohydrate & calorie counter. New York: Simon & Schuster, 1991.
6. Eades MR, Eades MD. Protein power lifeplan. New York: Warner Books, 2000:434.
7. Clinical guidelines on the identification, evaluation, and treatment of overweight and obesity in adults — the evidence report: executive summary. Obes Res 1998;6:Suppl 2:51S-63S. [Erratum, Obes Res 1998;6:464.]
8. Friedewald WT, Levy RI, Fredrickson DS. Estimation of the concentration of low-density lipoprotein cholesterol in plasma,
without use of the preparative ultracentri-fuge. Clin Chem 1972;18:499-502.
9. Katz A, Nambi SS, Mather K, et al. Quan-titative insulin sensitivity check index: a sim-ple accurate method for assessing insulin sensitivity in humans. J Clin Endocrinol Metab 2000;85:2402-10.
10.Karvetti RL, Knuts LR. Validity of the 24-hour dietary recall. J Am Diet Assoc 1985; 85:1437-42.
11.Cohen J. Statistical power analysis for the behavioral sciences. New York: Academic Press, 1977.
12.Dawson-Saunders B, Trapp RG. Basic and clinical biostatistics. Norwalk, Conn.: Appleton & Lange, 1990.
13.Expert Panel on Detection, Evaluation, and Treatment of High Blood Cholesterol in Adults. Executive summary of the Third Report of the National Cholesterol Educa-tion Program (NCEP) Expert Panel on Detec-tion, EvaluaDetec-tion, and Treatment of High Blood Cholesterol in Adults (Adult Treat-ment Panel III). JAMA 2001;285:2486-97.
14.Sacks FM, Tonkin AM, Craven T, et al. Coronary heart disease in patients with low LDL-cholesterol: benefit of pravastatin in diabetics and enhanced role for HDL-choles-terol and triglycerides as risk factors. Circu-lation 2002;105:1424-8.
15.Rubin HB, Robins SJ, Collins D, et al. Gemfibrozil for the secondary prevention
of coronary heart disease in men with low levels of high-density lipoprotein choles-terol. N Engl J Med 1999;341:410-8.
16.Ginsberg HN. Is hypertriglyceridemia a risk factor for atherosclerotic cardiovas-cular disease? A simple question with a com-plicated answer. Ann Intern Med 1997;126: 912-4.
17.Festa A, D’Agostino R Jr, Howard G, Mykkanen L, Tracy RP, Haffner SM. Chronic subclinical inflammation as part of the insu-lin resistance syndrome: the Insuinsu-lin Resist-ance Atherosclerosis Study (IRAS). Circula-tion 2000;102:42-7.
18.Howard BV, Mayer-Davis EJ, Goff D, et al. Relationships between insulin resist-ance and lipoproteins in nondiabetic Afri-can AmeriAfri-cans, Hispanics, and non-Hispanic whites: the Insulin Resistance Atheroscle-rosis Study. Metabolism 1998;47:1174-9.
19.Stuhlinger MC, Abbasi F, Chu JW, et al. Relationship between insulin resistance and an endogenous nitric oxide synthase inhibi-tor. JAMA 2002;287:1420-6.
20.St-Pierre J, Lemieux I, Vohl MC, et al. Contribution of abdominal obesity and hypertriglyceridemia to impaired fasting glucose and coronary artery disease. Am J Cardiol 2002;90:15-8.