222 | P a g e
NON-LINEAR STATIC PUSHOVER ANALYSIS FOR
MULTI-STORED BUILDING BY USING ETABS
Polupalli Victor Paul
1, K Sampath Kumar
2 1PG Student, Dept of Civil Engineering,
Nova College of Engineering & Technology, Vijayawada, (India)
2Asst Professor, Dept of Civil Engineering,
Nova College of Engineering & Technology, Vijayawada, (India)
ABSTRACT
Pushover analysis involves certain approximations and simplifications that some amount of variation is always expected to exist in seismic demand prediction of pushover analysis. In literature, some improved pushover procedures have been proposed to overcome the certain limitations of traditional pushover procedures. The effects and the accuracy of invariant lateral load patterns utilized in pushover analysis to predict the behavior imposed on the structure due to randomly selected individual ground motions causing elastic and various levels of nonlinear response were evaluated in this study. For this purpose, pushover analyses using various invariant lateral load patterns and Modal Pushover Analysis were performed steel moment resisting frames covering a broad range of fundamental period.The primary observations from the study showed that the accuracy of the pushover results depends strongly on the load path, properties of the structure and the characteristics of the ground motion. The accuracy of approximate procedures utilized to estimate target displacement was also studied on frame structures. The accuracy of the predictions was observed to depend on the approximations involved in the theory of the procedures, structural properties and ground motion characteristics.
Keywords: Earthquake Analysis, Static Analysis, Pushover Analysis, ETABS.
I. INTRODUCTION
The Buildings, which appeared to be strong enough, may crumble like hours of cards during earthquake and
deficiencies may be exposed. Experience gain from the recent earthquake of Bhuj, 2001 demonstrates that the
most of buildings collapsed were found deficient to meet out the requirements of the present day codes. In last
decade, four devastating earthquakes of world have been occurred in India, and low to mold intensities
earthquake of world frequently. Due to wrong construction practices and ignorance for earthquake resistant
design of buildings in our country, most of the existing buildings are vulnerable to future earthquakes. In the
simplest case, seismic design can be viewed as a row-step process. The first, and usually most important one, is
the conception of an effective structural system that needs to be configured with due regards to all important
seismic performance objectives, ranging from serviceability consideration to life safety and collapse prevention.
223 | P a g e
engineer‟s creativity to devise a system that not only fulfills seismic performance objectives, but also paystribute to functional and economic constraints imposed by the owner, the architect, and other professionals
involved in the design and construction of a building. By default, this process of creation is based on judgment,
experience, and understanding of seismic behavior, rather than rigorous mathematical formulations. Rules of
thumb for strength and stiffness targets, based on the fundamental knowledge of ground motion and elastic and
inelastic dynamic response characteristics, should involve a demand/capacity evaluation at all important
performance level, which requires identification of important capacity evaluation at all important performance
level, which requires identification of important capacity parameters and prescription of acceptable values of
these parameters, as well as the prediction of the demands imposed by ground motions. Suitable capacity
parameters and their acceptable values, as well as suitable methods for demands prediction will depend on the
performance level to be evaluated. In light of these facts, it is imperative to seismically evaluate the existing
building with the Present day knowledge to avoid the major destruction in the future earthquakes. The Buildings
found to be seismically deficient should be retrofitted or strengthened.
1.1 Necessity of Non-Linear Static Pushover Analysis
The existing building can become seismically deficient since seismic design code requirements are constantly
upgraded and advancement in engineering knowledge. Further, Indian buildings built over past two decades are
seismically deficient because of lack of awareness regarding seismic behavior of structures. The widespread
damage especially to RC buildings during earthquakes exposed the construction practices being adopted around
the world, and generated a great demand for seismic evaluation and retrofitting of existing building stocks.
1.2 Pushover Analysis
The pushover analysis of a structure is a static non-linear analysis under permanent vertical loads and gradually
increasing lateral loads. The equivalent static lateral loads approximately represent earthquake induced forces. A
plot of the total base shear versus top displacement in a structure is obtained by this analysis that would indicate
any premature failure or weakness. The analysis is carried out up to failure, thus it enables determination of
collapse load and ductility capacity. On a building frame, and plastic rotation is monitored, and lateral inelastic
forces versus displacement response for the complete structure is analytically computed. This type of analysis
enables weakness in the structure to be identified. The decision to retrofit can be taken in such studies. The
seismic design can be viewed as a two-step process. The first, and usually most important one, is the conception
of an effective structural system that needs to be configured with due regard to all important seismic
performance objectives, ranging from serviceability considerations.
This step comprises the art of seismic engineering. The rules of thumb for the strength and stiffness targets,
based on fundamental knowledge of ground motion and elastic and inelastic dynamic response characteristics,
should suffice to configure and rough-size an effective structural system. Elaborate mathematical/physical
models can only be built once a structural system has been created. Such models are needed to evaluate seismic
performance of an existing system and to modify component behavior characteristics (strength, stiffness,
224 | P a g e
1.3 Purpose of Non-linear Static Pushover Analysis
The purpose of pushover analysis is to evaluate the expected performance of structural systems by estimating
performance of a structural system by estimating its strength and deformation demands in design earthquakes by
means of static inelastic analysis, and comparing these demands to available capacities at the performance levels
of interest. The evaluation is based on an assessment of important performance parameters, including global
drift, inter story drift, inelastic element deformations (either absolute or normalized with respect to a yield
value), deformations between elements, and element connection forces (for elements and connections that
cannot sustain inelastic deformations), The inelastic static pushover analysis can be viewed as a method for
predicting seismic force and deformation demands, which accounts in an approximate manner for the
redistribution of internal forces that no longer can be resisted within the elastic range of structural behavior.The
pushover is expected to provide information on many response characteristics that cannot be obtained from an
elastic static or dynamic analysis. The following are the examples of such response characteristics: The realistic
force demands on potentially brittle elements, such as axial force demands on columns, force demands on brace
connections, moment demands on
Beam to column connections, shear force demands in deep reinforced concrete spandrel beams, shear force
demands in unreinforced masonry wall piers, etc.
Estimates of the deformations demands for elements that have to form in elastically in order to dissipate the
energy imparted to the structure.
Consequences of the strength deterioration of individual elements on behavior of structural system.
Consequences of the strength determination of the individual elements on the behavior of the structural system.
Identification of the critical regions in which the deformation demands are expected to be high and that have to
become the focus through detailing.
Identification of the strength discontinuities in plan elevation that will lead to changes in the dynamic
characteristics in elastic range.
Estimates of the understory drifts that account for strength or stiffness discontinuities and that may be used to
control the damages and to evaluate P-Delta effects.
Verification of the completeness and adequacy of load path, considering all the elements of the structural
system, all the connections, the stiff nonstructural elements of significant strength, and the foundation system
II. LIMITATIONS OF PUSHOVER ANALYSIS
Although pushover analysis has advantages over elastic analysis procedures, underlying assumptions, the
accuracy of pushover predictions and limitations of current pushover procedures must be identified. The
estimate of target displacement, selection of lateral load patterns and identification of failure mechanisms due to
higher modes of vibration are important issues that affect the accuracy of pushover results.
Target displacement is the global displacement expected in a design earthquake. The roof displacement at mass
Centre of the structure is used as target displacement. The accurate estimation of target displacement associated
225 | P a g e
2.1 Nonlinear Behavior of Structural Elements
The nonlinear behavior of building structure of a building structure depends on the nonlinear response of the
elements that are used in the lateral force resisting system. Therefore, before applying any nonlinear analysis
method on a building structure, the nonlinear behavior of such elements must be clearly described and
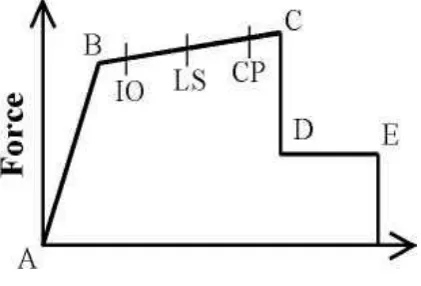
evaluated. In FEMA-273, the generalized load deformation relation of a structural member while exhibiting
nonlinear behavior is shown in figure. After the member yields (When applied load/yield load proportion (Q/Qy)
is equal to 1), the subsequent strain hardening accommodation the strain hardening in the load-deformation
relation as the member d7 Element Description.In ETABS, a frame element is modeled as a line element having
linearly elastic properties and nonlinear force-displacement characteristics of individual frame elements are
modeled as hinges represented by a series of straight line segments. A generalized force-displacement
characteristic of a non-degrading frame element (or hinge properties) in ETABS.
Fig. 2.1. Force-Deformation for Pushover Hinge
Point A corresponds to unloaded condition and point B represents yielding of the element. The ordinate at C
corresponds to nominal strength and abscissa at C corresponds to the deformation at which significant strength
degradation begins. The drop from C to D represents the initial failure of the element and resistance to lateral
loads beyond point C is usually unreliable. The residual resistance from D to E allows the frame elements to
sustain gravity loads. Beyond point E, the maximum deformation capacity, gravity load can no longer be
sustained. Hinges can be assigned at any number of locations (potential yielding points) along the span of the
frame element as well as element ends. Uncoupled moment (M2 andM3), torsion (T), axial force (P) and shear
(V2 and V3) force-displacement relations can be defined. As the column axial load changes under lateral
loading, there is also a coupledP-M2-M3 (PMM) hinge which yields based on the interaction of axial force and
bending moments at the hinge location. Also, more than one type of hinge can be assigned at the same location
of a frame element. There are three types of hinge properties in ETABS. They are default hinge properties,
user-defined hinge properties and generated hinge properties. Only default hinge properties and user-user-defined hinge
226 | P a g e
When these hinge properties (default and user-defined) are assigned to a frame element, the programautomatically creates a new generated hinge property for each and every hinge. Default hinge properties could
not be modified and they are section dependent. When default hinge properties are used, the program combines
its built-in default criteria e-forms towards the expected strength.
III. METHODOLOGY
3.1 Capacity Curve
It is the plot of the base shear v, on a structure, against the lateral deflection, d, of the roof of the structure as
shown in Fig. 3.1 This is often referred to as the pushover curve.
Fig 3.1 Pushover curve
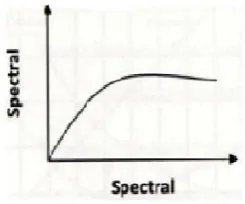
3.2 Capacity Spectrum
It is the capacity curve transformed from shear force roof displacement (v vs d) coordinates into spectral
accelerations vs. spectral displacements ( vs ) coordinates as shown in Fig 3.2
Fig 3.2 Capacity curve
3.3 Demand
It is a representation of the earthquake ground motion or shaking that the building is subjected to. In nonlinear
static analysis procedures, demand is represented by an estimation of the displacements or deformation that the
structure is expected to undergo. This is in contrast to conventional, linear elastic analysis procedure in which
227 | P a g e
3.4 Elastic response spectrum
The locus of the demand points in the ADRS plot is referred to as the demand spectrum. The demand spectrum
corresponds to the inelastic deformation of the building.
3.5 Performance point
The „performance point „ is the point where the capacity curves crosses the demand curves as shown in fig. 3.3
If the performance point exists and the damage state at this point is acceptable, the structure satisfies the target
performance level.
Fig 3.3 Determination of Performance Point
3.6 Modeling Aspects of building elements
Beams and columns are modeled as line elements and slab as membrane element. Nonlinearity in structure is
achieved by considering material nonlinearity only. Geometric nonlinearity is ignored. Nonlinear plastic hinges
are assigned to all of the primary elements. Default moment hinges (M3) are assigned to beam elements and
default axial moment2-moment3 hinges (PMM) are assigned to column elements. The hinge features are shown
in Fig3.4 for rigid floor idealization the floor diaphragms are modeled by assigning diaphragm constraint and for
flexible floor idealization the method of constraining the diaphragm is presented. The model with all the above
features created in ETABS is reproduced.
Lateral Load Calculations for rigid floor idealization:
The total base shear is given by
Vb = Ah.W
Where Ah = is the design horizontal seismic coefficient.
228 | P a g e
Qpi = Lateral loads as per IS: 1893 – 2002 and ATC – 40 at each floor levelW = Total seismic weight the structure
Wi = Seismic weight floor of i
hi = High of floor measured from base
n = is the number of leaves at which the masses are lumped
IV. CONCLUSION
1. The frame behaved linearly elastic up to a base shear value of around 180 KN at the value of base shear
360 KN it depicted non-linearity in its behavior. Increase in deflection has been observed to be drop
down with load increments at base shear of 360 KN.
2. The frame has shown variety of failures like beam-column joint failure, flexural failure and shear
229 | P a g e
3. The Pushover Analysis was including 8 steps it has been observed that one sub sequent push tobuilding, hinges started forming in beams first. Initially hinges were in A-B stage and subsequently
proceeding to B-IO stage. Out of 198 hinges 194 in A-B stage, 4 in B-IO stage. Overall performance of
building is said to be B-IO stage.
REFERENCES
[1] ATC 40-“Seismic Evaluation and Retrofit of Concrete Buildings”, Applied Technology Council, November
1996.
[2] Chopra AK. Dynamics of Structures: theory and applications to earthquake engineering. Englewood Cliffs,
NJ; 1995.
[3] FEMA-273-“NEHRP Guidelines for the Seismic Rehabilitation of Buildings”, Federal Emergency
Management Agency, October 1997.
[4] ETABS User‟s Manual, “Integrated Building Design Software”, Computer and Structures Inc. Berkeley,
USA.