Florida International University
FIU Digital Commons
FIU Electronic Theses and Dissertations University Graduate School
6-19-2018
Three Essays on Financial Statement Comparability
MOHAMMAD NAZRUL ISLAMMOHAMMAD NAZRUL ISLAM, [email protected]
DOI:10.25148/etd.FIDC006875
Follow this and additional works at:https://digitalcommons.fiu.edu/etd Part of theAccounting Commons
This work is brought to you for free and open access by the University Graduate School at FIU Digital Commons. It has been accepted for inclusion in FIU Electronic Theses and Dissertations by an authorized administrator of FIU Digital Commons. For more information, please [email protected]. Recommended Citation
ISLAM, MOHAMMAD NAZRUL, "Three Essays on Financial Statement Comparability" (2018).FIU Electronic Theses and Dissertations. 3760.
FLORIDA INTERNATIONAL UNIVERSITY Miami, Florida
THREE ESSAYS ON FINANCIAL STATEMENT COMPARABILITY
A dissertation submitted in partial fulfillment of
the requirements for the degree of
DOCTOR OF PHILOSOPHY
in
BUSINESS ADMINISTRATION by
Mohammad Nazrul Islam
ii To: Dean Joanne Li,
College of Business
This dissertation, written by Mohammad Nazrul Islam, and entitled Three Essays on Financial Statement Comparability, having been approved in respect to style and intellectual content, is referred to you for judgment.
We have read this dissertation and recommend that it be approved.
_______________________________________ Abhijit Barua _______________________________________ Suchismita Mishra _______________________________________ Kannan Raghunandan _______________________________________
Clark Wheatley, Major Professor
Date of Defense: June 19, 2018
The dissertation of Mohammad Nazrul Islam is approved.
_______________________________________ Dean Joanne Li, College of Business _______________________________________
Andrés G. Gil, Vice President for Research and Economic Development
and Dean of the University Graduate School
iii DEDICATION
I would like to dedicate this dissertation, Three Essays on Financial Statement Comparability, to those wonderful people who supported me during my journey. The first person is my honorable, respected, deceased father, Mohammad Abed Ali, who was always there for me. Second person is my mother, who has always dreamed on me and supported me to go ahead. The most important person without whose supports and encouragement I would not be able to complete this work is my wife, Ratna Akter. I am truly thankful for having you in my life. This work is also dedicated to my princess, Nazia Islam Sanam, who has always missed me when I was working at the office. I am sorry, Sanam, I am always there for you wherever I am. I also dedicate this dissertation to my mentor and trusted friend, Shofiqur Rahman, who has always shared his experiences that helped me a lot. It would not be complete if I fail to recognize the contributions of two persons who have always encouraged me to exceed the expectations of professors. They are none other than Dr. Abhijit Barua and Mrs. Anoma Barua. Above all, I would like to dedicate this work to my respected advisor, Dr. Clark Wheatley, who has always given me incredible supports, astute advice, and guidance. I will miss the golden time I spent with him.
iv
ACKNOWLEDGMENT
I would like to express my heartiest thanks and gratitude to my honorable advisor, Dr. Clark Wheatley, for giving me the room to develop and for his tireless support. He has taken his time to read my sentences and did the painstaking editing. Under his guidance, I have learned how to generate ideas and implement them. He is not only a guide for my academic matters, but he also is a guide to the right career path. He is incredibly organized and a great problem solver. I will always remember my time with him. I would like to thankfully recognize the sincere support of Md Tanvir Pavel, who was always there for me. I would also like to gratefully acknowledge the valuable comments and suggestions of my committee memebrs: Dr. Kannan Raghunandan, Dr. Abhijit Barua, and Dr. Suchismita Mishra.
v
ABSTRACT OF THE DISSERTATION
THREE ESSAYS ON FINANCIAL STATEMENT COMPARABILITY by
Mohammad Nazrul Islam Florida International University, 2018
Miami, Florida
Professor Clark Wheatley, Major Professor
Comparability is a central feature of financial reporting systems. Comparability is defined by FASB (2010, 19) as “the qualitative characteristic that enables users to identify and understand similarities in, and differences among, items.” The Accounting Principles Board ranked comparability as one of the most important objectives of financial reporting and Generally Accepted Accounting Principles have underscored the importance of comparability for the past four decades. Using empirical measures of financial statement comparability, studies confirm that comparability plays an important role in analyst following, audit fees, credit risk, acquisition decisions, stock price volatility, the cost of debt, the cost of equity, and cash holdings. This dissertation, investigates the impact of comparability on trade credit, earnings management through classification shifting, and on non-Big4 auditors. Prior studies find that comparable firms enjoy a lower cost of equity capital and a lower cost of debt. They should, therefore, require less trade credit. I also find that comparable smaller and/or financially distressed firms require less trade credit whereas they normally require higher levels of trade credit. The results presented in my first essay support this hypothesis in that comparability and trade credit are significantly negatively associated. The results presented in my second essay show that managers’ earnings
vi
management through classification shifting is significantly influenced by the degree of financial statement comparability with other firms. I also find that comparable firms engage in less classification shifting and that the impact of comparability is more pronounced after the passage of the Sarbanes Oxley Act. The results presented in my third essay show that companies audited by non-Big4 auditors are less comparable than the companies audited by Big4 auditors. Non-Big4 auditors are thus less likely to be able to apply the same audit process to multiple clients. I find that this results in greater audit effort, as proxied by higher audit fees, for Non-Big4 firms.
vii
TABLE OF CONTENTS
CHAPTER PAGE
I. INRODUCTION………... 1
II. ESSAY 1: FIRM COMPARABILITY AND TRADE CREDIT……… 6
II.1. Motivation………... 6
II.2. Literature and Hypothesis development………... 11
II.3. Research Design……….. 16
II.4. Empirical Results………. 19
II.5. Summary……….. 30
List of References……… 31
Appendix……….. 36
III. ESSAY 2: ACCOUNTING COMPARABILITY AND CLASSIFICATION SHIFTING………... 54
III.2. Motivation...……….... 54
III.2. Literature and Hypothesis Development.………... 61
III.3. Research Design...………... 70
III.4. Empirical Results..………. 76
III.5. Summary..……….. List of References……… 85
Appendix……….. 92
IV. ESSAY 3: BIG4, NON-BIG4 AUDITORS AND ACCOUNTING COMPARABILITY………. 109
IV.1. Motivation..……… 109
IV.2. Literature and Hypothesis Development……… 112
IV.3. Research Design...………... 115
IV.4. Empirical Results…..………. 118
IV.5. Summary..……….. 123
List of References……… 123
Appendix……….. 126
VITA……… 137 82
viii
LIST OF TABLES
TABLES PAGE
ESSAY 1: FIRM COMPARABILITY AND TRADE CREDIT
Table 1 – Descriptive Statistics and Tests of Differences: High versus Low
Comparability- Panel A - Descriptive Statistics………... 37
Table 1 – Descriptive Statistics and Tests of Differences: High versus Low Comparability- Panel A - Descriptive Statistics………... 38
Table 2 Pearson Correlation Coefficient Matrix……….. 39
Table 3 Baseline Regressions - Panel A: OLS and Tobit regression [Column (1) to Column (2)]……….…………... 40
Table 3 Baseline Regressions - Panel B: Fama-McBeth and Logit regression [Column (3) to Column (4)]……….….... 41
Table 4 Quantile Regressions - Panel A: Quantile 10th to 25th ………... 43
Table 4 Quantile Regressions - Panel B: Quantile 50th to 90th ………... 44
Table 5 Endogeneity Controls - Panel A - Lag Value of Financial Statement Comparability on Trade Credit ………... 45
Table 5 Endogeneity Controls - Panel B - Firm-fixed effects………. 46
Table 5 Endogeneity Controls - Panel C - Instrumental Variable Regressions... 47
Table 6 Change in Trade Credit and Changes in Comparability ……… 48
Table 7 Cross section analysis: Financial Distress and Firm Size………... 49
Table 8 Robustness Tests: Panel A - Alternative measures of Trade Credit…... 50
Table 8 Robustness Tests: Panel B - Alternative measures of Financial Statement Comparability ………. 51
Table 8 Robustness Tests: Panel C - Additional Control Variables [Column (1) to Column (2)]………. 52
Table 8 Robustness Tests: Panel C - Additional Control Variables [Column (3) to (5)]………... 53
ix
ESSAY 2: ACCOUNTING COMPARABILITY AND CLASSIFICATION SHIFTING
Table 1 Sample Selection……… 95
Table 2 Descriptive Statistics……….. 96
Table 3 Pearson Correlation Coefficients: Panel A- (Shifter to Litigation)……… 97
Table 3 (Continued) Pearson Correlation Coefficients: Panel B- (SOX to Z-Score)……….. 98 Table 4 Impact of Accounting Comparability on Classification Shifting……... 99
Table 5 Impact of Lagged Comp_Acct on Classification Shifting ………. 100
Table 6 First Stage and Second Stage Regressions………. 101
Table 6 (continued): Second Stage Regressions……….. 102
Table 7 Channel Through Which Financial Statement Comparability is Associated with Classification Shifting ……….. 103
Table 8 Impact of Accounting Comparability on Cost of Goods Sold Classification Shifting……….. 104
Table 9 Impact of Lagged Comp_Acct4 on COGS_Shifter and XSGA_Shifter… 105 Table 10 Second Stage Regressions of Classification Shifting on Comparability.. 106
Table 11: Impact of Comparability on Classification After the Passage of SOX... 107
IV. ESSAY 3: BIG4, NON-BIG4 AUDITORS AND COMPARABILITY Table 1 Number of sample firms by industry……….. 128
Table 2 Number of firms by auditor type: Big4 vs Non-Big4………. 129
Table 3 Descriptive Statistics ………. 130
Table 4 Correlation Matrix ………. 131
Table 5 Financial Statement Comparability: Big4 and Non-Big4 auditors ……… 132
x
Table 7 Alternative Measures of Comparability: Big4 and Non-Big4 ………... 134 Table 7 (Continued) Alternative Measures of Comparability: Big4 and Non-Big4 135 Table 8 Audit fees, non-Big4 and Big4 Auditors ………... 136
xi
LIST OF FIGURES
FIGURE PAGE
ESSAY 1: FIRM COMPARABILITY AND TRADE CREDIT
Figure 1: Distribution of TRADE CREDIT………... 42 ESSAY 2: ACCOUNTING COMPARABILITY AND CLASSIFICATION
SHIFTING
1
I. INTRODUCTION
“Until we can measure the amount of comparability obtained for a given level of detailed guidance, we will not be well armed with evidence on which to base discussions about the desirability of limiting the amount of detail provided in standards, when the intent of that detail is increased comparability.”
---Katherine Schipper (2003)
Comparability, unlike other qualitative characteristics, is one of the enhancing qualitative characteristics that augment the usefulness of information (FASB 2010). Comparability is the quality of information that enables users to identify and understand similarities and differences between items. Even though Statement of Financial Accounting Concept No. 2 (FASB 1980) considered comparability as second to relevance and faithful representation, the Framework (1989) stated that comparability is as important as relevance and faithful representation. SFAC No. 8 states that “Investing and lending decisions essentially involve evaluations of alternative opportunities, and they cannot be made rationally if comparative information is not available.” (FASB 2010, p. 26). Despite the importance of accounting comparability, there is still little empirical evidence on the benefits of financial statement comparability. Recent empirical measures of comparability (e.g., De Franco et al. 2011) have, however, helped scholars to investigate the role of comparability on analyst forecasts, analyst following, analyst coverage, mergers, acquisitions, audit fees, stock price crash risk, cost of equity capital, cost of debt, accruals, and real earnings management. No study has, however, yet examined whether financial statement comparability plays a role in trade credit decisions, classification shifting of operating expenses, and the behavior of non-Big4 and Big4 auditors in auditing comparable clients.
2
This dissertation examines the role of financial statement comparability in three important areas. In the first essay, I examine whether managers of comparable firms require less trade credit. Studies (Imhof et al. 2017; Fang et al. 2016) find that comparable firms enjoy a lower cost of capital and a lower cost of debt. This suggests that they can easily meet their financing needs by generating money from capital markets or financial institutions. Finance studies (e.g., Petersen and Rajan 1997; Molina and Preve 2012) document that firms facing financial difficulties require more trade credit because they are rejected by traditional financial institutions. Schwarts (1974) predicts that suppliers extend credit to firms who are credit rationed. Prior research (e.g., Kim et al. 2013; Fang et al. 2016) find that firms with better accounting comparability attract a greater number of lenders and have less credit risk, suggesting that comparable firms are less likely to be credit rationed. These theories suggest that firms with higher accounting comparability should require less trade credit. To test this prediction, I employ a sample of US listed firms over the 1987-2015 period. I find a negative relation between financial statement comparability and trade credit. The documented association is robust to alternative research designs and measures of comparability as well as trade credit, and holds after controlling for endogeneity issues. A change regression also confirms these results. To substantiate the impact of financial statement comparability on trade credit, I conduct cross-sectional tests and find that comparable smaller firms and comparable firms in financial distress, which generally use more trade credit due to their external financing constraints, require less trade credit than their less comparable peers.
The second essay examines whether firms with higher accounting comparability are less likely to be engaged in earnings management through classification shifting.
3
Scholars in accounting have extensively investigated earnings management through manipulation of accruals and real activities management. The literature also expresses concern that managers use alternative forms of earnings management when one of them is constrained. A third category of earnings management, classification shifting, can also be employed (McVay 2006), and concerns about this tactic have been voiced by regulators such as SEC. Prior studies document that accounting comparability works as a monitor, and the extant literature documents significant relationships between financial statement comparability and a number of characteristics/activities. De Franco et al. (2011) find that analyst following is associated with comparability. Zhang (2012) finds an association with audit fees. Other research links comparability to: IFRS adoption (Brochet et al. 2013), Credit risk (Kim et al. 2013), valuation of seasoned equity offerings (Shane et al. 2014), stock-price crash risk (Kim et al. 2016), and the efficiency of acquisition decisions (Chen et al. 2016). Still other research has linked comparability to debt contracting (Fang et al. 2016), accrual based and real earnings management (Sohn 2016), the informativeness of stock prices about future earnings (Choi et al. 2017), and the cost of equity capital (Imhof et al. 2017). While Sohn (2016) addresses the impact of comparability on accruals and real activities management, he does not test whether comparability also plays a role in classification shifting. From the above discussion, I hypothesize that firms with better financial statement comparability are less likely to be engaged in classification shifting. Studies (e.g., McVay 2006; Fan et al. 2010) posit that a positive relation between unexpected core earnings and income-decreasing special items is an indicator of likely classification shifting. I classify a firm as a shifter if its unexpected core earnings are positive (actual core earnings less expected core earnings) and the change in special items
4
(special items in year t less special items in year t-1) is positive for fiscal year t. In additional analysis, I follow Fan and Liu (2017), and employ alternative measures of classification shifting: cost of goods sold classification shifting, and operating expense classification shifting. I adopt De Franco et al.’s (2011) proxy for financial statement comparability that is built on the idea that the output of comparable financial reporting systems (e.g., earnings) should be similar for firms with similar economic events. Using a sample of 34,686 firm-year observations, I find (consistent with Abernathy et al. 2014) that 18% of firms engage in classification shifting. I also find that financial statement comparability is significantly negatively associated with shifters. I find that 36% of the firms engage in cost of goods sold classification shifting (CS_COGS) and 14% of the firms engage in general and administrative expense classification shifting (CS_XSGA). I also find that financial statement comparability is significantly negatively associated with CS_COGS and CS_XSGA. To establish a link between financial statement comparability and classification shifting, I test whether governance is associated with comparability. I find that governance is significantly, positively associated with comparability.
My third essay examines whether Big4 and non-Big4 auditors respond to the comparability of client firms in similar way. Studies (e.g., Zhang 2018) on comparability find that firms with better financial statement comparability pay lower audit fees. Closely related literature (e.g., Cairney and Young 2006; Bills et al. 2015) find that auditors are more likely to be specialized in homogenous industries and they charge incrementally lower audit fees for homogenous clients. My results indicate that the findings of these studies are likely driven by the influence of Big4 auditors, as the Big4 audit approximately 80 percent of listed firms (Zeff and Fossum 1967; Hogan and Jeter 1999). It is therefore
5
worth investigating whether Big4 and non-Big4 auditors follow similar patterns when auditing comparable firms. I.e., are the client firms equally comparable between the Big4 and non-Big4, and do Big4 and non-Big4 auditors charge the same audit fees for comparable firms? Studies, such as Simunic (1980), find that big audit firms charge lower audit fees because they have economies of scale. Smaller auditor firms that lack this scale charge higher audit fees. Since Big4 auditors audit the majority of listed companies, their client base should comprise a greater number of comparable firms. They will, therefore, be able to charge lower audit fees because they can transfer the knowledge learned and audit processes designed, to many, similar clients. In contrast, non-Big4 auditors are likely to have fewer comparable clients, and will thus be less likely to achieve economies of scale. As a result, they are more likely to charge higher audit fees. Following this intuition, I hypothesize that firms audited by non-Big4 auditors are less comparable than firms audited by the Big4, and that non-Big4 auditors charge higher audit fees for auditing comparable firms. Using U.S. firm data for the years 2000 to 2015, I find that firms audited by Big4 auditors are more comparable than firms audited by non-Big4 auditors. I also find that Big4 auditors charge incrementally lower audit fees for auditing comparable firms, and non-Big4 auditors charge incrementally higher audit fees for auditing comparable firms. These findings are robust to alternative measures of comparability and hold after controlling for endogeneity. The remainder of this dissertation is structured as follows: Chapter II discusses the role of financial statement comparability on trade credit. Chapter III narrates whether comparable firms are less likely to be engaged in earnings management through classification shifting. Finally, Chapter IV investigates whether Big4 and non-Big4 auditors follow the similar patterns in auditing comparable firms.
6
II. ESSAY 1: FIRM COMPARABILITY AND TRADE CREDIT II. 1. Motivation
Comparability is one of the four enhancing qualitative characteristics of accounting information.1 As a central feature of the financial reporting system, comparability is defined by the FASB (2010, p. 19) as “the qualitative characteristic that enables users to identify and understand similarities in, and differences among, items.” One of the main purposes of financial reporting standards is to increase the comparability of reported financial information. Using empirical measures of financial statement comparability, prior studies have confirmed that comparability plays an important role in analyst following (De Franco, Kothari, and Verdi 2011; De Franco, Hope, and Larocque 2015), audit fee (Zhang 2012), credit risk (Kim, Kraft, and Ryan 2013), acquisition decisions (Chen, Collins, Kravet, and Mergenthaler 2018), stock price volatility (Kim, Li, Lu, and Yu 2016), the cost of debt (Fang, Li, Xin, and Zhang 2016), the cost of equity capital (Imhof, Seavey, and Smith 2017), and the informativeness of stock prices (Choi, Choi, Myers, and Ziebart 2017). The role of accounting comparability in one of the most important financing decisions firms face - trade credit - is, however, heretofore unexplored.
Trade credit is recorded as accounts payable on a borrowing firm’s balance sheet and as accounts receivable on a lending firm’s balance sheet. Trade credit is the single most important source of short-term external financing for most firms (Petersen and Rajan 1997). It is used by more than 80 percent of all firms and constitutes more than 20 percent of all firm liabilities (Jain 2001). Despite the magnitude of these items, trade credit has
1 FASB (2010, 19) in its Statement of Financial Accounting Concepts No. 8 mentions four enhancing
7
been largely ignored by accounting research. I address a portion of this research gap by enriching the understanding of the role of financial statement comparability in firms’ trade credit decisions. Specifically, I examine the relation between financial statement comparability and firms’ reliance on trade credit. My results indicate that financial statement comparability is inversely related to trade credit. This result is important because it sheds light on the relation between accounting comparability and short-term financing decisions, which is one of the prime objectives of standard setters.2
Existing studies in finance3 and accounting4 suggest several reasons why financial
statement comparability and trade credit may be related. First, since comparable firms enjoy a lower cost of capital (Imhof et al. 2017, Fang et al. 2016), they can easily meet their financing needs through the credit and equity markets. Alternatively, Petersen and Rajan (1997) and Molina and Preve (2012)conclude that firms facing financial difficulties require more trade credit because they are rejected by traditional financers. In his economic model, Schwartz (1974) predicts that suppliers extend credit to firms who are credit
2Statement of Financial Accounting Concepts (SFAC) No. 8 states that “Investing and lending decisions
essentially involve evaluations of alternative opportunities, and they cannot be made rationally if comparative information is not available.” (FASB 2010, p. 26).
3 In his economic model of trade credit, Schwartz (1974) predicts that larger, more financially secure
producers offer trade credit to firms who are “rationed” from the direct credit market. To protect their investments, Smith (1987) argues, suppliers extend trade credit to firms not able to secure alternative low-cost financing. Empirically, Petersen and Rajan (1997) find that because of their comparative advantage in acquiring information about buyers, suppliers lend to constrained firms whose access to capital markets is limited. When banks’ monitoring costs are higher, they prefer to lend credit through a channel of suppliers (Jain 2001) because suppliers have the added advantage of having private information. Trade credit is a way for buyers to circumvent the noncompetitive rents of financial institutions (Emery 1984).
4 De Franco et al. (2011) empirically find that financial statement comparability is positively associated with
the number of analyst following and it lowers the cost of acquiring information. Kim, Li, Lu, and Yu (2016) argue that comparable firms’ information asymmetry is lower. Comparable firms enjoy lower cost of debt (Fang, Li, Xin, and Zhang 2016) and lower cost of capital.
8
rationed from direct credit markets. Studies in accounting5 find that firms with greater
financial statement comparability attract a greater number of lenders, a greater number of uninformed participating lenders, and exhibit lower credit risk. This suggests that comparable firms are less likely to be credit rationed, and it follows that financial statement comparability and trade credit should be negatively associated.
Second, prior research (e.g., Wittenberg-Moerman 2008; Healy and Palepu 2001) finds that information asymmetry is negatively associated with the cost of capital. Consistent with this, Cheng and Pike (2003) note that both buyers and sellers are more likely to be attracted to trade credit when there is high information asymmetry between them. Comparable firms should, however, exhibit lower information asymmetry (Kim et al. 2016) as peer monitoring prevents managers from hiding information. Because financial statement comparability works as a monitoring device, and financial institutions can invest less time and lower the cost of monitoring comparable firms, financial institutions would, ceteris paribus, be more likely to extend credit to comparable firms. This would reduce the dependence of comparable firms on trade credit.
Third, greater comparability facilitates information transfer among the comparable firms (De Franco et al. 2011), lowers information acquisition costs, increases the quality and quantity of information to the outsiders, and decreases the uncertainties related to performance evaluation. Together these works to reduce the external financing constraints on firms, which again should reduce their reliance on trade credit.
9
Fourth, suppliers do not perform in depth analyses of the financial statements of buyers when they extend trade credit (Smith 1987). This suggests comparability is of no concern to suppliers, and that a lack of comparability will cause firms to seek out trade credit. Based on the above I predict that firms with greater (lesser) financial statement comparability require less (more) trade credit.
To test my prediction, I employ a sample of U.S. listed firms over the 1987-2015 period. I find a negative relation between financial statement comparability and trade credit. The documented association is robust to alternative research designs and measures of comparability as well as alternative measures of trade credit. The association also holds after controlling for endogeneity. Change regression also confirms the documented results. To substantiate the impact of financial statement comparability on trade credit, I conduct cross-sectional tests and find that while smaller firms and firms in financial distress use more trade credit, comparable firms in that group require less trade credit than their less comparable peers.
This study contributes to the literature in several ways. First, this paper contributes to the literature on corporate financing. Prior studies (e.g., Schwartz 1974; Smith 1987; Petersen and Rajan 1997; Jain 2001; Molina and Preve 2012) have investigated the determinants of trade credit. No study has yet, however, investigated whether accounting comparability might also be a determinant in trade credit decisions.6 I establish that accounting comparability is an important determinant in trade credit decisions.
6Accrual quality is within firm accounting quality whereas comparability is between firm accounting quality. Discretionary accruals affect accounting outcomes, whereas the quality of earnings affects accounting comparability. Studies on audit fees (Gul, Chen, and Tsui 2003 vs Zhang 2018), cost of debt (Bharat, Sunder, and Sunder 2008 vs Fang et al. 2016), cost of capital (Francis, Nanda, and Ohlson 2008 vs Imhof, Seavey, and Smith 2017), and acquisition decisions (McNichols and Stubben 2015 vs Chen et al. 2018) suggest that
10
Studies on trade credit (e.g., Schwartz 1974; Smith 1987; Biais and Gollier1997) document that suppliers want to form long-term relationships with buyers who are smaller, have been credit rationed, and are not transparent in reporting. This indicates that firms that have good relationships with their suppliers and do not have easy access to external financing have less motivation to prepare comparable financial statements. I deal with this potential endogeneity in several ways— (1) I use the lag of the independent variables [reverse causality is mitigated] (2) I employ instrumental variables and two-stage regressions, and (3) I employ firm fixed-effects to control for time-invariant firm-specific characteristics that may be correlated with omitted variables. Next, my study contributes to the growing literature investigating the impact of accounting comparability on financial markets. The role of accounting comparability has been investigated with respect to the impact of accounting comparability on external financial--debt and equity financing (Fang et al. 2016; Imhof et al. 2017), but no study has yet examined the role of comparability on trade credit, the most commonly used source of short-term financing.7 Third, this study also helps regulators in the sense that it confirms the benefits of accounting comparability.8
The remainder of the paper is structured as follows. Section 2 discusses the literature and develops the hypotheses. Section 3 explains the research design. Section 4 presents my results. Section 5 concludes the paper.
discretionary accruals and accounting comparability are different from each other. Indeed, FASB (1980, 2010) has termed comparability as an accounting “quality.” Please see Appendix B for more information.
7 Wilner (1996) notes that in the US economy for each $1 in short-term debt, there was $1.94 in trade credit.
In my sample, trade credit is 8% of total assets whereas the remaining short-term liabilities comprise only 4% of total assets. Before the financial crisis in 2007-2009, about 90% of the global merchandise trade was financed by trade credit (Klapper, Laeven, and Rajan (2011).
8Investing and lending decisions essentially involve evaluations of alternative opportunities, and they cannot
11 II. 2. Literature and Hypothesis development Financial Statement Comparability
The Statement of Financial Accounting Concepts (SFAC) No. 2 states that comparability is a qualitative characteristics of accounting information (FASB 1980), and the Statement of Financial Accounting Concepts No. 8 states that comparability is an enhancing qualitative characteristic (FASB 2010). FASB defines financial statement comparability as the extent to which an information user can recognize the similarities and differences in the financial performance of two firms. SFAC No. 8 states that “Investing and lending decisions essentially involve evaluations of alternative opportunities, and they cannot be made rationally if comparative information is not available.” (FASB 2010, p. 26). One of the objectives of accounting information is to help investors compare the performance of different firms so that they can make informed decisions. The U.S. FASB and the International Accounting Standards Board (IASB) developed a common conceptual framework, based on and built on both the IASB framework and the FASB framework. This framework mentions comparability as an important decision-useful qualitative characteristic of financial information (FASB 2010). The Securities and Exchange Commission (SEC) has also emphasized financial statement comparability across firms. SEC Chairman, Mary Jo White, in her Public Statement on January 5, 2017, stated, for example, that “Building high-quality, globally accepted accounting standards requires that the Commission support further efforts by the FASB and IASB on convergence between their accounting standards to enhance the quality and comparability of financial reporting – both domestically and across borders.” (SEC 2017).
12
Other qualitative characteristics (e.g., value relevance, persistence, predictability), have received more attention than comparability in the accounting literature. Holthausen and Watts (2001) mention, for example, 62 papers on value relevance that were published in top tier journals, yet despite the importance of comparability in the conceptual framework of accounting (FASB 1980, 2010), prior literature has paid little attention to financial statement comparability. The paucity of research on comparability was likely due to lack of a standard comparability measure. Schipper (2003 expresses the concern as follows:
“…until we can measure the amount of comparability obtained for a given level of detailed guidance, I will not be well armed with evidence on which to base discussions about the desirability of limiting the amount of detail provided in standards, when the intent of that detail is increased comparability.” (Schipper 2003, p. 68)
After the development of De Franco et al.’s (2011) measure of financial statement comparability, researchers responded to the call of Schipper (2003) for more research on accounting comparability. There are two streams to this research. One has investigated the impact of events (e.g., IFRS adoption) on accounting comparability. Here, accounting numbers are deemed comparable if, when two firms face the same economic outcomes, they report similar accounting numbers (Barth et al. 2012). The other stream of research has examined the impact of accounting comparability on financial and economic phenomena.9 Because comparable firms become better benchmarks for each other,
9 The existing literature, for example, documents a significant relation between financial statement
comparability and: analyst following (De Franco et al. 2011); audit fees (Zhang 2018); accounting after the adoption of IFRS (Brochet, Jagolinzer, and Riedl 2013); credit risk (Kim et al. 2013); valuation of seasoned
13
information transfer among them becomes easy and users have access to more information about firms’ financial performance with less effort (Kim et al. 2013).
Trade Credit
There has been a long running debate among researchers on what motivates sellers and buyers to extend or receive trade credit. The two most discussed motives are financing and transactions. The financing motive (Schwartz 1974) suggests that suppliers have an advantage over traditional lenders in their access to information about the creditworthiness about their clients, and their ability to monitor and force repayment of credit. Suppliers that have easier access to capital markets than their customers can extend more credit to utilize their capacity for borrowing. The financing motive argues that in case of imperfections in the credit market, rationing of credit to borrowers leads to the use of trade credit.10
The transactions motive (Ferris 1981) argues that rather than paying suppliers as they receive goods, buyers want to cumulate obligations and pay them once a month or quarter. This process helps managers to manage cash more efficiently. Sellers also benefit because they can predict cash receipts efficiently. While financially solvent firms are likely to prefer the transactions approach, for startups and smaller firms the financing motive is crucial (they’re more likely to be rationed11 by institutional sources of credit). Based on the above discussion, I predict and test the following hypothesis in alternative form:
equity (Shane, Smith, and Zhang 2014); crash risk (Kim et al. 2016); efficiency of acquisition decisions (Chen et al. 2018); debt contracting (Fang et al. 2016); accrual based and real earnings management (Sohn 2016); informativeness of stock price about future earnings (Choi et al. 2017); and the cost of equity capital (Imhof et al. 2017).
10 See Lewellen, McConnell, and Scott (1980), Emery (1984), Schwartz (1974), Smith (1987)
14
H1a: Financial statement comparability is negatively associated with trade credit.
While my first hypothesis predicts a negative association of comparability with trade credit overall, there are two sub-populations that prior research has shown to place greater reliance on trade credit. Those populations are distressed firms and small firms. Whether my overall prediction holds for those sub-populations is thus worthy of investigation.
Financial distress
Because financially distressed firms are more likely to go bankrupt (Tsuruta and Xu 2007), their ability to acquire external financing is severely curtailed (Molina and Preve 2012). Financial distress impairs access to credit from financial institutions and raises the cost of capital (Opler and Titman 1994; Wilner 1996; Molina and Preve 2012). As a consequence, distressed firms would be more likely to use trade credit as an alternative source of financing. Peteren and Rajan (1994, 1995) theorize that when cheaper sources of external financing are exhausted, firms turn to trade credit, and Molina and Preve (2012) document that financially distressed firms use significantly larger amounts of trade credit. From the suppliers’ side, there is evidence that suppliers, in order to maintain long-term relationships, grant more concessions to customers in financial distress (Evans 1998). Therefore, financially distress firms either take more trade credit or they are provided more trade credit. As noted above, however, financial statement comparability plays a role in external financing with more comparable firms enjoying a lower cost of capital (e.g., Fang et al. 2016; Imholf 2017) and utilizing less trade credit. In this circumstance, comparability may enable lenders to better evaluate the extent of a firm’s distress and the resulting
15
likelihood of bankruptcy. Based on this, I hypothesize that comparable firms, even when they are financially distressed, will require less trade credit than less comparable distressed firms. My second hypothesis, in alternative form, is thus:
H1b: Financial statement comparability is negatively associated with trade credit for distressed firms.
Firm size
Firm size has also been shown to play a role in financing. Smaller firms suffer from information opacity because they do not enter into publicly visible contracts with their labor force, suppliers, and customers. In most cases, small firms do not issue securities in the capital markets, suggesting that there are few or no analysts following those firms. Studies (e.g., Frankel and Li 2004; Bhattacharya, Desai, and Venkkataraman 2013) document that information asymmetry is higher for smaller firms. Due to this information opacity, financial institutions are less likely to provide financing to smaller firms and when they do, the cost of debt is higher. Archer and Faerber (1966) also find that the overall cost of capital is higher for smaller firms. Schwartz’s (1974) economic model of trade credit predicts that larger, more financially secure producers offer trade credit to their smaller, less financially secure customers. Consistent with my expectations for distress, I expect that comparable smaller firms will also require less trade credit than less comparable small firms. My third hypothesis is thus:
H1c: Financial statement comparability is negatively associated with trade credit for small firms.
16 II. 3. Research Design
Sample
I start with COMPUSTAT firms for the period 1987 through 2015.12 I then merge CRSP with COMPUSTAT and remove utilities (SIC codes: 4000 to 4999) and financial services firms (SIC codes: 6000 to 6999). I also remove firm-year observations that have missing data on financial statement comparability, trade credit, and missing control variables. I winsorize all continuous variables at the 1st and 99th percentiles. My final sample comprises 38,738 firm-year observations.
Model specification:
To test the impact of financial statement comparability on trade credit, I use the following multivariate regression:
TRADECREDITit= β0+β1FSCOMP4it+ ∑βj
14
j=2
CONTROLSit+Ink+Yrt+εit (1)
I also use the following logistic regression.
PROB_TC(=1)=β0+β1FSCOMP4it+∑βj 14
j=2
CONTROLSit+Ink+Yrt+εit (1.1)
where TRADECREDITitis accounts payable (AP) scaled by total assets (AT) and FSCOMP4itis the firm specific comparability measure based on the mapping of firms’
economic events to financial statements from De Franco et al. (2011). 𝐼𝑛𝑘 and 𝑌𝑟𝑡 are included in the model to control for industry and year fixed effects respectively. PROB_TC in equation (1.1) is an indicator variable taking the value of 1 if a firm’s trade credit is
17
greater than its industry mean (based on Fama-French 48 industry) for three consecutive years and 0 otherwise. I use different regression settings because my dependent variable, trade credit, is left censored. First, I use ordinary least square (OLS) to test the linear relationship between financial statement comparability and trade credit. Second, since trade credit is left censored, I use a Tobit regression with a lower limit of zero. Third, I use the Fama-MacBeth (1973) regression. The Fama-MacBeth regression runs the regression yearly and reports the average coefficient. I have also controlled for industry fixed effects in my Fama-MacBeth regression to minimize the noise of industry differences.
The key coefficient of interest in regressions (1) and (1.1) is β1for FSCOMP4, which depicts the impact of financial statement comparability on trade credit. If financial statement comparability helps managers to acquire lower cost external financing (Fang et al. 2016; Imhof et al. 2017), trade credit should be lower and β1 should be negative. Following prior studies (e.g., Petersen and Rajan 1997; Jain 2001; Atanasova 2007; Fabbri and Klapper 2016; Chen et al. 2018), I include 14 control variables. I control for: firm size (log of the book value of total assets); the market to book ratio (MTB); discretionary accruals (DAC); investment opportunities (TOBINQ); non-cash current assets relative to total assets (CA); cash holdings (CASHHOLD); profitability (ROA); current liabilities excluding accounts payable divided by total assets (CL_XTRADE); the debt ratio (LEVERAGE); inventory liquidation cost (LIQUIDCOST); firm age (AGE); market share (MARKETSHARE); industry competition (COMPETITION); and positive sales
18
(POS_SALE) which is an indicator variable taking the value of 1 if sales increased from year t-1 to t, and 0 otherwise.13
Measuring Financial Statement Comparability
I follow the De Franco et al. (2011) measure of financial statement comparability, which is based on the earnings-returns relationship of paired firms. De Franco et al. (2011) develop an empirical model based on the assumption that for a given set of economic events, two firms produce similar financial results. Following De Franco et al. (2011), I first estimate the following:
Earningsit = αi+ βiReturnit+ εit (2)
where Earnings is the quarterly net income before extraordinary items (IBQ) scaled by beginning of the period market value of equity (PRCC_F*CSHO), and Return is the respective quarter’s stock return. I calculate α̂i and β̂i for firm i and in the same way I estimate α̂j and β̂j for firm j. I then use these parameters to estimate expected earnings of
firm i and j. I use the Return of firm i and the parameters of i and j to compare the Earnings of firm i and j as follows:
E(Earnings)iit = α̂i+ β̂iReturnit (3) E(Earnings)ijt = α̂j+ β̂jReturnij (4)
Keeping the economic event, Returnit, constant, I calculate predicted earnings of firm 𝑖 𝑎𝑛𝑑 𝑗 for the period t. Then I compute the accounting comparability between firm i and j (FSCOMP4ijt) from the following:
13I do not include bid-ask spread (a measure of information asymmetry) in my tabulated results as I am
only able to acquire this metric for 25% of my sample observations. Inclusion of that variable for the resulting sub-sample yields, however, results consistent with those presented in the paper.
19 FSCOMPijt
=-1
16*∑|E(Earningsiit)-E(Earningsijt)| t
t-15
(5)
The smaller the difference between the predicted earnings of i and j, the more comparable are the two firms’ accounting systems. I estimate comparability for each firm i-firm j combination for J firms within the same two-digit SIC industry classification. Then I rank all J values of FSCOMPijt for each firm 𝑖 from the highest to lowest. Next I
calculate FSCOMP4it as the average of highest four comparability score of
firm i with firm j. I also compute FSCOMP10, COMP_INMDN, and COMP_INDMEAN. The detailed calculations of these measures are defined in Appendix A.
II. 4. Empirical Results
Summary statistics and univariate results
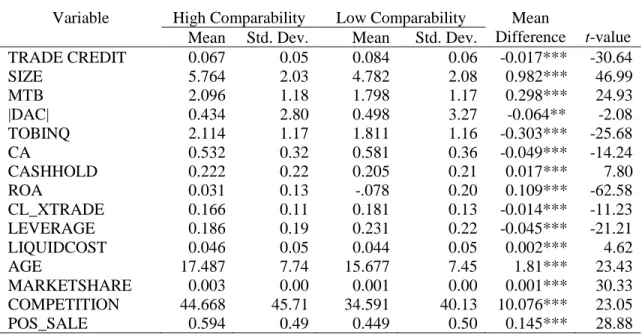
Panel A of Table 1 reports the summary statistics for the variables employed in the main regression. TRADE CREDIT has a mean (median) of 0.08 (0.06). Financial statement comparability (FSCOMP4) is negative by construction, with a less negative value indicating greater comparable. The FSCOMP4 has a mean (median) of -0.53 (-0.29). These values are consistent with those of recent studies (e.g., Fang et al. 2016; Kim et al. 2016; Imhof et al. 2017). SIZE (log of assets) has a mean (median) of 5.27 (5.11), MTB has a mean (median) of 1.95 (1.51), TOBINQ has a mean (median) of 0.47 (0.09). The mean (median) firm in my sample has |DAC| of 1.96 (1.53), CA of 0.56 (0.51), CASHHOLD of 0.21 (0.13), ROA of -0.02 (0.03), and CL_XTRADE of 0.17 (0.14). The mean (median) firm AGE is 16.58 (15.00) years, indicating that my sample firms are mature. The mean values of LEVERAGE, LIQUIDCOST, MARKETSHARE, COMPETITION, and
20
POS_SALE are 0.21, 0.05, 0.01, 39.59, and 0.52 respectively. These values are also consistent with the recent studies (e.g., Wu et al. 2014; Goto et al. 2015; Chen et al. 2017).
I divide firms into two groups: firms with high financial statement comparability and low financial statement comparability, based on the median score of FSCOMP4. Firms with a FSCOMP4 score above the median are classified as high comparable firms whereas those with FSCOMP4 scores below the median are classified as low comparable firms. Panel B of Table 1 reports the univariate comparisons of my model variables by high versus low financial statement comparability. The mean of TRADE CREDIT in the high comparable group is 0.067, while the low comparable group has a mean of. The t-statistic for the mean difference is -30.64, suggesting that the difference is statistically significant at the 1% level. Most of the mean differences between the two groups are statistically significant and support my prediction that high comparable firms require less TRADE CREDIT.
The correlation coefficients for variables included in the main analyses are presented in Table 2. Across the sample period, FSCOMP4 is significantly (p-value ≤ 0.000) and negatively (-0.17) correlated with TRADE CREDIT. FSCOMP4 is also significantly correlated with other firm specific variables, and these characteristics are also significantly correlated with TRADE CREDIT. TRADE CREDIT, for example, is significantly negatively correlated with SIZE, MTB, CASHHOLD, and ROA, suggesting that firm characteristics should be controlled in my multivariate analysis.
Multivariate results
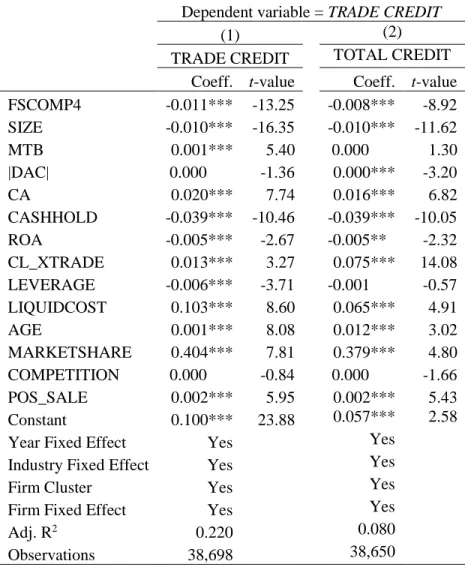
The results of my multivariate regressions are reported in Table 3. Column (1) presents the OLS results with both year and industry fixed effects. The standard errors are
21
clustered by firm. The coefficient of -0.012 on FSCOMP4 is significant at the 1% level. The result is also economically significant as firms require 7.65 percent less trade credit with a one standard deviation increase in the financial statement comparability.14 I find that firm SIZE, TOBINQ, CASHHOLD, and LEVERAGE are negatively associated with TRADE CREDIT, which is consistent with prior studies (e.g., Petersen and Rajan 1997; Biais and Gollier 1997). The Variables CA, MARKETSHARE, and POS_SALE are positively associated with TRADE CREDIT(alsoconsistent with prior studies e.g., Liu et al. 2017).
Column 2 presents the results of my Tobit model. This model implies nonnegative predicted values for TRADE CREDIT, and has sensible partial effects over a wide range of control variables. The Tobit model expresses the observed response, TRADE CREDIT, in terms of underlying latent variables as:
TRADE CREDIT∗ = β
0+ xβ + ε, u|x~Normal(0, σ2) (6)
where TRADE CREDIT= max (0,TRADE CREDIT*) (7)
Equation (7) suggests that TRADE CREDIT will be equal to TRADE CREDIT* when TRADE CREDIT*≥0, but TRADE CREDIT will equal 0 when TRADE CREDIT*<0. Since TRADE CREDIT* is normally distributed, TRADE CREDIT has a continuous distribution over positive values. The coefficient of FSCOMP4 is negative (-0.013) and significant at the 1% level. Again, this indicates that firms with high financial statement comparability require less trade credit. The signs of all control variables are consistent with prior studies.
147.65=0.51*0.012/0.08, where the standard deviation of FSCOMP4 is 1.48, 0.012 is the coefficient of
22
Column (3) of Table 3 presents the results of my Fama-MacBeth (1973) regression. Assigning equal weight to each firm-year observation, the Fama-MacBeth technique runs each regression cross-sectionally for each year and then aggregates the coefficients across the years. The results are consistent with my other models in suggesting that financial statement comparability is negatively associated with trade credit.
Finally, I employ a logit model to test the probabilistic relation between financial statement comparability and trade credit. The result of this test is presented in column (4) of Table 3. PROB_TCis an indicator variable taking the value of 1 if firm trade credit is greater than the industry-adjusted mean of trade credit within same two-digit SIC industry for three consecutive years and 0 otherwise. The results are consistent with my prior models and support the hypothesis that comparable firms require less trade credit.
Quantile regression
Figure 1 shows the distribution of TRADE CREDIT. (the variable is right skewed). The most commonly used regression model for determining the relation between the predicted and predictor variables is ordinary least squares (OLS), which assesses how the mean value of a predicted variable of a conditional distribution fluctuates with the changes in the independent variable(s). OLS may, however, give us an incomplete picture (e.g., Mosteller and Tuke 1977; Koenker and Hallock 2001; Koenker 2005) because the mean of a distribution may not be the representative of the entire distribution (e.g., Austin and Schull 2003). In a skewed distribution, for example, the median of the distribution is alternatively used as central tendency (e.g., Wilcox and Keselman 2003; Manikandan 2011). While OLS can answer whether the independent variable is important or has an impact on the dependent variable, to know the complete influence of the predictor
23
variable(s) on the predicted variable, analysis of the tail of a distribution is necessary (e.g., Austin and Schull 2003). Quantile regression addresses this by offering a more complete picture of a distribution (Koenker 2005), and studies in accounting (e.g., Basu 2005; Armstron et al. 2015), finance (e.g., Connolly 1989; Zietz et al. 2008; Meligkotsidou et al. 2009; Lee and Li 2012), and economics (E.g., Buchinsky 1995; Koenker and Park 1996; Koenker and Hallock 2001; Machado and Mata 2005) have used quantile regression to overcome the limitations of OLS. Because my predicted variable, trade credit, is right skewed, I also use quantile regression to measure the impact of accounting comparability on the different quantiles of trade credit.
The results of these tests are reported in Table 4. From my OLS results, I found that a one standard deviation increase in FSCOMP4 was associated with a 7.65 percent decrease in TRADE CREDIT. My quantile regression results show, however, that at the 10th quantile a one standard deviation increase in FSCOMP4 is associated with only a 1.27 percent decrease in TRADE CREDIT. At the 90th quantile TRADE CREDIT decreases 21.03 percent with a one standard deviation increase in FSCOMP4. These results indicate that OLS overestimates the impact of FSCOMP4 at the 10th quantile and underestimates FSCOMP4 at the 90th quantile. The tests of differences between the 10th and 90th, 25th and 90th, 50th and 90th, and 75th and 90th quantile coefficients are also reported in Table 4. These
results indicate that FSCOMP4 has a heterogenous impact on different levels of TRADE CREDIT.
Endogeneity
The relation between financial statement comparability and trade credit may be biased because of potential endogeneity related to omitted variables and reverse causality.
24
Firms with high comparability, for example, take less trade credit. This suggests that firms that take less trade credit are more likely to have high financial statement comparability. Since trade credit generates new accounting items (e.g., accounts payable, discounts, and accounts receivable) in firm financial statements, firms with less or no trade credit are more likely to have less complex and more transparent accounting reports (Chen et al. 2017). In other words, since firms (especially small and startup firms) do not employ financing from financial institutions and capital markets, instead maintaining good relationship with suppliers - they have less motivation to make their financial statements comparable. Existing studies (e.g., Smith 1987; Schwartz 1974) find that while providing credit to buyers, suppliers do not perform any credit analysis. It is intuitive, therefore, that trade credit may also influence financial statement comparability. To mitigate this potential endogeneity concern, I use several methods.
Endogeneity—Lag of Explanatory Variable
Following prior studies (Nagar and Rajan 2001; Miguel et al. 2004; MacKay and Philips 2005; Collier 2013; Lehoucq and Linan 2014; Sohn 2016),I use the lag value of the independent variables to mitigate potential endogeneity between trade credit and financial statement comparability. Lagged independent variables also deal with simultaneity where the explanatory variable is jointly determined with the dependent variable (Clemens et al. 2012). The results of these tests are reported in Table 5, Panel A. Column (1) of presents the results of my OLS regression and column (2) reports results of my Fama-MacBeth (1973) regression with industry fixed effects. The coefficients on FSCOM4 are negative and significant for both the OLS and Fama-MacBeth regressions.
25
This supports my main results of a negative association between financial statement comparability and trade credit.
Endogeneity—Omitted variables
To mitigate the omitted variable bias, I perform a firm-fixed effects regression analysis. The inclusion of firm-fixed effects control for unobserved firm characteristics that may be correlated with omitted explanatory variables and removes any purely cross-sectional correlation between financial statement comparability and trade credit. The use of a fixed effects approach addresses omitted variables bias arising from unobserved firm level time-invariant heterogeneity. The results for these tests are reported in Table 5, Panel B. In column (1), the dependent variable is TRADE CREDIT, computed as accounts payable (AP) divided by total assets (AT). In column (2), the dependent variable is total payables computed as accounts payable (AP) and notes payable (NP) divided by total assets (AT). Again, the coefficients on FSCOMP4 are negative
Endogeneity—Instrumental Variable
My previous empirical tests are predicted on the assumption that financial statement comparability determines whether firms require trade credit. It is also possible that financial statement comparability is lower for firms that use more trade credit. I use the lead and lag approach to conduct a Granger causality test and find that trade credit may, indeed, cause financial statement comparability. To address this concern, I employ a two-stage regression. In the first two-stage, I regress FSCOMP4 on all exogenous variables and use the fitted value of FSCOMP4 in the second stage. Following prior studies (Sohn 2016; Lee et al. 2016), I choose: firm SIZE; the market to book ratio (MTB); profit (PROFIT); discretionary actuals (DAC); Z-Score (Z-SCORE); return on assets (ROA); CL_XTRADE;
26
LEVERAGE; the book value of equity (BVE); firm age (AGE); market share (MARKETSHARE); TOBINQ; GROWTH; SOX; and regulated industry (REGUL) as my exogenous variables. The results of my reported in Table 5, Panel C. Column (1) presents the first stage regression. Firm SIZE, AGE, TOBINQ, CRISIS, GROWTH, PROFIT, and ZSCORE are positively associated with financial statement comparability. MTB, DAC, ROA, LEVERAGE, SOX, REGUL,andMARKETSHAREare negatively associated with comparability. The adjusted R2 of the first stage regression is 21.2%, which is consistent with prior research.15 I then use the fitted value of FSCOMP4 and repeat the regression
from Table 3. The results are reported in column (2) of Table 5, Panel C. The coefficient on Predicted (FSCOM4) is negative (coeff. = -0.024) and significant at the 1% level. This suggests that omitted variables do not affect my main results that financial statement comparability is negatively associated with trade credit. In sum, the above results suggest that my documented association between financial statement comparability and trade credit is not driven by endogeneity.
Changes Analysis
To further confirm the association between financial statement comparability and trade credit, I conduct change analyses. I investigate whether changes in trade credit are explained by changes in financial statement comparability. First, I examine the impact of changes in financial statement comparability and control variables on changes in trade credit. Second, I create two additional dichotomous variables: IN_TRADECREDIT (an increase in trade credit) and DEC_TRADECREDIT(a decrease in trade credit)to test the
27
impact of changes in ∆FSCOM4. Consistent with my hypothesis above, I predict a negative association between ∆FSCOMP4 and TRADE CREDITin an overall change regression. I also predict that there will be a negative relation between ∆FSCOMP4 and IN_TRADECREDIT and a positive association between ∆FSCOM4 and DEC_TRADECREDIT. I replace the dependent variable, TRADE CREDIT, in the main regression equation by ∆TRADE CREDIT, IN_TRADECREDIT, and DEC_TRADECREDITrespectivelyas follows:
∆TRADECREDIT=β0+β1∆FSCOMP4it+∑15j=2βj∆CONTROLSit+FYi+Indi+εit (8)
IN_TRADECREDIT=β0+β1∆FSCOMP4it+∑βj
15
j=2
∆CONTROLSit+FYi+Indi+εit (9)
DEC_TRADECREDIT=β0+β1∆FSCOMP4it+∑15j=2βj∆CONTROLSit+FYi+Indi+εit (10)
where ∆ indicates the change in a variable from year t-1 to t. IN_TRADE CRDIT is an indicator variable taking the value 1 if the change in trade credit from year t-1 to t is positive and 0 otherwise. DEC_TRADE CREDIT is an indicator variable taking the value of 1 if the change in trade credit from year t-1 to t is negative, and 0 otherwise. The results are presented in Table 6. In column (1), the OLS regression coefficient on FSCOMP4is negative (coeff. = -0.002) and significant at the 1% level, indicating that changes in trade credit are explained by changes in financial statement comparability. In column (2), the logit regression coefficient on FSCOMP4 is significantly negative (p ≤ 0.05), suggesting that increases in trade credit are negatively associated with changes in financial statement comparability. In column (3), the coefficient on FSCOMP4 is positively significant (p ≤ 0.05), indicating that decreases in trade credit are positively associated with financial
28
statement comparability. Taken together, the results presented in Tables 3 through 6 provide considerable support for Hypothesis 1a that, overall, financial statement comparability is negatively associated with the use of trade credit.
Financial distress
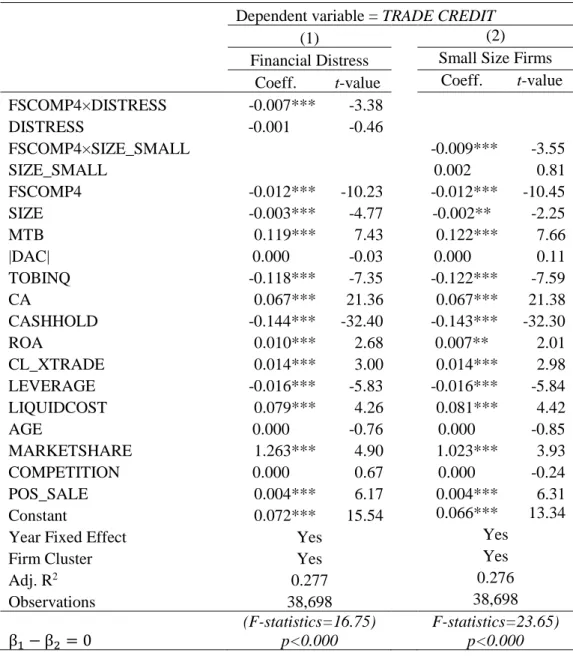
Because financially distressed firms are more likely to use trade credit per se, I investigate whether my overall results hold for a subsample of distressed firms. I test Hypothesis 1b by employing the interest coverage ratio as my measure of distress. Following prior studies (e.g., Asquith et al. 1994; Arnold et al. 2014; Corbae and D’Erasmo 2017) I create an indicator variable DISTRESS that is equal to 1 if the interest coverage ratio (earnings before interest divided by interest and related expense), is below 0.80 in any fiscal year and 0 otherwise. The results of my tests are presented in column (1) of Table 7. The coefficient on FSCOMP4×DISTRESS is negative and significant at the 1% level, and the coefficient on DISTRESS is insignificant. The test for difference between the coefficients of FSCOMP4×DISTRESS and DISTRESS is highly significant and indicates that comparable financially distressed firms take less trade credit than less comparable firms.
Firm size
Like distressed firms, smaller firms have also been shown to utilize more trade credit overall. To test whether comparability has any impact on this, I divide my sample into two groups: small and large, separated at the median. SIZE_SMALL is an indicator variable equal to 1 if a firm’s size is less than the median of size, and 0 otherwise. The results of my tests are presented in column (2) of Table 7. The coefficient on FSCOMP4×SIZE_SMALL is significantly negative, (p ≤ 0.01) and the test for difference
29
between the coefficients of FSCOMP4×SIZE_SMALL and SIZE_SMALL is also significant (p ≤ 0.01),
Robustness checks
My results may be driven by the firm specific measure of financial statement comparability, biased due to the measure of trade credit, or driven by omitted variables. To address these potential concerns, I use: three alternative measures of financial statement comparability; three alternative measures of trade credit; and add additional control variables.
Alternative measures of financial statement comparability
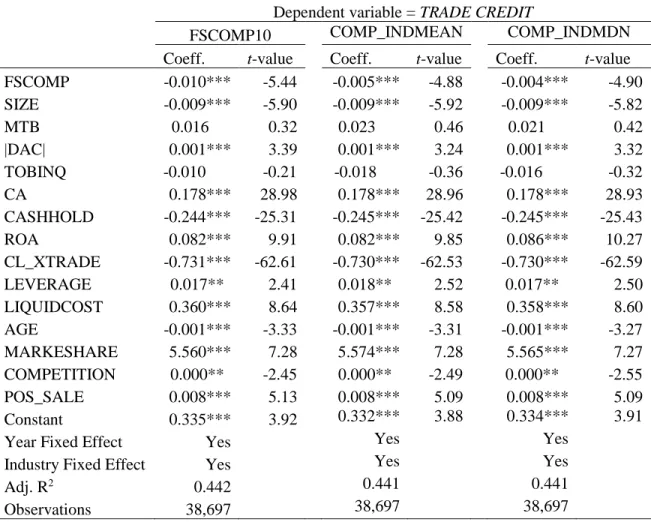
My main regression analysis is based on the most commonly used financial statement comparability measure (FSCOMP4). To control for industry effects and as a robustness check, I employ three alternative measures of comparability. I use (1) FSCOMP10, computed as the average of top-10 firms’ FSCOMP score (e.g., De Franco et al. 2011 p.901); (2) COMP_INDMEAN, which is the average FSCOMP of all firm i's FSCOMP scores in the same two-digit SIC group; and (3) COMP_INDMDN, which is the median FSCOMP score for all firms j in the same two-digit SIC group as firm i. The results of these tests are reported in columns (1), (2), and (3) of Table 8, Panel A. The coefficients on all comparability measures are significantly negative, indicating that the results of out main regression presented in Table 3 are robust to alternative measures of comparability.
Alternative measures of trade credit
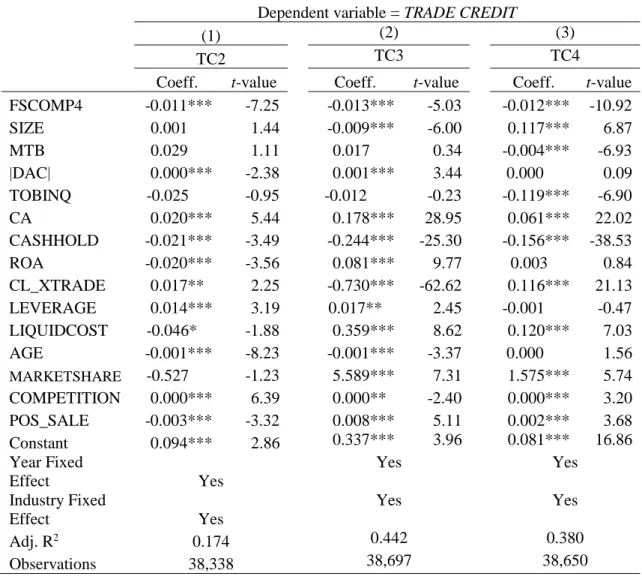
The documented result in my analysis may be driven by the choice of trade credit measures. To address this concern, I employ three alternative measures of trade credit. Following prior studies (e.g., Love et al. 2007; Molin and Preve 2012), I use TC2,
30
computed as accounts payable (AP) scaled by cost of goods sold (COGS), TC3 calculated as accounts payable (AP) divided by total current liabilities (LCT), and TC4 computed as accounts payable (AP) plus notes payable (NP) divided by total assets (AT). The results, reported in Table 8, Panel B, are consistent with my results presented in Table 3.
Additional control variables
Because my results may be driven by omitted variables, I rerun my tests after including the additional control variables SALEGROWTH, INV_TURN, AP_TURN, INFOASYM, and PROFIT (prior studies by Smith 1987; Petersen and Rajan 1997; and Molina and Preve 2012 find that these variables are associated with TRADE CREDIT). The results of these tests are reported in Table 8, Panel C. In each instance the coefficient on FSCOMP4 is significantly negative.
II. 5. Summary
This investigation examines the effect of financial statement comparability on trade credit. How financial statement comparability influences trade credit is a topic worthy of examination given the sheer magnitude of trade credit as a financing mechanism, and the fact that trade credit is generally a costly alternative to external financing. I find an overall negative relation between financial statement comparability and trade credit. I also find a negative relation between comparability and trade credit for two groups of firms that known to rely significantly on trade credit: distressed firms and small firms. The findings I document are significant both statistically and economically, and are robust to consideration of alternative measures of comparability and trade credit. These findings add to my understanding of how comparability impacts economic behavior - specifically the role of financial statement comparability in short-term financing decisions. In addition, my


![Table 8 Robustness Tests: Panel C - Additional Control Variables [Column (1) to (2)]](https://thumb-us.123doks.com/thumbv2/123dok_us/9878596.2481334/64.918.229.743.245.794/table-robustness-tests-panel-additional-control-variables-column.webp)
![Table 8 Robustness Tests: Panel C - Additional Control Variables [Column (3) to (5)]](https://thumb-us.123doks.com/thumbv2/123dok_us/9878596.2481334/65.918.182.803.247.820/table-robustness-tests-panel-additional-control-variables-column.webp)
