ISSN: 2088-8708, DOI: 10.11591/ijece.v6i4.9800 1880
Efficient Feature Subset Selection Algorithm for High
Dimensional Data
Smita Chormunge1, Sudarson Jena21 Department of Computer Science and Engineering, GITAM University, Hyderabad, India 2 Department of Information Technology, GITAM University, Hyderabad, India
Article Info ABSTRACT
Article history: Received Dec 26, 2015 Revised Jun 13, 2016 Accepted Jun 27, 2016
Feature selection approach solves the dimensionality problem by removing irrelevant and redundant features. Existing Feature selection algorithms take more time to obtain feature subset for high dimensional data. This paper proposes a feature selection algorithm based on Information gain measures for high dimensional data termed as IFSA (Information gain based Feature Selection Algorithm) to produce optimal feature subset in efficient time and improve the computational performance of learning algorithms. IFSA algorithm works in two folds: First apply filter on dataset. Second produce the small feature subset by using information gain measure. Extensive experiments are carried out to compare proposed algorithm and other methods with respect to two different classifiers (Naive bayes and IBK) on microarray and text data sets. The results demonstrate that IFSA not only produces the most select feature subset in efficient time but also improves the classifier performance. Keyword: Classifiers Feature selection Filters Information gain K-nearest neighbors Naive bayes
Copyright © 2016 Institute of Advanced Engineering and Science. All rights reserved.
Corresponding Author:
1. INTRODUCTION
In high dimensional data like genes data or DNA data contains large number of attributes which affect the computational cost and decrease the learning accuracy. The increase of data size in terms of number of instances and number of features becomes a great challenge for the feature selection algorithms [1]. To deal with these problems, two main dimensionality reduction approaches are typically used: feature extraction and feature selection [2]. Feature extraction method creates a new feature set where as feature selection method search the good subset from original set by removing irrelevant and redundant data. Irrelevant features contain no useful information about the classification problem where as redundant features contain information which is already present in more informative features. Feature selection useful in statistical pattern recognition, machine learning, data mining and statistics. It is also effective in enhancing learning efficiency, increasing predictive accuracy, and reducing complexity.
Given the input data D tabled as N samples and M features X={xi, i =1…M} and the target classification variable c, the feature selection problem is to find from the M-dimensional observation space, RM, a subspace of m features, Rm, that “optimally” characterizes c [3]. There are three general approaches to feature selection: Filters, Wrappers and Embedded methods [4]. Evaluation function is measures of filter, wrapper methods and embedded methods. Which are classified into three categories uncertainty measures, distance measures, and dependence measures. The data intrinsic category includes distance, entropy, and dependence measures. According to recent research evaluation function is divided into five categories: distance, information, dependence, consistency, and classier error rate. [5].
Most of the feature selection algorithms [6]-[10]have been proposed for classification techniques. Aim of all approaches is to search an optimal feature set and improve the classifier performance. Many of these feature selection algorithms use statistical measures such as mutual information, correlation and information gain measure. It also improved search approaches such as population-based heuristic search approach, genetic algorithms and ant colony optimization. Krier et al. proposed a methodology combining hierarchical constrained clustering of spectral variables and selection of clusters by mutual information [11]. Van Dijck and Van Hulle [12] presented same methodology as Krier, only difference is that consecutive features contain in every clusters. To remove redundant features both methods used agglomerative hierarchical clustering. Hybrid Features which are not relevant and redundant features also affects the speed and accuracy of learning algorithms [13].
M.A Hall used correlation measure to address the problem of feature selection for machine learning. It defines the central hypothesis where good feature sets contain features that are highly correlated with the class, yet uncorrelated with each other. CFS (Correlation based Feature Selection) is an algorithm that couples this evaluation formula with an appropriate correlation measure and a heuristic search strategy [14]. L.yu et al. introduced FCBF is a fast filter method which can identify relevant features as well as redundancy among relevant features without pair wise correlation analysis.It isbased on preprocessing step to machine learning, to filter the data which is effective in dimensionality reduction, removing, it increase the learning accuracy, and improving result comprehensibility [15]. Sakar et al. proposed Predictive Mutual Information (PMI), a hybrid measure of relevance not only is based on MI but also accounts for predictability of signals from one another as in KCCA. Authors shows that PMI has more improved feature detection capability than MI and KCCA, especially in catching suspicious coincidences that are rare but potentially important not only for subsequent experimental studies but also for building computational predictive models which is demonstrated on two toy datasets and a real intrusion detection system dataset [16].
Song Q et al. [17] proposed a Fast clustering based feature Selection algorithm (FAST) based on the MST method,. The FAST algorithm works in two steps. In the first step, irrelevant features are removed and second step redundant features are eliminated using graph-theoretic clustering method. Features in different clusters are relatively independent the clustering based strategy of FAST has a high probability of producing a subset of useful and independent features. Mitra et al. Proposed unsupervised feature subset selection method using feature similarity to remove redundancy. Authors use a new measure called maximal information compression index to calculate the similarity between two random variables for feature selection [18]. Battiti [19] introduced mutual information-based feature selection algorithm called MIFS. This algorithm considers both feature-feature and feature-class mutual information for feature selection. To search optimal features it uses a greedy technique that maximizes information about the class label. Kwak et al. [20] extended an MIFS algorithm called MIFS-U to overcome the limitations of to obtain better mutual information between input features and output classes. Peng et al. [3] introduced a mutual information based feature selection method called mRMR (MaxRelevance and Min-Redundancy) that minimizes redundancy among features and maximizes dependency between a feature subset and a class label.
In RELIEF algorithm an instance based attribute ranking scheme. It deals with incomplete, noisy and multiclass datasets. It assigns a relevance weight to each feature, samples an instance randomly from data and then locating its nearest neighbor from the same and opposite class. The values of the attributes of the nearest neighbors are compared with the sampled instance which is used to update relevance scores for each attribute [21]. Relief is extended by Kononenko [22]. Chi-Squared is common statistical test to measures difference if one assumes the feature occurrence is actually independent of the class value. It behaves unpredictably for very small expected counts, which are common in text classification. In text classification word features occurred rarely [23].
This paper proposes feature selection algorithm termed as IFSA (Information gain based Feature subset Selection Algorithm) to remove irrelevant, noisy and redundant features and produce small feature subset in efficient time as well as improve classifier performance. IFSA algorithm is based on information gain measure. IFSA works in two folds: First is to apply filter on whole dataset which makes data in uniform manner. Second is to remove irrelevant and redundant features and produce optimal feature subset by using information gain measure. For experimental results we used microarray and text datasets which features ranges from 2000 to more than 7000. Proposed algorithm is compared with other well known feature selection algorithms like Relief and chi-squared. Naive bayes and K-nearest neighbor classifier used for analyzing the results.
The rest of the paper is organized as follows. Details of proposed IFSA algorithm has been discussed in section 2. Section 3 presents the brief description of Classification methods used for analysis, Experimental Results discussed in section 4, finally section 5 of this paper presents the concluding remarks.
IJECE Vol. 6, No. 4, August 2016 : 1880 – 1888
2. IFSA FEATURE SUBSET SELECTION ALGORITHM
This section discuss proposed algorithm for obtaining optimal feature subset using filter and information gain measures named as IFSA. While evaluating high dimensional data with some well known feature selection algorithm, it takes more computational time to obtain good feature subset. To overcome this we proposed feature selection algorithm based on Information gain measure. IFSA works in two folds: First is applying discrete unsupervised attribute filter on whole datasets D such as F{x1….xn} to prepare the data in uniform manner. Second compute the information gain measure on filtered data to obtain optimal feature subset by removing irrelevant and redundant features.
2.1. Attribute Filter
In machine learning most of the classification tasks learning to nominal class values, but some may contains features that are mixed variables such as ordinal or continuous as well as nominal. To deal with such mixed variables many machine learning algorithms have been developed. Rather than dealing with mixed variable some machine learning algorithms worked on uniform data. One of the most common methods of accomplishing this is called discretization. Discretization is the process of transforming continuous valued attributes to nominal.
Discretization classified into three categories: Supervised versus Unsupervised, Global versus Local and Static versus dynamic. Class label is used for dicretization in supervised methods and unsupervised discretization is unknown about class label. It divides the range of observed values for a feature into p equal sized bins, where p is a parameter provided by the user. The difference between global and local methods is based on when discretization is performed. Features are discritize prior to induction is a Global method whereas discretization carry out during the induction process is local method. Dynamic methods search the space of possible k values at the same time for all features [24].
2.2. Information Gain
Information gain is a simplest attribute ranking method, widely used in text categorization applications and now days for microarray data analysis and image data analysis. If A is an attribute and C is the class, Equations A1 and A2 show the entropy of the class before and after observing the attribute [25].
H C log2p c ,
H(C|A) = ∑ ∑ | log2p c|a (A1)
The amount by which the entropy of the class decreases reflects the additional information about the class provided by the attribute and is called information gain. Each attribute Ai is assigned a score based on the information gain between itself and the class:
IG i = H(C) −H(C|Ai) = H(Ai)−H(Ai|C)
= H(Ai) + H(C)−H(Ai ,C). (A2)
The information gain calculate the entropy where it is a difference between the prior uncertainty and expected posterior uncertainty using X feature. Consider one example feature Y is preferred to feature Z if the information gain from feature Y is greater than that from feature. Information gain used a ranker search methodology [25].
IFSA Algorithm
Input : Data Sample D with features F(x1...xn)
Ɵ Threshold value
Output : Optimal Feature Subset Steps :
1.Apply attribute filter on training dataset D
2.Compute Information gain by using equation A1 and A2
IG H Y ⁄ //X & Y are features
4.Verify classifier performance
IFSA algorithm used unsupervised discretization approach which divides the range of observed values for a feature into p equal sized bins, this p is a parameter defined by user. This method prepared the dataset in uniform fashion. Once data arrange uniformly then calculate the information gain to find the relevant and non redundant feature subset. H (Y) and H (Y/X) are computed using equation A1 and A2. Datasets evaluated on 10-fold (k) cross-validation strategy, where the data is randomly split into 10 mutually exclusive subsets of approximately equal size. A learning algorithm is trained and tested 10 times; each time it is tested on one of the k folds and trained using the remaining k −1 folds. Information gain measure ranked the features. So here we applied threshold value Ɵ which is user defined. Features are selected whose Gain value is more than threshold values. For experimental work threshold value is defined -1.7. Features whose gain value is more than threshold values are considered in optimal subset. To verify and analyze results we used two classifiers Naïve bayes and IBK classifier. Computational time is evaluated for different datasets by using IFSA for 10 folds cross validation strategy to obtain optimal feature subset.
Time complexity analysis of proposed algorithm is calculated considering two steps. In first step considers whole dataset ‘n’. Next step computing information gain for n features it compute as O (n+n). It is equal to O (2n). Overall complexity is O (n).
3. CLASSIFICATION METHODS USED FOR ANALYSIS 3.1. Naive Bayes classifier
Naïve Bayes classifier is a simple probabilistic classifier with assumption of independence among attributes. As compare to other classifiers it provides better classification accuracy on gene expression data. This classifier learns from training data and predicting the class of the test instance with higher posterior probability. Let C ={c1,c2,...,cl} be the set of i classes, and let W ={w1,...,wm} be the set of features enclosed in these classes. Given a new document d, the probability that d belongs to class ci is given by Bayes rule,
p d| ci | A3 (A3)
Naive Bayes classifier requires number of parameters linear in the amount of features in a learning problem because of its high scalability. Many of classifier used expensive iterative operation but bayes evaluates a closed-form expression to get maximum-likelihood training with linear time [26].
3.2. K-nearest neighbor (IBK)
The K Nearest-Neighbors is a non-linear classifier which is used for experimental study. The output of this classifier is depends on two things, whether k-NN is used for classification or regression. In k-NN classification, the output is a class membership. An object is classified by a majority vote of its neighbors, with the object being assigned to the class most common among its k nearest neighbors. For example given a regularization parameter k and an example x, the k-NN technique considers the k training examples closest to x according to their distance in the feature space {0, 1}K and gives as predicted class the dominant real class among those k examples [27]. In K-NN regression, the output is the property value for the object. It calculates the average of the values of k-nearest neighbors. The algorithm is also able to calculate values continuously for a target[28]. It is sensitive to local structure of data.
4. RESULTS AND ANALYSIS
This section we present the details of datasets which is used for empirical study, experimental results obtained for proposed algorithm (IFSA) and comparison results with Relief and Chi-squared feature selection methods. This study is on different data sets such as Colon cancer, SRBCT and Lymphoma, Leukemia, CNS, DBWorld_bodies, DBWorld_bodies_stemmed which have very high features [29]. The summary of datasets used for empirical study shown in Table 1.
4.1. Dataset Description
Colon Cancer contains 62 samples collected from patients. Among them, 40 tumor biopsies are from tumors (labeled as "negative") and 22 normal (labeled as "positive") biopsies are from healthy parts of the colons of the same patients, the total number of genes to be tested is 2000. SRBCT Gene expression data (2308 genes for 83 samples) from the microarray experiments of Small Round Blue Cell Tumors (SRBCT). A total of 63 training samples and 25 test samples are provided. Lymphoma is a broad term encompassing a variety of cancers of the lymphatic system. Total number of genes is 4026 and the number of samples is 62.
IJECE Vol. 6, No. 4, August 2016 : 1880 – 1888
There are all together three types of lymphomas. The first category, Chronic Lymphocytic Lymphoma, the second type Follicular Lymphoma and the third type Diffuse Large B-cell Lymphoma. The Leukemia data set contains expression levels of 7129 genes taken over 72 samples. Labels indicate which of two variants of leukemia is present in the sample (AML, 25 samples, or ALL, 47 samples). CNS microarray dataset represent a heterogeneous group of tumors about which little is known biologically. The total number of genes is 7129 and the number of samples is 42 as shown in Table 1.
Table 1. Summary of Datasets used for empirical study
Datasets Features Instances Domain
Colon Cancer 2000 62 Microarray
SRBCT 2308 83 Microarray DBWorld_bodies_Stemmed 3722 64 Text Lymphoma 4026 62 Microarray DBWorld_bodies 4703 64 Text Leukemia 7129 72 Microarray CNS 7129 60 Microarray
DBWorld_bodies, DBWorld_bodies_stemmed are text datasets. It contains DBWorld mailing list where it classified into announces of conference and everything else. DBWorld_bodies contains 4703 attributes and 64 instances. DBWorld_bodies_stemmed contains 3722 features and 64 instances. Weka tool [30] is used for analyzing the results.
4.2. Comparison Evaluation
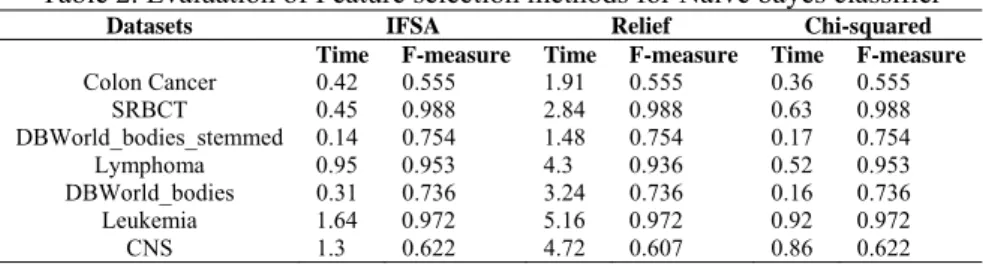
We analyses the performance of Naïve bayes and IBK Classifier by computing time and accuracy for all datasets by using IFSA, Relief and Chi-squared feature selection algorithms. Table 2 shows evaluation results of feature selection algorithms for Naïve bayes classifier. It represents the time and f-measure for all datasets by using IFSA algorithm and other two methods Chi-squared and Relief.
From results of Table 2 we found that IFSA takes less computational time to obtain feature subset for all datasets as compared to Relief method. Whereas accuracy of IFSA, Relief and Chi-squared is almost same. Computational time of Relief method increases as increasing in number of features. Comparing IFSA algorithm with chi-squared method, SRBCT dataset computational time is 0.45 sec for IFSA and 0.63 sec for chi-squared. For text data DBWorld_bodies_stemmed computational time is 0.14 sec for IFSA and 0.17 sec for Chi-squared method. Computational time of SRBCT and DBWorld_bodies_stemmed datasets is less for IFSA than Chi-squared method. Datasets Colon Cancer, Lymphoma, DBWorld_bodies, Leukemia and CNS computational time is less for Chi-squared as compared to IFSA.
Table 3 shows the evaluation of K-nearest neighbor classifier on microarray and text datasets. Here also IFSA is better in performance than Relief feature subset selection method. Relief takes large time for Leukemia and CNS dataset 6.14 and 5.61 sec respectively. IFSA algorithm is efficient in time for Colon Cancer, SRBCT, and DBWorld_bodies_stemmed as compared to chi-squared method. Accuracy of K-NN classifier for all datasets by using IFSA, Relief and Chi-squared is almost same.
Table 2. Evaluation of Feature selection methods for Naïve bayes classifier
Datasets IFSA Relief Chi-squared
Time F-measure Time F-measure Time F-measure
Colon Cancer 0.42 0.555 1.91 0.555 0.36 0.555 SRBCT 0.45 0.988 2.84 0.988 0.63 0.988 DBWorld_bodies_stemmed 0.14 0.754 1.48 0.754 0.17 0.754 Lymphoma 0.95 0.953 4.3 0.936 0.52 0.953 DBWorld_bodies 0.31 0.736 3.24 0.736 0.16 0.736 Leukemia 1.64 0.972 5.16 0.972 0.92 0.972 CNS 1.3 0.622 4.72 0.607 0.86 0.622
Table 3. Evaluation of Feature selection methods for IBK classifier
Datasets IFSA Relief Chi-squared
Time F-measure Time F-measure Time F-measure
Colon Cancer 0.19 0.774 1.55 0.774 0.28 0.774 SRBCT 0.2 0.842 3.28 0.842 0.44 0.842 DBWorld_bodies_stemmed 0.16 0.591 2.67 0.591 0.19 0.591 Lymphoma 0.44 0.97 3.16 0.97 0.63 0.97 DBWorld_bodies 0.23 0.502 2.44 0.502 0.19 0.502 Leukemia 1.28 0.873 6.14 0.873 0.61 0.873 CNS 0.99 0.571 5.61 0.571 0.78 0.571
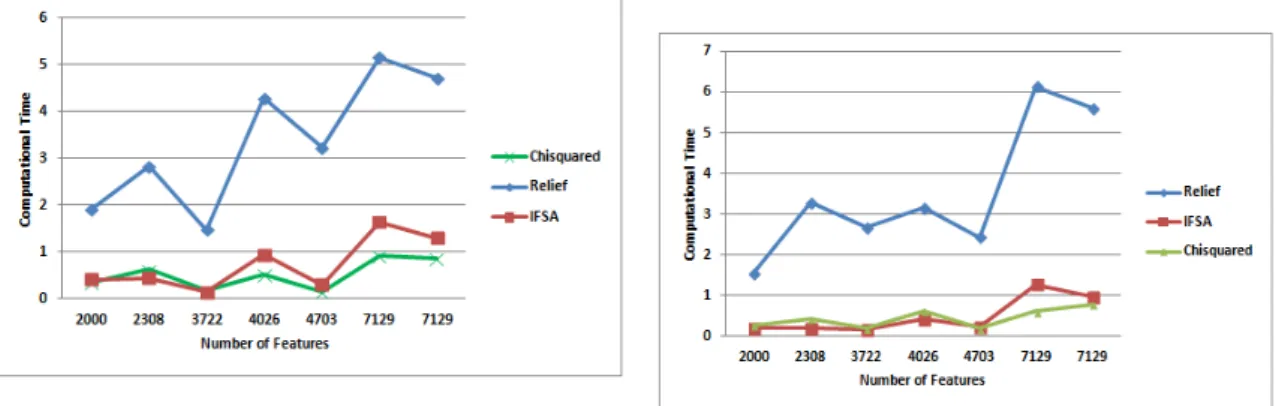
Figure 1 shows the comparison graph of feature subset selection algorithms for naïve bayes classifier. It represents the comparison of three feature selection algorithms for number of features with respect to computational time calculated in seconds. Comparison of IFSA, Relief and chi-squared method is shown in figure 1. From the results we observed that Relief method takes large time to compute optimal feature subset than other two methods. IFSA works efficiently for datasets which features ranges 2000 to 4000. A chi-squared method is efficient for large dimensional datasets like leukemia and CNS whose features are more than 7000.
Figure 2 shows the comparison graph of feature subset selection algorithms for IBK classifier. It shows the comparison of IFSA, Relief and Chi-squared feature selection methods based on computational time for different datasets. In this graph we observed that computational time of Relief method for IBK classifier is very high for all datasets as compared to other two algorithms. Computational time of IFSA algorithm is efficient than Relief algorithm and compared with Chi-squared method time varies as per the datasets.
The performance of IBK and Naïve bayes classifier for IFSA algorithm is shown in Figure 3. It shows that IBK classifier computational performance is better than Naïve bayes classifier by using proposed algorithm. Performance of IBK and Naïve bayes classifier using Relief and chi-squared method are shown in Figure 4 and 5 respectively. Here we observed that computational time is varies for both classifiers as per the datasets. Figure 6 represents the accuracy of classifiers by using IFSA algorithm. Based on observations Naïve bayes classifier is favorable in accuracy point of view. From observations, Classifiers computational performance improved by using proposed algorithm as compared with Relief algorithm and Chi-squared method.
Figure 1. Comparison graph of feature selection Figure.2. Comparison graph of feature selection algorithms for naïve bayes classifier algorithms for IBK classifier
IJECE Vol. 6, No. 4, August 2016 : 1880 – 1888
Figure 3. Performance of Classifiers for IFSA Figure 4. Performance of classifiers for Relief
algorithm algorithm
Figure 5. Performance of classifiers for Figure 6. Classifiers Accuracy using IFSA Chi-squared method Algorithm
5. CONCLUSION
In this paper, IFSA (Information gain based Feature Selection Algorithm) has been proposed to obtain optimal feature subsets in efficient time and improve computational performance of learning algorithms. IFSA works in two folds: first apply filter on training dataset. Second is to remove irrelevant and redundant features by using Information gain measure. Computational time is calculated to obtain optimal feature subset by using proposed algorithm for high dimensional data. IFSA algorithm performs remarkably well in terms of classification performance for microarray and text datasets as compared to existing algorithm like Relief and Chi-squared algorithm with respect to two classifiers Naïve bayes and IBK. The result shows that IFSA algorithm is efficient in computational time for datasets which is used for empirical study than Relief algorithm and Chi-squared method. Further we can extend this work to improve the accuracy of classifiers by using different feature selection measures.
REFERENCES
[1] T. Hlaing, “Feature Selection and Fuzzy Decision Tree for Network Intrusion Detection,” International Journal of Informatics and Communication Technology (IJ-ICT), vol/issue: 1(2), pp. 109~118, 2012. ISSN: 2252-8776. [2] P. A. Estévez, et al., “Normalized Mutual Information Feature Selection,” IEEE Transactions on Neural Networks,
vol/issue: 20(2), pp-189-201, 2009.
[3] H. Peng, et al., “Feature Selection Based on Mutual Information: Criteria of Max-Dependency, Max-Relevance,
and Min-Redundancy,” IEEE Transactions on Pattern Analysis and Machine Intelligence, vol/issue: 27(8), pp.
1226-1238, 2005.
[4] I. Guyon and A. Elisseeff, “An Introduction to Variable and Feature Selection,” J. Machine Learning Research,
vol. 3, pp. 11571182, 2003.
[5] M. Dash and H. Liu, “Feature Selection for Classification,” Intelligent Data Analysis, vol/issue: 1(3), pp. 131-156,
1997.
[6] H. Frohlich, et al., “Feature selection for support vector machines by means of genetic algorithm, in: Tools with
[7] S. W. Lin, et al., “An intelligent algorithm with feature selection and decision rules applied to anomaly intrusion
detection,” Applied Soft Computing, vol/issue: 12(10), pp. 3285–3290, 2012.
[8] L. Yu and H. Liu, “Redundancy based feature selection for microarray data,” Proceedings of the tenth ACM SIGKDD international conference on Knowledge discovery and data mining, ACM, pp. 737–742, 2004.
[9] D. K. Bhattacharyya and J. K. Kalita, “Network Anomaly Detection: A Machine Learning Perspective,” CRC Press, 2013.
[10] S. Nemati, et al., “A novel aco–ga hybrid algorithm for feature selection in protein function prediction,” Expert systems with applications, vol/issue: 36(10), pp. 12086–12094, 2009.
[11] C. Krier, et al., “Feature Clustering and Mutual Information for the Selection of Variables in Spectral Data,” Proc. European Symp. Artificial Neural Networks Advances in Computational Intelligence and Learning, pp. 157-162,
2007.
[12] G. V. Dijck and M. M. V. Hulle, “Speeding Up the Wrapper Feature Subset Selection in Regression by Mutual Information Relevance and Redundancy Analysis,” Proc. Int’l Conf. Artificial Neural Networks, 2006.
[13] R. Kohavi and G. H. John, “Wrappers for Feature Subset Selection,” Artificial Intelligence, vol/issue: 97(1/2), pp.
273-324, 1997.
[14] M. A. Hall, “Correlation-Based Feature Selection for Discrete and Numeric Class Machine Learning,” Proc. 17th Int’l Conf. Machine Learning, pp. 359-366, 2000.
[15] L. Yu and H. Liu, “Feature Selection for High-Dimensional Data: A Fast Correlation-Based Filter Solution,” Proc. 20th Int’l Conf. Machine Leaning, vol/issue: 20(2), pp. 856-863, 2003.
[16] Sakar C. O and Kursun O., “Hybrid Method for Feature Selection Based on Mutual Information and Canonical Correlation Analysis,” 20th International Conference on Pattern Recognition (ICPR), IEEE, 2010.
[17] Q. Song, et al., “Fast Clustering Based Feature Subset Selection Algorithm for High Dimensional Data,” IEEE Transactions on Knowledge and Data Engineering, vol/issue: 25(1), pp-1-14, 2013.
[18] P. Mitra, et al., “Unsupervised feature selection using feature similarity,” IEEE transactions on pattern analysis and machine intelligence, vol/issue: 24(3), pp. 301–312, 2002.
[19] R. Battiti, “Using mutual information for selecting features in supervised neural net learning,” IEEE Transactions on Neural Networks, vol/issue: 5(4), pp. 537–550, 1994.
[20] N. Kwak and C. H. Choi, “Input feature selection for classification problems,” IEEE Transactions on Neural Networks, vol/issue: 13(1), pp. 143–159, 2002.
[21] K. Kira and L. A. Rendell, “The Feature Selection Problem:Traditional Methods and a New Algorithm,” Proc. 10th Nat’l Conf.Artificial Intelligence, pp. 129-134, 1992.
[22] I. Kononenko, “Estimating Attributes: Analysis and Extensions of RELIEF,” Proc. European Conf. Machine Learning, pp. 171-182, 1994.
[23] G. Forman, “An Extensive Empirical Study of Feature Selection Metrics for Text Classification,” J. Machine Learning Research, vol. 3, pp. 1289-1305, 2003.
[24] M. A. Hall, “Correlation-Based Feature Subset Selection for Machine Learning,” PhD dissertation, Univ. of Waikato, 1999.
[25] M. A. Hall and G. Holmes, “Benchmarking Attribute Selection Techniques for Discrete Class Data Mining,” IEEE Transactions on Knowledge and Data Engineering, vol/issue: 15(3), 2003.
[26] I. S. Dhillon, et al., “A Divisive Information Theoretic Feature Clustering Algorithm for Text Classification,” J. Machine Learning Research, vol. 3, pp. 1265-1287, 2003.
[27] M. A. Hall, et al., “Fast Binary Feature Selection with Conditional Mutual Information,” J. Machine Learning Research, vol. 5, pp. 1531-1555, 2004.
[28] M. Abdar, et al., “Comparing Performance of Data Mining Algorithms in Prediction Heart Diseases,” International Journal of Electrical and Computer Engineering (IJECE), vol/issue: 5(6), pp. 1569~1576, 2015. ISSN: 2088-8708.
[29] Datasets can be downloaded from: https://archive.ics.uci.edu/ml/datasets/DBWorld+emails, http://csse.szu.edu.cn/staff/zhuzx/Datasets.html,http://repository.seasr.org/Datasets/UCI/arff/.
[30] R. R. Bouckaert, et al., “WEKA Manual for Version 3-7-10,” 2013.
BIOGRAPHIES OF AUTHORS
Smita Chormunge is a PhD student of Computer Science and Engineering at GITAM
University, Hyderabad, INDIA. She obtained her Master degree and Bachelor Degree in Computer Science Engineering from SRTMU and PUNE University respectively. Her research interests are in feature selection and data mining. She has published innovative works in journals and top conference proceedings such as ACM, IEEE and Springer.
IJECE Vol. 6, No. 4, August 2016 : 1880 – 1888
Sudarson Jena is currently working as Associate Professor in the Dept. of Information Technology, GITAM University, Hyderabad. He received M. Tech degree in Computer Science and Engineering from JNTU- Hyderabad and Ph.D degree in Computer Science from Sambalpur University, in 2008. Dr. Jena has so far published more than 65 Technical papers in referred Journals and Conference proceedings. One Ph. D scholar has successfully completed under his guidance under JNTU-Hyderabad in 2015 and 15 other Ph.D research scholars are working under him in different universities in India. Dr. Jena was the Joint-Editor of the Journal, The Chanakya during 2005-2007 and Mentor of Interscience Research Network (IRNet) since 2012.He serves on the editorial board of Asian Journal of Engineering and Technology, International Journal of Computer Science Engineering, American Journal of Intelligent Systems, Journal of Grid and Distributed Computing and ten other journals. Dr Jena is an invited speaker and acted as a Chairperson and Co-Chairs for various International, National Conferences/workshops and other Research groups. He is a Member of IEEE and Life Member of Computer Society of India (CSI) and ISTE and Senior member of International Association of Computer Science and Information Technology (IACSIT). His research interests include Parallel and Distributed System, Data Mining, Reliability and Performance Evaluation of Interconnection Networks, Grid Computing, Cluster Computing and Soft Computing.