University of Nebraska - Lincoln
University of Nebraska - Lincoln
DigitalCommons@University of Nebraska - Lincoln
DigitalCommons@University of Nebraska - Lincoln
Cornhusker Economics
Agricultural Economics Department
3-11-2009
Analyzing the ACRE Program
Analyzing the ACRE Program
Bradley Lubben
University of Nebraska-Lincoln
Follow this and additional works at: https://digitalcommons.unl.edu/agecon_cornhusker
Part of the Agricultural and Resource Economics Commons
Lubben, Bradley, "Analyzing the ACRE Program" (2009). Cornhusker Economics. 438.
https://digitalcommons.unl.edu/agecon_cornhusker/438
This Article is brought to you for free and open access by the Agricultural Economics Department at
DigitalCommons@University of Nebraska - Lincoln. It has been accepted for inclusion in Cornhusker Economics by an authorized administrator of DigitalCommons@University of Nebraska - Lincoln.
E xtension is a D ivision of the Institute of A griculture and N atural R esources at the U niversity of N ebrask a–Lincoln cooperating with the C ounties and the U .S . D epartm ent of Agriculture.
U niversity of N ebrask a E xtension educational program s abide w ith the non-discrim ination policies of the U niversity of N ebraska–Lincoln and the U nited S tates D epartm ent of Agriculture.
C
ORNHUSKER
E
CONOMICS
University of Nebraska–Lincoln Extension
March 11, 2009
Institute of Agriculture & Natural Resources Department of Agricultural Economics http://www.agecon.unl.edu/Cornhuskereconomics.html
Analyzing the ACRE Program
Market Report
Yr Ago
4 Wks
Ago 3/06/09 Livestock and Products,
Weekly Average
Nebraska Slaughter Steers,
35-65% Choice, Live Weight. . . . Nebraska Feeder Steers,
Med. & Large Frame, 550-600 lb.. . . . Nebraska Feeder Steers,
Med. & Large Frame 750-800 lb. . . . . Choice Boxed Beef,
600-750 lb. Carcass. . . . Western Corn Belt Base Hog Price Carcass, Negotiated. . . . Feeder Pigs, National Direct
50 lbs, FOB. . . . Pork Carcass Cutout, 185 lb. Carcass, 51-52% Lean.. . . . Slaughter Lambs, Ch. & Pr., Heavy, Wooled, South Dakota, Direct. . . . National Carcass Lamb Cutout, FOB. . . . $90.24 130.47 101.46 150.03 52.32 46.52 59.13 84.37 260.40 $80.69 112.95 95.52 139.72 55.07 60.00 57.18 92.50 248.62 $81.44 112.22 94.57 134.87 62.50 60.00 56.00 93.25 248.44 Crops,
Daily Spot Prices
Wheat, No. 1, H.W.
Imperial, bu. . . . Corn, No. 2, Yellow
Omaha, bu. . . . Soybeans, No. 1, Yellow
Omaha, bu. . . . Grain Sorghum, No. 2, Yellow Dorchester, cwt. . . . Oats, No. 2, Heavy
Minneapolis, MN , bu. . . . 11.31 5.33 13.12 9.21 3.79 5.17 3.66 9.87 5.14 2.01 4.97 3.51 8.65 5.18 1.87 Feed
Alfalfa, Large Square Bales, Good to Premium, RFV 160-185 Northeast Nebraska, ton. . . . Alfalfa, Large Rounds, Good
Platte Valley, ton. . . . Grass Hay, Large Rounds, Premium Nebraska, ton. . . . Dried Distillers Grains, 10% Moisture, Nebraska Average. . . . Wet Distillers Grains, 65-70% Moisture, Nebraska Average. . . . 135.00 85.00 * 162.50 63.87 140.00 77.50 * 140.00 46.75 190.00 77.50 140.00 127.50 45.62 *No Market
The new farm bill enacted by Congress in June 2008 includes a new revenue-based safety net, the Average Crop Revenue Election (ACRE) Program, that is available to producers beginning with the 2009 crop year. While final details and implementation of the program is yet to be announced by the USDA Farm Service Agency (FSA), an analysis of the mechanics of ACRE and the relevant yields and prices to include in ACRE can help producers assess whether ACRE will be a good choice for this crop year and beyond.
Mechanics of ACRE
The ACRE program is available as an irrevocable option for producers beginning in the 2009 crop year. If elected, ACRE replaces the existing Counter-Cyclical Payment (CCP) Program and also requires a 20-percent cut in the Direct Payment (DP) and a 30-percent cut in the marketing loan rate. The ACRE decision is separate for each FSA farm number, but must be agreed upon by all parties in each farm number. If ACRE is not chosen in a given year, it will be available again as a option the next year, but once ACRE is chosen, it is locked in for that farm for the remaining years of the current farm program (through 2012).
ACRE covers each program crop separately, and in contrast to the existing direct and counter-cyclical payment program, covers actual planted acres on the farm instead of base acres. The total number of acres protected by the ACRE program on the farm cannot exceed the farm’s total base acreage, but the actual crops covered are based on what is planted instead of what is in the farm’s base.
In ACRE, the income support is triggered if the actual estimate of state crop revenue for each crop falls below a state-level guarantee, and the actual estimate of farm crop revenue falls below a similar farm benchmark for each crop. The guarantee and benchmark equations are:
ACRE State Guarantee = 5-Year Olympic Average State Yield * 2-Year National Average Market Price * 90%.
Farm Benchmark Revenue = (5-Year Olympic Average Farm Yield * 2-Year National Average Market Price) + Crop Insurance Premium Paid.
As the state guarantee and farm benchmark suggest, the ACRE protection is based on a moving average. The five-year Olympic average yield is calculated per planted acre. For 2009, it is based on yields from the 2004-2008 crop years, excluding the highest yield and the lowest yield, and averaging the remaining three. The two-year national average price is a simple average of the national marketing year average price for the two preceding crop years. Thus, for the 2009 crop, the national marketing year average prices for the 2007 crop and for the 2008 crop are averaged together. For each succeeding year, the moving average continues to roll forward one year.
Since the ACRE guarantee is a moving average, it will move higher or lower over time with changes that occur in overall yield and price levels. Thus, over the long-run the ACRE program will provide producers protection against the risk of sudden changes in revenue levels, but will not provide long-term continued income support against low revenue levels (such as due to a low-price trough), in the way that the existing price-based safety net (counter-cyclical payments and marketing loans) does. However, a 10-percent cap on changes in the state guarantee from year to year means the ACRE program might provide substantial income support to producers through the life of the current farm program, through 2012, even if it does not provide this same protection in the long-run. And given that the ACRE decision is only binding through 2012, the analysis of ACRE and the economics of ACRE depends more on the short-run than the long-run.
The actual state and farm revenue to count against the state guarantee and farm benchmark for each crop are based on the following equations:
Actual State Revenue = Average State Yield * MAX (national average price, marketing loan rate * 70%)
Actual Farm Revenue = Average Farm Yield * MAX (national average price, marketing loan rate * 70%)
The actual yields are again calculated per planted acre. The relevant price is the maximum of either the national average price for the crop’s marketing year or the loan rate as adjusted for participants in ACRE. An ACRE payment for a producer is triggered only if the actual state revenue falls below the state guarantee and the producer’s actual farm revenue falls below the producer’s farm benchmark revenue. The resulting ACRE payment rate is:
ACRE Payment = Min [(ACRE State Guarantee - Actual State Revenue), (25% * ACRE State Guarantee)] * (5-Year Olympic Average Farm Yield/5-Year Olympic Average State Yield) * 83.3%
The ACRE payment equation is a straightforward payment of any losses in revenue below the state guarantee,
but it is limited to no more than 25 percent of the guarantee. The payment is adjusted by the ratio of the farm’s Olympic average yield to the state’s Olympic average yield, to account for productivity differences and revenue expectations between farms. It is also multiplied by 83.3 percent, since payments are made on only a percentage of planted acres (83.3 percent for 2009-2011 and 85 percent for 2012).
Analysis of ACRE
We can begin to understand and analyze the new ACRE program if we have some of the numbers that will plug into the above equations. The data on yields per planted acre for major Nebraska crops, as released by the USDA National Agricultural Statistics Service (NASS), is reported in Table 1 (at end of article). In the table, you will note that corn and soybeans include an overall yield in addition to an irrigated and dryland yield. These two crops (and a few minor Nebraska crops) have at least 25 percent of their acreage in both irrigated and dryland production, and thus have ACRE protection calculated and available separately by practice. For example, the 2004-2008 Olympic average yield used for the 2009 ACRE guarantee should be 179.6 bushels per planted acre for irrigated corn, while the dryland corn yield would be 117.5 bushels per planted acre. While these yields are from official data on production and planted acreage published by NASS, they will not exactly be the yield numbers used by FSA, due to some agency adjustments to yields to account for issues such as planted acreage not intended for grain production.
The data on national average prices is shown in Table 2 (at end of article). The ACRE guarantee for 2009 will be based on the average of the 2007 and 2008 crop’s marketing year average prices. While the 2007 crop’s marketing year average price is known, the 2008 crop’s marketing year is just over half complete for the fall harvested crops. Thus, we will not know with certainty what the average price used in the 2009 ACRE guarantee will be until the marketing year is complete for each crop (about the time the next year’s crop is being harvested). But we do have an estimate for the marketing year based on the midpoint of the price range published by the USDA World Agricultural Outlook Board in their monthly supply and demand estimates. For corn again as an example, the 2007 crop’s national marketing year average price finished at $4.20 per bushel, while the midpoint of the current range estimated for the 2008 crop’s marketing year average price just rose in the March 11, 2009 report to $4.10 per bushel. As a result, the current estimated average price for corn for the 2009 ACRE guarantee is calculated at $4.15 per bushel.
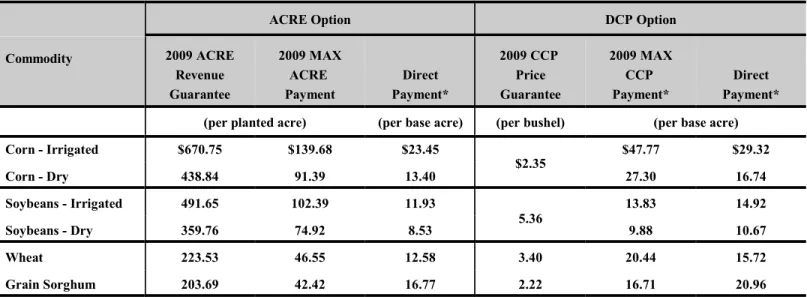
Taking these yield and price numbers, we can then calculate the ACRE state guarantee. By multiplying the 2004-2008 Olympic average yield times the 2007-2004-2008 average price times 90 percent, we can calculate the ACRE state guarantees shown in Table 3 (at end of article). For example, the ACRE state guarantee would be $670.75 per planted acre for irrigated corn and $438.84 per planted acre for dryland corn. If revenue falls below these guarantee levels, ACRE
payments would be available to producers who also fell below their farm’s benchmark revenue levels. At maximum, the ACRE payment per planted acre would be equal to 25 percent of the guarantee multiplied by 83.3 percent for 2009, or $139.68 per planted acre for irrigated corn and $91.39 per planted acre for dryland corn. These guarantees and potential payments compare quite favorably with the potential payments under the existing CCP program. Under that program, revenue is protected on corn base acres (not planted acres) only if the national marketing year average price of corn drops below $2.35 per bushel. Based on estimated average program yield levels in Nebraska, the maximum CCP payment (if prices fell to the loan rate of $1.95 per bushel) would be approximately $47.77 on irrigated corn and $27.30 on dryland corn.
The data indicate ACRE could hold a large advantage over the existing CCP program in terms of protecting Nebraska producers against revenue losses from current expected levels in 2009. If there are concerns or expectations that revenue will drop from current levels due particularly to a price decline, then ACRE will certainly pay quicker and much more than the CCP. But the choice of ACRE is irrevocable for the life of the farm program through 2012, so the analysis needs to be of potential protection and payments over the four-year period, not just 2009. While a drop in revenue from year to year will eventually drop the guarantee as well, the potential downside protection under ACRE still looks to be greater than that provided under the CCP. But, there is also the cost of giving up 20 percent of the DP each year to participate in ACRE. That could amount to about $6 per base acre in irrigated corn and $3 per base acre in dryland corn, based on the additional data in Table 3. If price expectations for 2009-2012 are steady to increasing, then the potential payments under ACRE could be very small if at all and the producer would be out the amount of the lost DPs. That could be a significant cost if producers are confident in the direction of prices over the next four years, but it also might effectively be a small premium to pay for the downside risk protection that ACRE could provide over the same four years.
With all of the data known to date, it appears that ACRE could be a very attractive farm program option for Nebraska producers in 2009 and beyond. There are some further details and issues yet to resolve before the analysis can be completed. First, the exact yields and prices to go into the calculation of the guarantee are not yet known, so the analysis is currently based on estimated and expected numbers. Second, and more significantly, the procedures for producers to prove a farm-level five-year Olympic average yield must be determined and announced by FSA. There is expected to be substitute yield level provided by FSA for producers who cannot prove their historical yields and there will be some procedures needed for beginning farmers, farmers new to a specific farm number, or farmers with a crop rotation that leaves them with less than five years of yield history in the five-year period. But, determining this farm-level yield
benchmark is important in determining the level of protection really provided by a safety net that triggers only if revenue on the farm falls below the benchmark. If the benchmark is based on some substitute yield far below the farm’s true yield potential, then the protection offered by the benchmark goes down accordingly.
Beyond some of the program details that are yet to be finalized, there are some general economic implications of ACRE that are important to producers and their risk management decisions. By protecting revenue losses instead of price losses, the ACRE program more directly protects a producer’s bottom line than does the existing CCP program. And, by protecting the farm’s planted acreage instead of the farm’s base acreage, the ACRE program also improves the risk protection provided by the farm program. But, it is also clear that ACRE is limited in the amount of risk protection it can provide. First, since ACRE payments are limited to no more than 25 percent of the guarantee, it is clearly not a complete replacement for crop insurance policies that protect losses below a certain deductible. Second, since the ACRE payment is based on shortfalls in state-level crop revenue and not farm-level crop revenue, it does not directly protect the farm’s crop revenue risk. And third, as noted, the ACRE program comes with a 20 percent cut in the DP and a 30 percent cut in marketing loan rates.
To fully analyze ACRE and the economics of both farm program decisions and broader risk management strategies, producers will need to carefully calculate the potential impacts of ACRE versus the existing CCP program. And to do a full analysis, producers don’t need just the data going into the 2009 crop year, but also some expectations for averages and variability around farm-level yields, state-level yields and national prices for the 2009-2012 crop years. There are some tools available now which will allow producers to run through these calculations on ACRE, although all of them to date are incomplete at best, given details yet to be released by FSA. All of the existing tools are listed as links from our University of Nebraska-Lincoln farm bill website at farmbill.unl.edu. As more tools and more complete details on ACRE and other farm programs are available, they will be listed on the farm bill website, along with publications, videos and schedules of upcoming producer meetings around the state.
Bradley D. Lubben, (402) 472-2235 Assistant Professor and Extension Public Policy Specialist Department of Agricultural Economics University of Nebraska-Lincoln
Table 1. State Yields for ACRE - Nebraska Yields per Planted Acre Year Corn Corn Irrigated Corn Dry Soybeans Soybeans Irrigated Soybeans Dry Wheat Grain Sorghum 2003 138.8 180.9 74.8 40.1 53.4 30.0 44.1 47.0 2004 160.0 181.1 127.2 45.5 53.3 39.0 33.0 58.9 2005 149.5 180.5 104.3 50.1 58.7 42.6 37.1 64.0 2006 145.4 179.1 94.8 49.6 58.2 41.7 34.0 50.6 2007 156.6 177.5 122.2 50.7 54.9 46.9 41.1 64.5 2008 156.4 179.1 126.0 46.1 55.4 38.3 42.0 63.7 2003-2007 Oly. Avg. 150.5 180.2 107.1 48.4 55.5 41.1 37.4 57.8 2004-2008 Oly. Avg. 154.2 179.6 117.5 48.6 56.2 41.1 37.4 62.2
Source: USDA National Agricultural Statistics Service, March 11, 2009.
Table 2. M arket Prices for ACRE - National Average M arket Prices
Year Corn Soybeans Wheat Grain Sorghum
2006 $3.04 $6.43 $4.26 $3.29
2007 4.20 10.10 6.48 4.08
2008 4.10 9.35 6.80 3.20
2006-2007 Average $3.62 $8.27 $5.37 $3.69
2007-2008 Average $4.15 $9.73 $6.64 $3.64
Source: USDA National Agricultural Statistics Service and USDA World Agricultural Outlook Board, March 11, 2009.
Table 3. Comparison of ACRE and DCP - Estimated Average Nebraska Program Payments
Commodity
ACRE Option DCP Option
2009 ACRE Revenue Guarantee 2009 MAX ACRE Payment Direct Payment* 2009 CCP Price Guarantee 2009 MAX CCP Payment* Direct Payment*
(per planted acre) (per base acre) (per bushel) (per base acre)
Corn - Irrigated $670.75 $139.68 $23.45 $2.35 $47.77 $29.32 Corn - Dry 438.84 91.39 13.40 27.30 16.74 Soybeans - Irrigated 491.65 102.39 11.93 5.36 13.83 14.92 Soybeans - Dry 359.76 74.92 8.53 9.88 10.67 Wheat 223.53 46.55 12.58 3.40 20.44 15.72 Grain Sorghum 203.69 42.42 16.77 2.22 16.71 20.96