Using Ensemble Technique to Improve Multiclass Classification
Dalton Ndirangu1* Waweru Mwangi2 Lawrence Nderu21.United States International University, P.o. Box 14634-00800 Nairobi, Kenya
2.Jomo Kenyatta University of Agriculture and Technology, P.o. Box 62,000-00200 Nairobi, Kenya
Abstract
Many real world applications inevitably contain datasets that have multiclass structure characterized by imbalance classes, redundant and irrelevant features that degrade performance of classifiers. Minority classes in the datasets are treated as outliers’ classes. The research aimed at establishing the role of ensemble technique in improving performance of multiclass classification. Multiclass datasets were transformed to binary and the datasets resampled using Synthetic minority oversampling technique (SMOTE) algorithm. Relevant features of the datasets were selected by use of an ensemble filter method developed using Correlation, Information Gain, Gain-Ratio and ReliefF filter selection methods. Adaboost and Random subspace learning algorithms were combined using Voting methodology utilizing random forest as the base classifier. The classifiers were evaluated using 10 fold stratified cross validation. The model showed better performance in terms of outlier detection and classification prediction for multiclass problem. The model outperformed other well-known existing classification and outlier detection algorithms such as Naïve bayes, KNN, Bagging, JRipper, Decision trees, RandomTree and Random forest. The study findings established that ensemble technique, resampling datasets and decomposing multiclass results in an improved classification performance as well as enhanced detection of minority outlier (rare) classes.
Keywords: Multiclass, Classification, Outliers, Ensemble, Learning Algorithm
DOI: 10.7176/JIEA/9-5-04
Publication date: August 31st 2019
1. Introduction
The issue of multiclass classification has attracted a lot of researcher’s interest due to its challenges and wide application in real life. The minority classes in a multiclass datasets may be described as rare classes or rare events or outliers (Chawla, 2009). It is widely believed that outliers may be due to random variation or an indication that could be scientifically interesting. Outlier detection applications include credit card fraud detection, network intrusion detection, medical diagnosis analysis, stock market share analysis and many others (Vajda & Fink 2010).
In a multiclass imbalance problem, the rare classes’ forms the class of interest since the existing classification algorithms were designed with bias towards prediction of majority classes (Athimethphat & Lerteerawong, 2012). Hence, the problem to learn in such conditions constitutes most biases particular to several learning algorithms which are the most significant in some real applications such as biological data analysis, image classification, text classification, and web page classification. Thus several strategies and techniques are required when solving the problem of multiclass. According to Elkano et al., (2017) decomposition strategies have been demonstrated to be a successful methodology for multiclass classification.
Thus since outliers can manifest themselves as rare events in a multiclass classification problem, it is practical to combine together the study of multiclass classification and outlier detection method. Researchers should strive to come up with novel prediction methods that improve on the prediction of the minority classes and safeguard the integrity performance of the majority classes. The rest of the paper is organized as follows. Section 2 deals with related work and section 3 present the statement of the problem while section 4 provides the proposed method. Experiments are provided in section 5 and conclusion done in section 6.
2. Related Works
Machine learning (ML) is the study of algorithms and statistical models that computer systems use to progressively improve their performance on a specific task (Coelho &Richert, 2015). The ML learning algorithms use training data to build predictive or decision models. The learning algorithms are widely used in classification, clustering, associations and specific fields like outlier detections.
Data mining is a process of inferring hidden or masked knowledge from a large amount of dataset. Data mining techniques have been applied and integrated on several fields such as machine learning, statistics, artificial intelligence, and database systems, for analysis of large volumes of data (Allahyari, 2017). Data mining functionalities takes the form of descriptive or predictive models. The descriptive model recognizes the designs or relationships in data and discovers the properties of the data studied. The descriptive model use clusters or association techniques that use unsupervised machine learning algorithms. Predictive methods on the other hand perform inference on data using supervised learning. The predictive tasks of data mining include classification
and regression (Han et al., 2011).
Data classification is the process of organizing and categorizing data into various types, forms or any other distinct class (Vinod &Vasudevan, 2016). Classification is considered as the most commonly applied data mining technique. The technique employs a set of pre-classified examples to develop a model that classify the population of records. The goal of classification is to accurately predict the target class for each case in the data. Classification techniques use supervised learning algorithm to create and test models. The models are commonly referred to as classifiers and are trained using a set of training dataset that should be pre-processed before use. Classifiers are tested for its prediction capacity using different samples of test dataset. The test dataset should have similar features like the original training dataset but must not have been used during the training phase. Supervised learning is implemented by set of labels defined prior to the training set. The primary objective of supervised learning is to build a concise model of the distribution of class labels in terms of predictor features (Kotsiantis et al., 2006).
The dataset for classification problem can be balanced or imbalanced. A balanced dataset has almost an equal dataset representation for all the classes. The class imbalance problem corresponds to the domain for which one class is represented by a large number of examples while the other class is represented by just a few examples (Japkowicz, 2002). In such case, standard classifiers tend to be overwhelmed by the large classes and ignore the minority classes (Guo et al., 2008). The cost of misclassification of minority class outweighs the benefits of the accuracy that is usually contributed by the majority class. Imbalanced dataset problem appears in many real world applications like text categorization, industrial fault detection, bank and insurance fraud detection, oil-spillage detection in satellite images, toxicology, cultural modeling, medical diagnosis, anomaly detection and many others.
Outlier prediction is considered a difficult task since existing common learning algorithms are biased towards the prediction of the majority classes. Most classifiers focus on accuracy that is usually influenced by the majority examples. Ironically, the minority outlier class is often of more interest and more importance. For example, in a medical diagnosis traces of cancer may appear as rare instances and existing learning algorithms may fail to predict the occurrence of the cancer cases. Thus there is need to identify such rare medical condition among the normal populations (Ali et al., 2015).
An ensemble method is regarded as meta-algorithm that combines several machine learning techniques into one dominant predictive model in order to decrease data variance, algorithm bias and improve prediction. The Ensemble techniques utilize the explicit power of multiple models to realize better prediction accuracy than the case when individual models are used. The ensemble learning algorithms used in the design should be competent enough and complementary to one another (Oza& Russell, 2001).
Most of the ensemble methods use a single base learning algorithm to produce homogeneous base learners. However there are some ensemble methods that use learners of different types leading to heterogeneous ensembles. In order for ensemble methods to be more accurate than any of its individual members, the base learners have to be as accurate as possible and as diverse as possible (Breiman, 1996). Recent studies have shown that combining feature selection methods through ensemble technique improves on performance of classifiers by identifying features that are weak as an individual but strong as a group (Osanaiye et al., 2016).
3. Statement of the Problem
Many real-world classification problems involve use of datasets that have three or more classes, phenomena referred to as multiclass. The datasets are characterized by imbalance classes, and irrelevant features that degrade performance of classifiers (Krawczyk, 2016). Performance of classifier is significantly affected by the nature of the dataset, presence of outliers (noise), size of the dataset and the underlying learning algorithm used. According to Dietterich and Bakiri, (1994), majority of the well-known existing classification learning algorithms were designed for binary problems. Researchers have continued to find novel superior processes and techniques for solving multiclass classification and rare class (outlier) detection. Ensemble technique has gained wide acceptance in the process of producing new methods for outlier detection. Depending on the nature of target application, different applications require use of different detection methods (Zhang, 2010). Thus there is need to develop new outlier detection method using either data centered or algorithmic approach. Various successful techniques have been proposed to solve the problem in the binary classification case. However the multiclass classification case is more challenging since many of the existing algorithms were designed for binary classification (Aly, 2005,Krawczyk, 2016).
Study by Elrahman and Abraham (2013) showned that many researchers have attempted to solve the problem of imbalance learning; phenomena associated with multiclass and concluded that there is no existing unifying approach to solving the imbalance problem. The issue of imbalance classes can be addressed through use of re-sampling techniques. However more research is needed for the ever challenging emerging multiclass problem in real life applications (Krawczyk, 2016). Author Chomboon et al.(2013) reaffirmed that classifying minority or rare class is difficult because rare class representation could have very few data compared with the
majority class and moreover the existing classification algorithms were designed to be biased towards prediction of majority class. Thus there is need to develop new outlier detection methods.
According to Błaszczyński and Stefanowski (2018) learning classifiers from imbalanced data associated with either binary or multiclass problems is still one of major challenging tasks in machine learning and data mining. The authors’ findings suggested need for constructing specialized preprocessing methods that improves on performance of classifiers. Their findings reiterated the need for further studies in the techniques of preprocessing datasets and development of new novel learning methods.
Thus this study aimed at developing an ensemble model for multiclass classification and outlier detection method using ensemble techniques. The proposed method incorporated several strategies and ensemble techniques.
4. Proposed Method
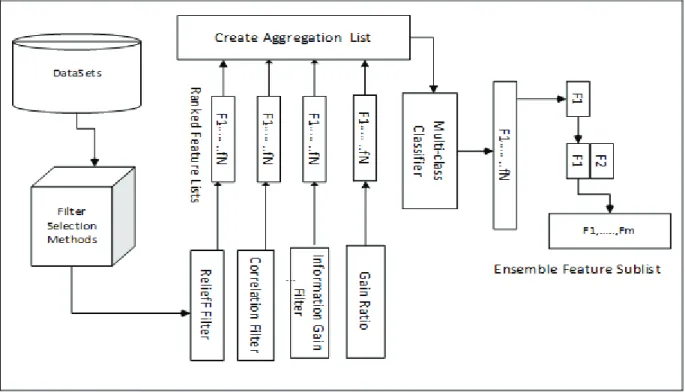
We proposed development of an ensemble multiclass classification and outlier detection method for data mining. The method used several strategies and ensemble techniques. The method had stages. The first stage involved development of a preprocessing ensemble filter method. Four filter feature selection algorithms were used. The algorithms were Correlation-Based Feature Selection (CBFS), Information gain, ReliefF, and Gain ratio filter feature selection algorithms. The ensemble filter method was constructed as follows. Each of the four algorithms were used to rank the features. The results were merged using aggregation technique or majority voting method to produce a single merged feature list. To establish an optimal feature list from the merged feature list, Random forest classifiers, accuracy performance and root mean square error (RMSE) values were used. The process of generating the optimal list worked as follows: Starting from the top of the merged list, the topmost most feature was selected and used to build classifier. The process was repeated iteratively by incorporating the next top-most feature. As long as a feature had significant contribution to the performance of classifiers, the RMSE predictive value was expected to continue decreasing as more bottom ranked features were incorporated. When a feature with less contribution to the performance of classifier was incorporated, the resulting classifier was expected to have a higher RMSE value compared with the previous immediate RMSE value. Thus the threshold was set to this level where the classifiers had the least RMSE value and also had the highest accuracy performance.The final expected feature sub-list included the features starting from the top-ranked feature up to and including the feature that resulted in the generation of the least RMSE value and the highest accuracy performance measure. Figure 1 depict the process of generating the ensemble optimal sublist.
Figure 1: Ensemble Filter Feature Selection Method
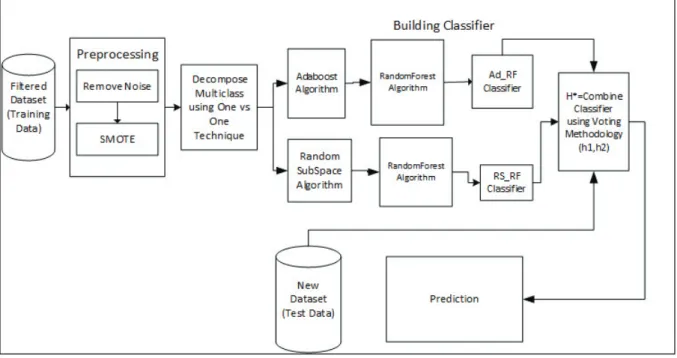
To increase the visibility of the minority classes, the method proposed use of SMOTE. The numbers of artificial samples were generated to the level that measured at least 50% compared with the majority classes. The multiclass problem was reduced to binary by applying One-verses-One decomposition technique. Using the optimal features, a heterogeneous ensemble model was constructed. Two ensemble classifiers were built using AdaBoost algorithm and Random Subspace algorithm each utilizing random forest algorithm as their base
classifier. We named the first classifier as AD_RF and the second classifier as RS_RF. The two ensemble classifiers AD_RF and RS_RF were combined using voting technique utilizing average of probabilities combination rule. Each of the individual classifier generated their hypothesis h1, and h2 respectively. For each output class, a posteriori probabilities were generated by the individual classifier. Next, the class represented by the maximum average value of a posteriori probabilities was selected to be the voting hypothesis (h*) for the final decision. The modeling process is depicted in Figure 2.
Figure 2: Proposed Ensemble Model 5. Experiments, Results and Discussions
5.1 Dataset Description
Since research was on multiclass classification, imbalance sensitive datasets were adopted from UCI. The study used 5 medical datasets, 4 biological datasets, 2 chemical analysis datasets, 1 forensic dataset and 1 manufacturing dataset. The datasets were a mixture of high and low dimensionality. The detail description of the datasets is provided as follows:
5.1.1 Cleveland Dataset
Cleveland dataset is a part of the Heart disease dataset (the part obtained from the V.A. Medical Center, Long Beach and Cleveland Clinic Foundation). The dataset was originally created to detect the presence of heart disease in the patient. The dataset has 13 attributes, 5 classes and 297 instances. The classes have sample representations as follows: Class1 160 Class2 35 Class3 35 Class4 54 Class5 13
Class1 was considered as the majority class and other classes considered as rare/outlier classes.
5.1.2 Contraceptive Dataset
Contraceptive dataset is a subset of the 1987 National Indonesia Contraceptive Prevalence Survey. The samples are for married women who were either not pregnant or did not know if they were at the time of interview. The dataset was created to predict contraceptive method choice at the time of interview (no use, long-term methods, or short-term methods) for women based on their demographic and socio-economic characteristics. The dataset has 9 attributes, 3 classes and 1473 instances. The classes have sample representations as follows:
Class1 (no-use) 629 Class2 (long-term- use) 333 Class3 (short-term-use) 511
Class1 and Class3 were considered as the majority classes and Class2 considered as the rare (outlier) class.
5.1.3 Dermatology Dataset
The dataset was original created to perform the differential diagnosis of erythemato-squamous diseases which is a real problem in dermatology. Patients were first evaluated clinically with 12 features. Afterwards, skin samples
were taken for the evaluation of 22 histopathological features. The dataset has 34 attributes, 6 classes and 366 instances.
The classes have sample representations as follows: Class1(x2) 60 Class2(x1) 111 Class3(x3) 71 Class4(x5) 48 Class5(x4) 48 Class6(x6) 20
Class2(x1) was considered as the majority class while the rest of the classes were considered as the rare (outlier) classes.
5.1.4 Ecoli Dataset
The original Ecoli datasetis a multiclass classification dataset having 8 attributes. Here, 7 numerical attributes are utilized and the attribute “sequence name” is omitted. Among the 8 classes omL, imL, and imS are the minority classes and used as outliers. All the other majority classes are used as inliers. The dataset has 7 attributes, 8 classes and 336 instances.
The classes have sample representations as follows: Class1 (cp) 143 Class2 (im) 77 Class3 (ims) 2 Class4 (imL) 2 Class5 (imU) 35 Class6 (om) 20 Class7 (omL) 5 Class8 (pp) 52
5.1.5 Glass Identification Dataset
The Original dataset was obtained from USA Forensic Science Service. The dataset has 6 types of glass which can be found in the crime scene, defined in terms of their oxide content (i.e. Na, Fe, K, etc). The dataset has 9 attributes, 7 classes and 214 instances.
The classes have sample representations as follows: Class1 (build wind float) 70
Class2 (build wind non-float) 76 Class3 (containers) 13 Class4 (headlamps) 29
Class5 (tableware) 9
Class6 (vehicle wind float) 17
Class7 0
Class7 was discarded since it did not contain any data. Class3 (containers) and Class5 (tableware) were considered as outliers and the other classes considered as inliers.
5.1.6 Newthyroid Dataset
This dataset is one of the several databases about Thyroid available at the UCI repository. The dataset was created to detect whether a given patient is normal (1) or suffers from hyperthyroidism (2) or hypothyroidism (3). The dataset has 5 attributes, 3 classes and 215 instances.
The classes have sample representations as follows: Class1 (normal) 150
Class2 (hyperthyroidism) 35 Class3 (hypothyroidism) 30
Class1 was considered as the majority (inliers) class and the other two classes considered as outliers (minority classes).
5.1.7 Red Wine Quality Dataset
The dataset is related to red variant of the Portuguese Vinho Verde wine. Due to privacy and logistic issues, only physicochemical (inputs) and sensory (the output) variables are available (e.g. there is no data about grape types, wine brand, wine selling price, etc.).The classes are ordered and not balanced (e.g. there are much more normal wines than excellent or poor wine). The dataset has 11 attributes, 6 classes and 1599 instances.
The classes have sample representations as follows: Class1 (quality 5) 681
Class2 (quality 6) 638 Class3 (quality 7) 199 Class4 (quality 4) 53
Class5 (quality 8) 18 Class6 (quality 3) 10
Class5 (quality 8) that had the best quality of red wine and Class6 (quality 3) that had low quality of red wine were considered as outliers and the other classes considered as inliers.
5.1.8 Zoo Dataset
Zoo database was meant to classify animals in seven predefined classes and most of the attributes are Boolean-valued. The dataset has 16 attributes, 7 classes and 101 instances.
The classes have sample representations as follows: Class1 (zoo1) 41 Class2 (zoo4) 13 Class3 (zoo7) 10 Class4 (zoo2) 20 Class5 (zoo6) 8 Class6 (zoo3) 5 Class7 (zoo5) 4
Class1 (zoo1) and Class4 (zoo2) were considered as inliers and the other classes considered as outliers
5.1.9 Vehicle Dataset
Vehicle dataset is used to classify a given silhouette as one of four types of vehicle, using a set of features extracted from the silhouette. The dataset has 18 attributes, 4 classes and 946 instances.
The classes have sample representations as follows: Class1 (van) 199
Class2 (saab) 217 Class3 (bus) 218 Class4 (opel) 212
Class1 (van) was considered as the outlier class and the rest of the classes considered as inliers.
5.1.10 Yeast Dataset
This database contains information about a set of yeast cells. The original use of dataset was to determine the localization site of each cell among 10 possible alternatives. The dataset has 8 attributes, 10 classes and 1484 instances.
The classes have sample representations as follows: Class1 (MIT) 244 Class2 (NUC) 429 Class3 (CYT) 463 Class4 (ME1) 44 Class5 (EXC) 35 Class6 (ME2) 51 Class7 (ME3) 163 Class8 (VAC) 30 Class9 (POX) 20 Class10 (ERL) 5
Class1, Class2, Class3, Class7 were considered as inliers and the rest of the classes considered as outliers.
5.1.11 Balance Scale Dataset
This dataset was generated to model psychological experimental results. Each example is classified as having the balance scale tip to the right, tip to the left, or be balanced. The attributes are the left weight, the left distance, the right weight, and the right distance. The correct way to find the class is the greater of (distance * left-weight) and (right-distance * right-left-weight). If they are equal, it is balanced. The dataset has 4 attributes, 3 classes and 625 instances.
The classes have sample representations as follows: Class1 (B) 49
Class2 (R) 288 Class3 (L) 288
Class2 and Class3 were considered as the inliers and Class1 considered as outlier
5.1.12 Iris Dataset
This is perhaps the best known database to be found in the pattern recognition literature. The dataset contains 3 classes of 50 instances each, where each class refers to a type of iris plant. One class is linearly separable from the other 2; the latter are NOT linearly separable from each other. The dataset has 18 attributes, 4 classes and 150 instances.
The classes have sample representations as follows: Class1 (iris-setosa) 50
Class2 (iris-versicolor) 50 Class3 (iris-verginica) 50 All classes were considered as inliers.
5.1.13 Wine Dataset
These data are the results of a chemical analysis of wines grown in the same region in Italy but derived from three different cultivars. The analysis determined the quantities of 13 constituents found in each of the three types of wines. In a classification context, this is a well posed problem with well-behaved class structures. The dataset has 13 attributes, 3 classes and 178 instances.
The classes have sample representations as follows: Class1 (Q1) 59
Class2 (Q2) 71 Class3 (Q3) 48
All the classes were considered as inliers and there was no outlier class.
5.2 Experiment 1: Comparing Performance of Original Multiclass Datasets and Decomposed Multiclass Datasets
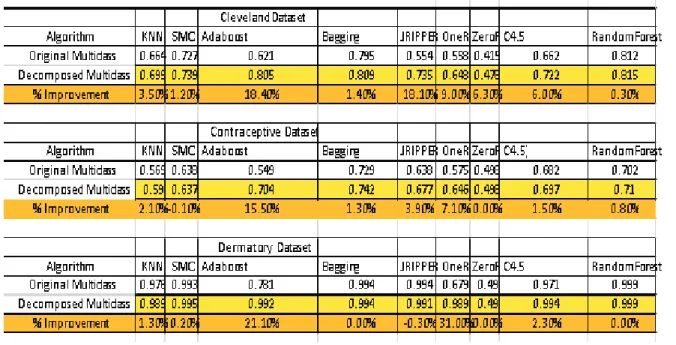
We sought to demonstrate the rational for transforming multiclass to binary classes. Experiments were conducted using multiclass datasets and commonly used classification algorithms. Metric performance was measured using Receiver Operating Characteristic curve (ROC). Comparisons performance between original multiclass datasets and transformed datasets was done and results tabulated as shown in Table 1. Results show that after transforming the Cleveland dataset to binary classes, performance of KNN improved by 3.3%, SMO improved by 1.2%, AdaBoost(decision stump) improved by 18.4%, Bagging (Reptree) improved by 1.4%, JRipper improved by 18.1%, OneR improved by 9%, ZeroR improved by 6.3%, DecisionTree improved by 6% and Random forest improved marginally by 0.3%. Thus performance significantly improved for most of the learning algorithms when the multiclass datasets were decomposed to binary classes. Results reaffirm that existing learning algorithms performs well with binary classes and hence the need to transform multiclass datasets into binary classes.
Table 1: Rational for Transforming Multiclass to Binary Classes
5.3 Experiment 2: Creating Ensemble Filter Method
We illustrate the process of creating ensemble filter method using Redwine dataset. Table 2 provide the results. We note feature alcohol was the topmost ranked and feature PH was the least ranked in the final merged list.
Table 2:Creating Merged Ranked Features List
Attribute name Attribute # Correlation GainRatio InformationGain ReliefF MeanAggregation Majority Vote Rank
Alcohol 11 1 1 1 1 1 1
Volatile Acidity 2 2 2 2 5 2.75 2
Sulphates 10 4 3 3 3 3.25 3
Total Sulfur Dioxide 7 3 5 5 2 3.75 4
Citric Acid 3 6 6 4 4 5 5 Density 8 5 4 6 6 5.25 6 Chlorides 5 7 7 7 11 8 7 Fixed Acidity 1 9 8 8 8 8.25 8 FreeSuphurDioxide 6 8 11 11 7 9.25 9 Residual Sugar 4 11 9 9 10 9.75 10 PH 9 10 10 10 9 9.75 11
5.4 Experiment 3: Creating Optimal Sublist
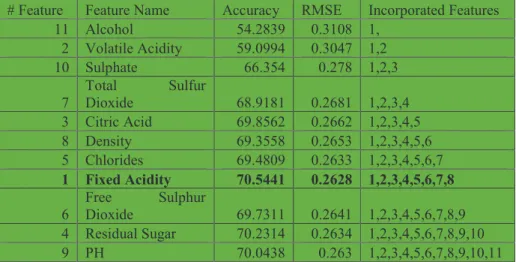
Using the merged feature list, experiment was conducted to establish an optimal feature sub-list. Random forest classifiers were built using the features. Table 3 represents the results of the experiment. Feature (alcohol) was ranked top and as such was the first feature used to build the classifier. The classifier built had 0.3108 RMSE value. Feature 2 (Volatile acidity) was the second feature to be incorporated in the buildup of the classifier. We observe the resulting classifier generated a 0.3047 RMSE value which was less than 0.3108 previous observed RMSE value. The process was repeated iteratively. After incorporating feature Free-sulfur-dioxide, the resulting classifier generated a 0.2641 RMSE value which was a higher RMSE value than the previously observed 0.2628 RMSE value. Threshold value was set at this feature
Fixed Acidity since the feature had the least RMSE value and also had the highest accuracy performance. Thus the ensemble feature sub-list was 11, 2, 10, 7, 3, 8, 5, 1. The rest of the features free sulfur dioxide, residual sugar and PH were dropped since they were detected to have low predictive performance and contributed in significantly to the performance of classifiers.
Table 6: Creating Ensemble Feature Selection Sub-list
# Feature Feature Name Accuracy RMSE Incorporated Features 11 Alcohol 54.2839 0.3108 1, 2 Volatile Acidity 59.0994 0.3047 1,2 10 Sulphate 66.354 0.278 1,2,3 7 Total Sulfur Dioxide 68.9181 0.2681 1,2,3,4 3 Citric Acid 69.8562 0.2662 1,2,3,4,5 8 Density 69.3558 0.2653 1,2,3,4,5,6 5 Chlorides 69.4809 0.2633 1,2,3,4,5,6,7 1 Fixed Acidity 70.5441 0.2628 1,2,3,4,5,6,7,8 6 Free Sulphur Dioxide 69.7311 0.2641 1,2,3,4,5,6,7,8,9 4 Residual Sugar 70.2314 0.2634 1,2,3,4,5,6,7,8,9,10 9 PH 70.0438 0.263 1,2,3,4,5,6,7,8,9,10,11
In order to validate that the proposed ensemble filter method performs well, we proceeded to compare the performance of the proposed ensemble feature selection method with other commonly used feature selection algorithms. Random forest classifiers were built using different feature selection algorithms and compared with classifiers built using the sub-list features generated from our proposed method. Table 7 represents the results. Result shows that the proposed ensemble filter selection method attained accuracy of 70.5%, Correlation (CBFS) had 69.5%, Gain-Ratio had 69.9%, Information-Gain had 69.9%, OneR had 69.8%, Principal Component Analysis had 70.1%, Fast Correlation Based Filter had 69.8% and Chi-Square Filter method had 69.98%. We observed that the proposed ensemble filter method performed better than the individual filter selection algorithms used in the construction of the ensemble and also better than Principal Component Analysis (PCA), Fast Correlation Based Filter (FCBF), OneR and Chi-Squared filter selection algorithms. Thus our proposed feature selection method was superior to most of the commonly used filter feature selection algorithms.
Table 7: Comparisons Performance of Proposed Filter Selection Method and Other Commonly Used Filter Selection Algorithms
Method Accuracy Performance
Correlation 69.50%
GainRatio 69.90%
Information Gain 69.90%
OneR 69.80%
Principal Component Analysis 70.10%
Fast Correlation Based Filter (FCBF) 69.80%
Chi-Squared Filter 69.98%
Proposed Ensemble Method 70.50%
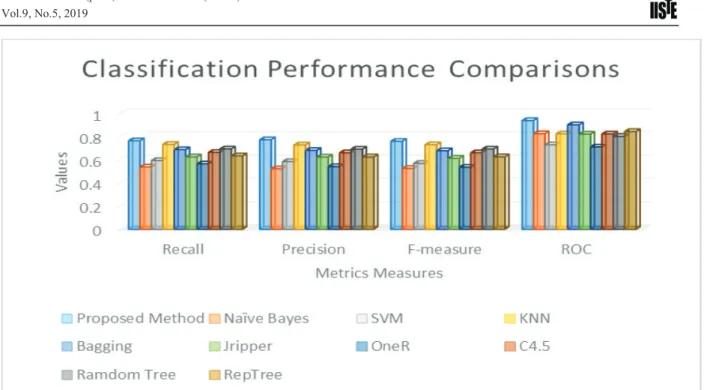
5.5 Experiment 4: Classification Performance between Proposed Method and other commonly used Algorithms using Redwine Dataset
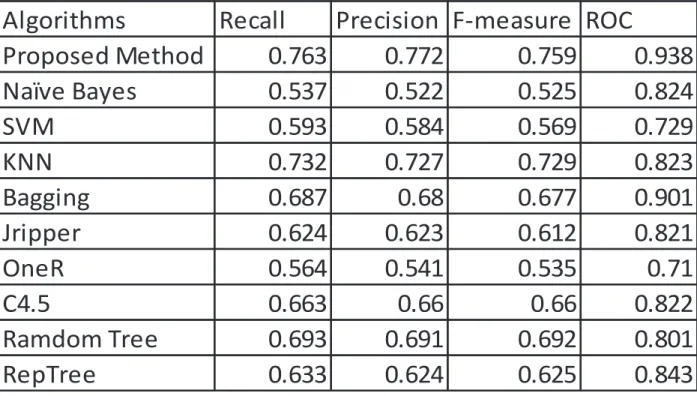
We sought to compare the performance of the proposed method with other commonly used algorithms. Redwine dataset was used in the experiment. Performance measures used were Recall, Precision, F-measure and Receiver Operatiing Characteristic (ROC). Table 8 and Figure 4 represent the results. We observe that the proposed method outperformed most of the existing classification algorithms.
Table 7: Comparison Performance of the Proposed Method and other Commonly used Algorithms using Redwine Datasets
Algorithms
Recall
Precision F-measure ROC
Proposed Method
0.763
0.772
0.759
0.938
Naïve Bayes
0.537
0.522
0.525
0.824
SVM
0.593
0.584
0.569
0.729
KNN
0.732
0.727
0.729
0.823
Bagging
0.687
0.68
0.677
0.901
Jripper
0.624
0.623
0.612
0.821
OneR
0.564
0.541
0.535
0.71
C4.5
0.663
0.66
0.66
0.822
Ramdom Tree
0.693
0.691
0.692
0.801
RepTree
0.633
0.624
0.625
0.843
Figure 3: Comparison Performance of the Proposed Method and other commonly used Algorithms using Redwine Datasets
To remove the bias that could be associated with the use of a single dataset, similar experiments were performed using a set of 10 multiclass datasets. Classification performance was measured using ROC values. Results of the experiments were provided in form of Figures.
5.6 Experiment 5: Comparing Classification Performance of Proposed Method with Naïve bayes Using 10 Multiclass Datasets
Figure 4 shows result of the experiment. Results indicate that while using contraceptive, glass, redwine, vehicle, yeast datasets, the proposed method had statistically significant better ROC metric classification performance than Naïve bayes algorithm. Other observations reveals that the proposed method edged marginally naïve bayes algorithm after using the datasets like Cleveland, Dermatology, Ecoli, Newthyroid and Zoo. Naive Bayes classifier use the Bayes Theorem. It predicts membership probabilities for each class such that the probability of a given record or data point belongs to a particular class. The class with the highest probability is considered as the most likely class. The proposed method utilized the ensemble capability of AdaBoost, random subspace and random forest algorithms and thus outperformed Naïve bayes algorithm.
Figure 4: Proposed Method verses Naïve Bayes Algorithm using 10 Multiclass Datasets
5.7 Experiment 6: Comparing Classification Performance of Proposed Method with SVMUsing10 Multiclass Datasets
Figure 5 show results of the experiment. Results indicate that the proposed method performed better than SVM algorithm for all the datasets except Zoo dataset which produced statistically same performance. SVM focuses only on the points that are rather difficult to tell apart, whereas other classifiers pay attention to all the points. The proposed method utilized the boosting capability of AdaBoost algorithm that focuses on misclassified
classifiers and also on the excellent feature selection provided by random subspace method. Thus the proposed method had superior capabilities than SVM algorithm.
Figure 5: Proposed Method Verse SVM Algorithm Using 10 Multiclass Datasets
5.8 Experiment 7: Comparing Classification Performance of Proposed Method with KNN Using 10 Multiclass Datasets
Figure 6 represents results of the experiment. We observe the proposed method performed better than KNN algorithm for all the datasets except the Zoo dataset which showed relatively same performance. Prediction stage of KNN might be slow if the dataset has huge sample size. KNN is also sensitive to irrelevant features and the scale of the data. The proposed method use random forest as its base classifier and AdaBoost and random subspace algorithms classifiers as the learning algorithms. A random forest can be described as a collection of decision trees whose results are aggregated into one final result. Random forest ability to limit overfitting without substantially increasing error due to bias, leads to creation of such powerful models. Random forests reduce variance by training on different samples of the data. Thus the proposed method that has random forest component produced a better performance than KNN algorithm.
Figure 6:Proposed Method verses KNN Algorithm using 10 Multiclass Datasets
5.9 Experiment 8: Comparing Classification Performance of Proposed Method with Bagging(Reptree) Using10 Multiple Datasets
Figure 7 shows results of the experiment. Results indicate that the proposed method performed better than bagging (Reptree) algorithm for all the datasets except the contraceptive dataset which showed similar performance. Bagging, is a machine learning ensemble meta-algorithm designed to improve the stability and accuracy of machine learning algorithms used in statistical classification. It also reduces variance and helps to avoid overfitting. When used with Reptree, the model produced has less accuracy classification performance and only works well for small datasets. On the other hand, models built using random forest has high accuracy classification and works well for large dataset. The proposed method has random forest as its base classifier and thus outperformed Bagging (Reptree).
Figure 7: Proposed Method verses Bagging (Reptree) Algorithm using 10 Multiclass Datasets 5.10 Experiment 9: Comparing Classification Performance of Proposed Method with JRipper Using 10 Multiclass Datasets
Figure 8 represents results of the experiment. Results indicate that the proposed method performed better than JRipper algorithm for all the datasets. JRipper is a rule-based classification algorithm that extracts rules directly from data. The algorithm orders the classes according to increasing class prevalence (fraction of instances that belong to a particular class). JRipper algorithm learn the rule set for smallest class first, treat the rest as negative class and then repeat with next smallest class as positive class. The proposed method use random forest to create forests of trees splitting with oblique hyperplanes that can gain accuracy as they grow without suffering from overtraining. The “forests” it builds, is an ensemble of decision trees, trained with the bagging method. The general idea of the bagging method which random forest utilize is that a combination of learning models increases the overall performance. Thus the proposed method outperformed JRipper algorithm due to its superiority attributed in the random forest algorithm and the effective feature selection approach provided by random subspace algorithm and moreover the effective way of building model through AdaBoost algorithm that focus on misclassified models.
5.11 Experiment 10: Comparing Classification Performance of Proposed Method with OneR Using 10 Multiclass Datasets
Figure 9 represents the results of the experiment.We observe the proposed method performed significantly better than OneR algorithm for all the datasets.OneR is a simple algorithm. The OneR builds one rule for each attribute in the training data and then selects the rule with the smallest error rate as its one rule. Thus OneR generates one level decision tree and has less classification accuracy. The proposed method use random forest which grows many classification trees. Thus the proposed method that uses random forest has many strategies and techniques geared towards improving performance as opposed to OneR algorithm.
Figure 9: Proposed Method verses OneR Algorithm using 10 Multiclass Datasets
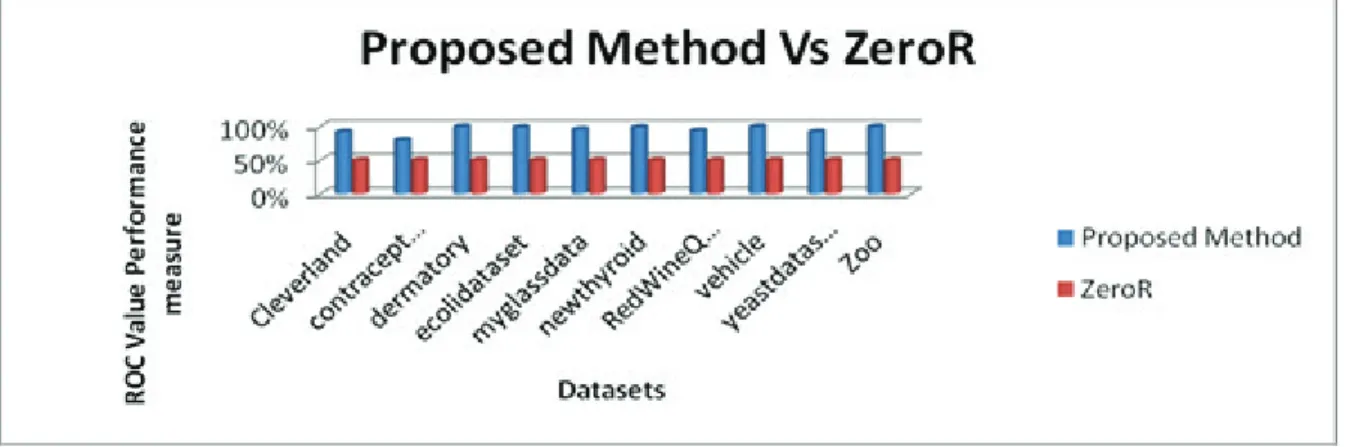
5.12 Experiment 11: Comparing Classification Performance of Proposed Method with ZeroRUsing10 Multiclass Datasets
Figure 10 represents results of the experiment. Results indicate that the proposed method significantly outperformed ZeroR algorithm for all the datasets. ZeroR is normally used as baseline for classification problems. ZeroR classifier uses only the target (dependent variable) to build a majority classifier. The proposed method used multiple classifiers built using random forest and boosted by AdaBoost and random subspace algorithms.
Figure 10:Proposed Method verses ZeroR Algorithm using 10 dataset
5.13 Experiment 12: Comparing Classification Performance of Proposed Method with C4.5 Using 10 Multiclass Datasets
Figure 11 represents results of the experiment. We observe the proposed method outperformedC4.5 (Decision Tree) algorithm for all the datasets except the Zoo dataset that registered significantly same performance.C4.5 algorithm takes the training data and generates a single tree. It also goes back over the tree to delete nodes or modify the internal structure. Pruning is performed to avoid overfitting. On the other hand, the proposed method uses random forest. The latter is a method in which a few thousand classification trees are built. For each tree, sampling with replacement of training instances is performed. For each node in each tree, a random subset of the attributes is done. While C4.5 algorithm use a single tree, random forest classifier is the average of several thousand trees generated using random subsets of dataset. Thus coupled with the boosting capabilities of AdaBoost and effective feature selection of random subspace, the proposed method had a better capability than C4.5 algorithm
Figure 11:Proposed Method verses C4.5 Algorithm using 10 Multiclass Dataset 5.14 Experiment 13: Metric Performance of the Proposed Method for Detecting Rare Classes
We sought to establish the performance of the proposed method with regards to detection of the rare classes. Performance was done before and after applying SMOTE technique. Table 8 presents the results. Results indicate that the proposed method improved in outlier detection with all the datasets except the vehicle dataset. The proposed method utilized SMOTE technique to improve on the visibility of the rare classes. The use of ensemble safe guarded the integrity of the majority classes as well as improving detection of the rare classes.
Table 8: ROC and F-Measure Outlier (Rare Class) Metric Performance for 10 Multiclass Datasets Using Proposed Method
6. Conclusion
The study showed that random forest algorithm can be boosted in its performance through ensemble of both AdaBoost and random subspace algorithms and utilizing the random forest as the base learner. The study demonstrated that ensemble techniques produce better outlier detection and classification classifiers than other well-known algorithms such as KNN, Ripper, and Naïve bayes. The study findings reaffirmed that ensemble learning can be realized through aggregating output of several models which results in a better results than the output of any individual model. This study reaffirmed the need for use of ensemble filter selection method to improve on the performance of classifiers and rebalancing datasets using SMOTE. The ensemble filter method provided an improved reliable effective way of preprocessing datasets. In this study, an ensemble filter selection method was developed and used in the development of the proposed model using four filter selection algorithms. There is need to explore the effect of creating an ensemble selection method using combination of filter and wrapper selection methods. Also skewed datasets were resampled using SMOTE algorithm to the extent that the resulting minority class distribution measured at least 50% match in comparison with the majority class. Further study could be done to ascertain an ideal percentage of resampling rather than choosing an arbitrary distribution measure. In this study the model built utilized the capabilities of boosting and bagging ensemble learning algorithms. We propose further study on combining the proposed method with deep learning algorithms.
7. References
Chawla, N. (2009). Data mining for imbalanced datasets: An overview. In Data mining and knowledge discovery handbook (pp. 875-886). Springer, Boston, MA.
Vajda, S., & Fink, G. A. (2010, November). Strategies for training robust neural network based digit recognizers on unbalanced data sets. In Frontiers in Handwriting Recognition (ICFHR), 2010 International Conference on (pp. 148-153). IEEE.
Athimethphat, M., & Lerteerawong, B. (2012, May). Binary classification tree for multiclass classification with observation-based clustering. In 2012 9th International Conference on Electrical Engineering/Electronics, Computer, Telecommunications and Information Technology (pp. 1-4). IEEE.
Elkano, M., Galar, M., Sanz, J., Lucca, G., & Bustince, H. (2017, June). IVOVO: A new interval-valued one-vs-one approach for multi-class classification problems. In Fuzzy Systems Association and 9th International Conference on Soft Computing and Intelligent Systems (IFSA-SCIS), 2017 Joint 17th World Congress of International (pp. 1-6). IEEE.
Coelho, L., & Richert, W. (2015). Building machine learning systems with Python. Packt Publishing Ltd. Allahyari, M., Pouriyeh, S., Assefi, M., Safaei, S., Trippe, E., Gutierrez, J. B., & Kochut, K. (2017). A brief
survey of text mining: Classification, clustering and extraction techniques. arXiv preprint arXiv:1707.02919. Han, J., Pei, J., & Kamber, M. (2011). Data mining: concepts and techniques. Elsevier.
Vinod, D. , & Vasudevan, V. (2016, March). A filter based feature set selection approach for big data classification of patient records. In Electrical, Electronics, and Optimization Techniques (ICEEOT), International Conference on (pp. 3684-3687). IEEE.
Kotsiantis, S., Zaharakis, I., & Pintelas, P. (2006). Machine learning: a review of classification and combining techniques. Artificial Intelligence Review, 26(3), 159-190.
Japkowicz, N., & Stephen, S. (2002). The class imbalance problem: A systematic study. Intelligent data analysis,
6(5), 429-449.
Guo, X., Yin, Y., Dong, C., Yang, G., & Zhou, G. (2008, October). On the class imbalance problem. In 2008 Fourth international conference on natural computation (Vol. 4, pp. 192-201). IEEE.
Ali, A., Shamsuddin, S. , & Ralescu, A. (2015). Classification with class imbalance problem: a review. Int J Adv Soft Comput Appl, 7(3), 176-204.
Oza, N. , & Russell, S. (2001). Online ensemble learning. University of California, Berkeley. Breiman, L. (1996). Bagging predictors. Machine learning, 24(2), 123-140.
Osanaiye, O., Cai, H., Choo, K. , Dehghantanha, A., Xu, Z., & Dlodlo, M. (2016). Ensemble-based multi-filter feature selection method for DDoS detection in cloud computing. EURASIP Journal on Wireless Communications and Networking, 2016(1), 130
Krawczyk, B. (2016). Learning from imbalanced data: open challenges and future directions. Progress in Artificial Intelligence, 5(4), 221-232.
Dietterich, T. G., & Bakiri, G. (1994). Solving multiclass learning problems via error-correcting output codes.
Journal of artificial intelligence research, 2, 263-286.
Zhang, Q. (Ed.). (2010). Visual Analytics and Interactive Technologies: Data, Text and Web Mining Applications: Data, Text and Web Mining Applications. IGI Global.
Aly, M. (2005). Survey on multiclass classification methods. Neural networks, 19, 1-9.
Elrahman, S., & Abraham, A. A Review of Class Imbalance Problem. Journal of Network and Innovative Computing, 1(2013), 332-340.
Chomboon, K., Kerdprasop, K., & Kerdprasop, N. (2013). Rare class discovery techniques for highly imbalance data. In Proc. International multi conference of engineers and computer scientists (Vol. 1).
Błaszczyński, J., & Stefanowski, J. (2018). Local data characteristics in learning classifiers from imbalanced data. In Advances in Data Analysis with Computational Intelligence Methods (pp. 51-85). Springer, Cham.