Aleksandra-Bradić Martinović3 UDK: 336.27:336.143(4-672EU) ; 330.43:336.2
Original Scientific Paper
Fiscal Reaction Function: Evidences from
CESEE countries
4Article history
Received: 10 October 2013 Sent for revision: 12 October 2013
Received in revised form: 11 November 2013 Accepted: 15 November 2013
Available online: 6 December 2013
Abstract: The aim of this paper is to improve on the methodology set in
pre-vious attempts to estimate the impact of gross government debt to primary balances in a wide set of 21 CESEE countries. Since the result of the long-lasting crisis in those countries is rising imbalance of public finances it is nec-essary to analyze what factors are causing such effects. Running the fixed effects, pooled and GMM regression it was found that both lagged govern-ment debt and output gap are positively related to primary balance. Moreover there was found evidence of non-linear relationship between primary balance and lagged debt, with fiscal fatigue occurrence at 70% threshold. Estimation of the augmented model shows that countercyclical response of primary bal-ance is more pronounced in economic downturn relative to boom in cycle.
Keywords: fiscal reaction function, CESEE region, public finances
Funkcija fiskalne reakcije: primer zemalja CESEE regiona
Apstrakt: Cilj ovog rada je unapređenje metodologije postavljene u ranijimistraživanjima drugih autora za procenu uticaj javnog duga na bruto primarni bilans u velikom skupu od 21 zemlje CESEE regiona. Jedna od posledica dugotrajne krize u tim zemljama je porast disbalansa javnih finansija te je neophodno analizirati koji faktori izazivaju takve efekte. Primenom regresije na panel podatke utvrđeno je da državni dug sa docnjom i autput jaz imaju pozitivan uticaj na primarni bilans. Takođe je potvrđena nelinearne veza
1
Institute of Economic Sciences, [email protected]
2
Economics Institute, [email protected]
3
Institute of Economic Sciences, [email protected]
4
The paper presents the results of a study conducted as part of the projects 179001, 179015 funded by the Ministry of Education, Science and Technological Development of the Republic of Serbia.
između primarnog bilansa u i dug sa docnjom, sa pojavom fiskalnog zamora na nivou od 70%. Procena uvećanog modela pokazuje da je kontracikličan odgovor primanog bilansa izraženiji tokom ekonomske krize u odnosu na period prosperiteta.
Ključne reči: funkcija fiskalne reakcije, CESEE region, javne finansije
1. Introduction
Economic crisis that recently hit the world left many European countries, both emerging and advanced, with public finance imbalances and sloppy growth prospects. Efforts of European countries to speed up economic growth and fight recession and rising levels of public debt revived academic discussion on instruments and efficiency of fiscal policy; interrelations between primary bal-ance, government debt and output fluctuations have become subject of many researches in recent years.
Main objective of our work is to analyze how primary balances in emerging European economies adjust to dynamic of gross government debt and econ-omy cycle, based on empirical estimation of fiscal reaction function. The fiscal reaction function shows the response of the primary budget balance to GDP ratio to a set of macroeconomic and institutional variables, of which the debt-to-GDP ratio and the output gap are the most important ones (Eller and Urvo-va, 2012). It describes the average response of actual primary balances after controlling for cyclical fluctuations, the lagged public debt-to-GDP ratio, and political and institutional variables (Medeiros, 2012).
Estimation of fiscal reaction function for advanced and emerging economies was under attention of several empirical works in last couple of years, espe-cially as a part of the wider framework of debt sustainability analysis (Celasun, Debrun and Ostry, 2007; Ghosh et al., 2011; Medeiros, 2012; Eller and Urvo-va, 2012; Baldi and Staehr 2013). Regarding the time span and countries comprised, our work is closely connected to Eller and Urvova (2012) work, who estimate the fiscal reaction function for a panel of eight CESEE countries (Bulgaria, Croatia, the Czech Republic, Hungary, Poland, Romania, Slovakia, Slovenia) and a maximum of 17 years (1995–2011). However, we extend our analysis to include all 21 CESEE countries for the data available in the period 1995-2012. In addition, we recognize that these countries are not homogene-ous vis-à-vis a broader economic framework and explore whether the differ-ences in the fiscal reaction exist when membership in EU and exchange rate regime are controlled for. Eventually we analyze if fiscal reaction differs in pre-Lehman and post-pre-Lehman period, when most of the countries in sample were affected by common exogenous shock.
The work is structured as follows. In the second section, we give broader theoretical framework on relations between primary balance, debt sustainabil-ity and cyclical behavior of fiscal policy. In the third section, we present some stylized facts on size and dynamics of primary balance, gross government debt and output gap for given sample of countries. Fourth section deals with specification of econometrical model and estimation issues. Fifth section pre-sents and discusses the results of empirical estimation.
2. Theoretical Framework: Fiscal Reaction Function, Fiscal
Sustainability and Cyclical Behavior of Fiscal Policy
The discussion on fiscal reaction function is basically discussion on fiscal sustainability and cyclical behavior of fiscal policy, i.e. on relationship between government debt, deficit and GDP growth, having in mind that debt accumu-lated over time and growth prospects are main drivers of primary balances. Generally, growth path of the debt could be described by the debt accumula-tion equaaccumula-tion:
, (1)
where denotes level of government debt at time t and budget deficit at time t. In absolute terms, if government running the budget deficit, this will increase current level of debt. However, in relative terms (relative to current GDP) this is not so straightforward; if GDP grows at high level, share of ac-cumulated debt to GDP in previous year will drop relative to GDP in current year and this drop could offset budget deficit relative to GDP. With GDP growth high enough, it is possible for government to stabilize debt to GDP level in long-run even if it runs the deficit all the time. This could be explained by the following simplified equation (by ignoring time):
(2)
where is long-run equilibrium debt to GDP level, is budget deficit to GDP, and real growth rate of GDP and inflation rate (that in total ac-counts nominal GDP rate).
1 t t t
D
=
D
−+
Def
tD
Def
t * rdef
d
g
π
=
+
*d
def
rg
π
Nevertheless, rise of public debt raises additional concerns regarding the structure of budget deficit. Generally, budget deficit could be decomposed to sum of debt servicing costs and primary deficit , both given relative to GDP5:
(3) Even if government runs stable level of primary deficit to GDP, budget deficit could increase over time due to an increase in debt servicing costs. If We
assume with no loss of generality that debt servicing cost are approximately equal to interest payment for countries that issued debt in domestic currency, debt accumulation equation could be further decomposed (in relative terms) as follows:
(4) where and denotes nominal interest and GDP growth rates, respectively, and expression now represents stock of accumulated debt enlarged with interest payment, corrected by GDP growth rate which reduces relative debt to GDP ratio6.
Furthermore, if we rewriting this equation with primary balance on the left-hand side, it shows in a very straightforward manner that level of debt accu-mulated and GDP growth are two substantial channels in transmission mech-anism that eventually determine primary, and consequently, overall budget deficit. Any other adjustment of primary deficit could be achieved only by increasing government debt.
(
1
)
1t t t t t
pd
=
d
− + −
i
g d
− (5)In order to expand analysis to encompass cyclical behavior of fiscal policy, prima-ry balance (pb) is further decomposed to the cyclically adjusted primary budget balance and cyclical part of the primary budget balance that automatically reacts to the economic cycle. The cyclically adjusted primary budget balance (capb),
5
In debt sustainability arithmetic, for sake of more convenient intuitive interpretation, it is usual to consider primary deficit instead of primary balance, which means that pri-mary deficit has the positive value if government spending (without interest payments) exceeds revenues.
6
Difference between interest and growth rate within debt sustainability framework is usually referred in literature as “interest rate-growth differential”
dsc
pd
def
=
dsc
+
pd
(
1
)
1 t t t t td
= + −
i
g d
−+
pd
ti
g
t(
1
+ −
i
tg d
t)
t−1also known as structural balance, indicates discretionary fiscal policy measures because that is not directly affected by the economic cycle. The cyclical part of the primary budget balance (cpb) is an indicator of automatic fiscal stabilizers because it is directly influenced by cyclical fluctuations in the economy. More precisely, automatic stabilizers refer to fiscal categories that automatically react to the economic cycle without any intervention by fiscal policy authorities. (Ange-lovska Bezovska et al, 2011). This can be quantified by simple equation:
t t t
pb
=
capb
+
cpb
(6)The estimation of cyclically adjusted primary budget balance shows the cycli-cal behavior of fiscycli-cal policy. A fiscycli-cal policy can be considered counter-cyclicycli-cal if it is expansive (capb increases) in the situation of a negative output gap and restrictive (capb decreases) in the situation where the actual growth of GDP is above its potential rate. On the other hand, a fiscal policy is characterized as pro-cyclical if in a situation of a negative output gap the government employs restrictive fiscal instruments and when the fiscal policy reacts in an expan-sionary way in the situation of a positive output gap, where the actual output exceeds the estimated potential GDP.7
3. Government Debt, Output Gap and Primary Balance in
CESEE Countries: Stylized Facts
For the purpose of analysis between countries, we classified countries into following groups:
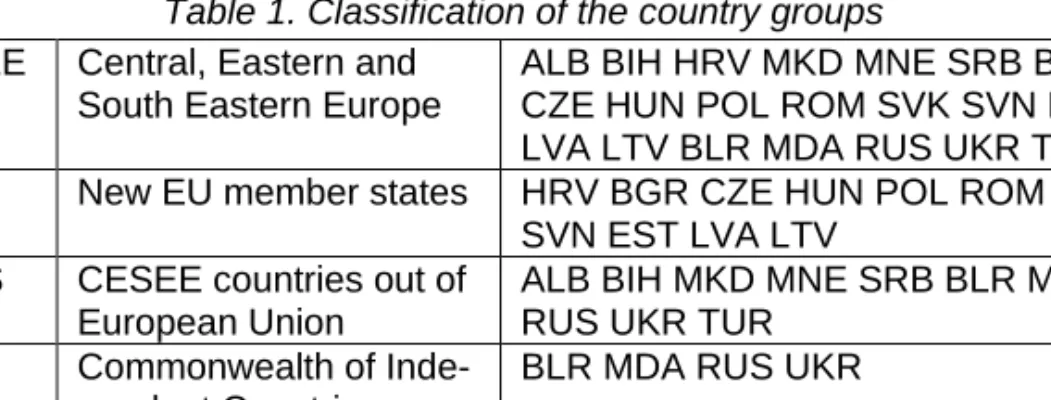
Table 1. Classification of the country groups
CESEE Central, Eastern and South Eastern Europe
ALB BIH HRV MKD MNE SRB BGR CZE HUN POL ROM SVK SVN EST LVA LTV BLR MDA RUS UKR TUR NMS New EU member states HRV BGR CZE HUN POL ROM SVK
SVN EST LVA LTV NoMS CESEE countries out of
European Union
ALB BIH MKD MNE SRB BLR MDA RUS UKR TUR
CIS Commonwealth of Inde-pendent Countries – only European members
BLR MDA RUS UKR
B5 Balkan five ALB BIH MKD MNE SRB
Source: Author
7
Adopted from Mencinger and Aristovnik (2013), who provide reasoning on cyclical behavior using cyclically adjusted overall budget balance instead of cyclically adjusted primary budget balance.
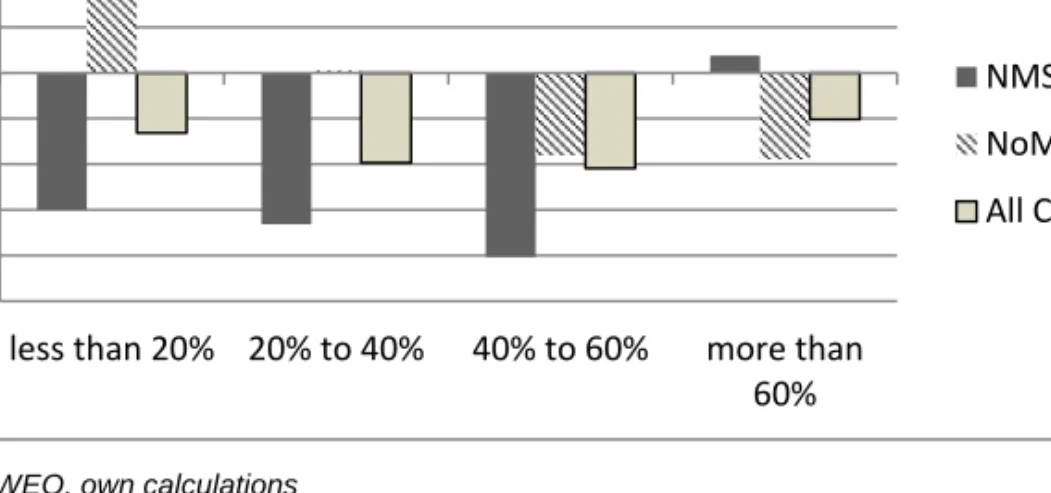
Basic classification is related to the distinction between new EU member states and countries out of EU. As some of CESEE countries became Euro-zone members in recent years, their decisions on primary and budget balance levels were influenced by Maastricht criteria for Eurozone admission (Mencin-ger and Aristovnik, 2013). In addition, NMS are generally considered to be more developed than other CESEE countries, and some of them are even regarded as advanced economies by IMF classification (like Estonia and Czech Republic). As we are particularly interested in Balkan region, NoMS group is divided into two sub-groups Balkan five B5 (without Turkey) and Eu-ropean members of the Commonwealth of Independent Countries (CIS). Before presenting the methodology and empirical results on estimation of fiscal reaction function, we present some stylized facts on expansionary char-acter and cyclical behavior of fiscal policy in CESEE countries. Figure 1 pro-vides a preliminary summary of average primary balance to GDP ratio levels across lagged debt to GDP ratio8 categories for a particular sub-group of countries. Lagged debt to GDP ratio observation values are grouped into 4 categories: low levels (below 20%), middle-low levels (between 20 and 40%), middle-high levels (between 40% and 60%) and high levels (more than 60%). Such approach is loosely inspired by Reinhart and Rogoff (2010) famous work, who in similar manner explored influence of public debt levels to GDP growth with the difference that we took smaller values of debt thresholds in regard to generally lower level of indebtedness of CESEE countries relative to advanced countries. The bars show the average primary balance to GDP ratio of four debt categories, distinguishing between the EU new member states (NMS) and CESEE countries out of EU (NoMS). From the Figure 1 one can observe considerable differences and even opposite tendencies9 in relation between level of primary balance to GDP and lagged value of debt with very ambiguous patterns of co-movements. However, when all CESEE countries are analyzed, seems that non-linearity pattern of primary balance and lagged debt to GDP co-movements is observed.
8
Lagged debt is used rather than current values which correspond to debt sustainabil-ity arithmetic and also empirical specification of fiscal reaction function that is estimat-ed further in the text.
9
Figure 1. Relation between primary balance and different levels of lagged public debt for NMS and NoMS countries
Source: WEO, own calculations
In similar manner, we also analyzed behavior of primary balance relative to output gap10. Opposite to previous case, linear relationship between output gap and primary balance is obvious and positive for all CESEE countries and two sub-groups, suggesting countercyclical behavior of primary balance (in-creasing primary deficits corresponds to negative output gap and in(in-creasing primary surplus corresponds to positive output gap).
Figure 2. Relation between primary balance and different levels of output gap for NMS and NoMS countries
Source: WEO, own calculations
10
Details on output gap calculations are given in section 4 -2,5-2
-1,5-1 -0,50 0,51 1,52
less than 20% 20% to 40% 40% to 60% more than
60% NMS NoMS All CESEE -4 -3 -2 -1 0 1 2
less than -5% -5% to 0% 0% to 5% more than 5%
NMS NoMS All CESEE
4. Econometrical model
In line with theoretical framework and existing literature (Debrun, Celasun and Ostry, 2007; Medeiros, 2012; Eller and Urvova, 2012), we use following speci-fication of fiscal reaction function in order to empirically estimate effects of government debt and output gap on primary balance:
, , 1 , , , , i t i t i t i t i t i i t pb = +
α β
d − +γ
gap +Xδ
+Dθ η
+ +ε
(7) where: , i tpb is a primary balance to GDP ratio at time t,
, 1
i t
d − is a gross government debt to GDP ratio at time t-1
,
i t
gap is an estimated output gap as percentage of GDP at time t
,
i t
X is a vector of control variables
,
i t
D is a vector of dummy variables
i
η
is a country fixed effect and,
i t
ε
is a random error,ε
i t,−
N
(
0,
σ
ε2)
Estimation of regression equation encounters two possible issues, heteroge-neity and endogeheteroge-neity, which can lead to biased estimation of regression parameters if pooled estimators are used. Heterogeneity is related to the country-specific effects which reflect unobserved differences between the countries that could not be explained by the model variables. This issue is generally overcome by using fixed effects method of econometrical estimation that include a sole dummy variable for each country in sample to capture country specific effects if exist ( in model specification). Endogeneity refers to the issue of violating the exogeneity property of explanatory variables in the model, which is the important assumption of the unbiased estimation. Accord-ing to Medeiros (2012), three potential sources of exogeneity exist in the fiscal reaction function specification: contemporaneity of the output gap and the fiscal policy shock , dependence of lagged debt on past values of the pri-mary balance (so-called reverse causality issue) and persistence of errors, making lagged debt endogenous. Literature usually proposes GMM, LIML and IV estimation techniques to overcome this issue11. However, Eller and Urvova
11
General Method of Moments and Limited Information Maximum Likelihood approach as in Celasun, Debrun and Ostry (2007) or Instrumental variables approach as in Medeiros (2012). i
η
, i tε
(2102) provide arguments about limited power of GMM estimator when num-ber is large to the numnum-ber of observations as in our case. Thus, we use fixed effects estimator as a main tool to calibrate model and GMM estimator to check robustness of results.
Previous literature in the field considers large number of control variables, both of economic (like oil prices, CPI inflation, openness) and institutional nature (like index of institutional quality, commitment to IMF programs, fiscal rules index, election indicators). Eller and Urvova (2102) found that institu-tional factors do not exhibit explanatory power in selected CESSE fiscal reac-tion funcreac-tion, so we direct our work to testing effects of wide range of macroe-conomic variables on primary balance rather than institutional. Similar to pre-vious work, we also explored non-linearites in government debt – primary balance relation. In addition to control variables, we use a set of dummy vari-ables to explore other issues that potentially affect decisions on primary bal-ance, like EU membership, exchange rate regime, post-Lehman recession, state of economy cycle and previous history of debt dynamic.
5. Empirical results
The data used in model estimation are obtained from IMF WEO database. Output gap is calculated using HP filter with smoothing parameter set to 100, which is popular choice and conventional wisdom (Choudhary et al. 2013). Time coverage varies across the countries from 18 years (1995 – 2012) to 9 years (2004 – 2012) period, regarding the data availability. Data coverage for particular countries is given in annex of the paper.
First we estimated model without control and dummy variables and then ex-perimented with controlling for standard macroeconomic variables, looking for those which increase adjusted R squared when added and which are the most persistent in size, sign and significance of coefficients estimated in re-gression. Eventually, we kept inflation, unemployment rate, terms of trade and debt squared which altogether with lagged gross government debt and output gap formed our baseline specification of the empirical model. Table 2 pre-sents results of fixed effects estimation of our baseline regression model with gradual adding of control variables. Additionally, we run pooled and GMM12 regressions to check robustness of the coefficients estimated by FE method.
12
In GMM estimation lagged debt and output gap are instrumented by inflation, terms of trade, openness, external demand, unemployment rate and lagged values of prima-ry balance, output gap and lagged debt, similar to Medeiros (2012).
Table 2. Estimates of the fiscal reaction function – baseline specification FE Pooled GMM Lagged GG Debt 0.0609 *** 0.0514*** 0.0513*** 0.0457*** 0.0766*** 0.0816*** 0.1188** (0.0130) (0.0135) (0.0131) (0.0134) (0.0219) (0.0216) (0.0469) Output Gap 0.2282*** 0.2063*** 0.2919*** 0.2853*** 0.2611*** 0.1812*** 0.2017*** (0.0360) (0.0369) (0.0432) (0.0432) (0.0450) (0.0394) (0.0696) Inflation 0.0502** 0.0526** 0.0583** 0.0597** 0.0697** (0.0221) (0.0212) (0.0213) (0.0213) (0.0207) Unemployment rate 0.0023 ** 0.0023*** 0.0021*** 0.0005 (0.0006) (0.0006) (0.0006) (0.0004) Terms of trade -0.0002** -0.00018 -0.00009 (0.00014) (0.00014) (0.00013) Lagged Debt squared -0.0540 * -0.082*** -0.180*** (0.0303) (0.0293) (0.0656) Const -0.032*** -0.032*** -0.0612*** -0.0331** -0.0398** -0.0281* -0.029*** (0.0049) (0.0048) (0.0094) (0.0183) (0.0186) (0.017) (0.0078) Number of observations 253 253 243 243 243 243 201 Adj R Squared 0.4045 0.4150 0.4644 0.4721 0.4773
Note: Standard errors in the parenthesis.
Levels of significance: * p<0.1, ** p<0.05, *** p<0.01
Source: Authors
The estimated coefficient for the lagged debt to GDP ratio is positive and var-ies within the range 0.045 - 0.061 when possible non-linearity is not taken into account. This means that increase in gross government debt of 1 percentage point leads to approximately 0.055% percentage points increase in primary balance in the next year. As already mentioned, we use unadjusted primary balance so it is hard to explicitly distinguish which of its component has more influence on the size, sign and significance of the coefficient estimated. How-ever, we suppose that in pre-Lehman period automatic stabilizers were more important, as high growth rates especially during the boom period in 2000s open fiscal space for countries to pursue expansionary fiscal policy and de-crease primary deficits at the same time. We assume also that in post-Lehman period the size of this effect has decreased, as most of the CESEE countries continue to increase government debt even at higher rates, but re-cession of economic activity diminished effects of automatic stabilizers. When included, lagged debt squared is statistically significant variable with negative sign of the coefficient estimated. Presence of non-linearity in primary balance that we found corresponds to the issue of “fiscal fatigue” in budgetary adjustment process, i.e. at high levels of public debt government needs to
decrease primary balance in order to preserve debt sustainability. This cre-ates Laffer-type relationship when high levels of debt accumulated implies decline in primary balance response, although it remains positive. Using the quadratic specification of fiscal reaction function with lagged debt squared included, as given below, it is possible to calculate threshold value of govern-ment debt when fiscal fatigue occurs:
2
, 1 , 1 2 , 1 , , ,
i t i t i t i t i t i i t
pb
= +
α β
d
−+
β
d
−+
γ
gap
+
X
δ η ε
+ +
(8) Taking partial derivative with respect to debt, it is convenient to calculate turn-ing point in non-linear form., * 1 1 2 , 1 , 1 , 2
2
,
2
i t i t i t i tpb
d
d
d
β
β
β
β
− −∂
=
−
=
∂
(‘9)Gosh et al (2011) provide evidences for sample of advanced economies that fiscal fatigue occurs at 90 - 100% interval of debt to GDP ratio, while Medeiros (2012) found similar threshold interval (80 – 90%) for sample of 21 EU mem-bers. In the same fashion, we found that debt threshold value for fiscal fatigue occurrence is around 70% for our sample of countries.
The estimated coefficient for the contemporaneous output gap is also positive and varies within the range 0.2 - 0.3, which is in line with positive correlation pattern observed in Figure 2. It is worthy to mention here that our values of estimated coefficients for both lagged debt and output gap are remarkably close to those obtained by Eller and Urvova (2012). As Celasun, Debrun and Ostry (2007) noted, fiscal balances react to economic fluctuations both through the discretionary attempts of policymakers to stabilize output fluctua-tions and the tendency for primary balances to “automatically” decline (in-crease) during cyclical downturns (expansions). We assume that countercy-clical property of primary balance adjustments to contemporaneous output gap is caused by effects of automatic stabilizers rather than actions of policy makers, especially because most of CESEE countries persuaded pro-cyclical fiscal policy during the boom period (IMF, 2012). However, when output gap is under consideration, one should always be cautious that output gap is com-puted as technical variable obtained by de-trending of given time series rather than frontier value of country production function; therefore, it can be very sensitive to the span of comprised data when calculated.
We augmented our baseline model specification with dummy variables to test several assumptions about possible effects that some other factors could have on fiscal reaction. In order to avoid overestimation of the model with too
many variables, we run separate regressions for each dummy taken into ac-count.
Table 3. Estimates of the fiscal reaction function – augmented specification
FE Pooled FE Lagged Public Debt 0.0854*** 0.0734*** 0.0554** 0.0736*** 0.0725*** 0.0674*** (0.0219) (0.0212) (0.0215) (0.0223) (0.0215) (0.0223) Output Gap 0.2437*** 0.2352*** 0.1826*** 0.2606*** 0.2438*** 0.1750*** (0.0452) (0.0422) (0.0468) (0.0451) (0.0447) (0.0639) Inflation 0.0547* 0.0584*** 0.0353* 0.0593*** 0.0655*** 0.0650*** (0.0211) (0.0206) (0.0211) (0.0213) (0.0210) (0.0213) Unemployment rate 0.0016** 0.0016** 0.0015** 0.0022*** 0.0022*** 0.0023*** (0.0007) (0.0005) (0.0006) (0.0007) (0.0006) (0.0007) Terms of trade -0.0001 -0.0001 -0.0001 -0.0001 -0.0002 -0.0001 (0.0001) (0.0001) (0.0001) (0.0001) (0.0001) (0.0001) Debt squared -0.0698** -0.0590** -0.0221 -0.0645* -0.0315 -0.0360 (0.0307) (0.0292) (0.0300) (0.0334) (0.0307) (0.0316) Const -0.0292 -0.0374* -0.0240 -0.0388* -0.0372* -0.0391** (0.0189) (0.0166) (0.018) (0.0187) (0.0183) (0.0185) FX dummy -0.0144** (0.0060) B5 dummy -0.0248** (0.0117) CIS dummy 0.0327*** (0.0098) Recession dummy -0.0149*** (0.0033) Debt spline 0.00971 * lagged debt (0.0129) Debt differ-ence -0.022*** * lagged debt (0.0076) Negative OG 0.2410*** * output gap (0.1273) Adj R Squared 0.488 4 0.518 0.4762 0.4952 0.4834
Note: Standard errors in the parenthesis.
Levels of significance: * p<0.1, ** p<0.05, *** p<0.01
It is common wisdom that economies with fixed exchange rate regime have less instruments of monetary policy available. Although mechanism of mone-tary transmissions is beyond scope of this research, we assume that ex-change rate regime could influence adjustment of primary balance. Further-more, we illustrate differences in fiscal reaction for NMS and NoMS in Figures 1 and 2. Among the NoMS we distinguish CIS and B5 countries as we think that economic and political background of these groups of countries is quite different. As already explained, we assume that in post-Lehman period ad-justment of primary balances to explanatory variables declines. All of these assumptions seems to be confirmed by the estimated statistical significance of dummy variables (FX, B5, CIS and Recession dummies).
Further, we consider interaction of some dummy and explanatory variables, as suggested in previous work. Celasun, Debrun and Ostry (2007) include in the model the debt spline at arbitrary selected threshold value of 50%. We use historical average on gross government debt as debt spline threshold, however didn’t find empirical evidence of its significance. Also, preceding studies usually consider if response of primary balance to output fluctuation depends on whether a cycle is in boom phase (when output gap is positive) or bust phase (when output gap is negative). We found evidences that counter-cyclical response of primary balance is more pronounced in economic down-turn. Eventually, we assume that not only level of lagged debt is important for primary balance adjustment, but also if the debt previously increase or de-crease. Estimation supports this reasoning and negative value of estimated coefficient suggest that previous increase in government debt will have dimin-ishing effect on size of primary balance adjustment next year.
5. Conclusions
In this work we analyze how primary balances in CESEE countries adjust to dynamic of gross government debt and economy cycle, based on empirical estimation of fiscal reaction function. Based on sample of 21 CESEE coun-tries for time period 1995-2012, we found evidences that both lagged gov-ernment debt and output gap are positively related to primary balance, i.e. that any increase (decrease) of debt or output gap will increase (decrease) primary balance in adjustment process. This result is very strong and do not depend neither on econometric estimation method applied nor addition of control variables in the model. Among the many variables that we controlled for, inflation, unemployment rate and terms of trade seems to be most im-portant. Further, we found evidence of non-linear relationship between prima-ry balance and lagged debt, with fiscal fatigue occurrence at 70% threshold. Estimation of the augmented model shows that countercyclical response of primary balance is more pronounced in economic downturn relative to boom
in cycle. Eventually, we provide evidences that response of primary balance to lagged debt and output gap is not homogenous across countries and time period in the sample, as well as that it also depends on exchange rate regime.
References:
Angelovska Bezovska, A., Bogoev, J., Mitreska, A., & Vojnovik. Kadievska, M. (2011). Investigating the Cyclical Behavior of Fiscal Policy in the Republic of Macedonia during the Period of Transition. Croatian Economic Survey, 13(1), 57-104. Baldi, G., & Staehr.K., (2013). The European Debt Crisis and Fiscal Reaction
Func-tions in Europe 2000-2012. German Institute for Economic Research Discussion Papers 1295.
Celasun, O., Debrun, X., & Ostry.J., (2007). Primary Surplus Behavior and Risks to Fiscal Sustainability in Emerging Market Countries: A ‘Fan-Chart' Approach. IMF Staff Paper 53/3..
Choudhary, A., Hanif, N., & Iqbal.J., (2013). On smoothing macroeconomic time series using HP and modified HP filter. Munich Personal RePEc Archive Paper No. 45630.
Eller, M., & Urvova.J., (2012). How Sustainable Are Public Debt Levels in Emerging Europe? Focus on European Economic Integration Q4/12. (pp. 48-79). Oester-reichische Nationalbank.
Ghosh, A., Kim, J., Mendoza, E., Ostry, J., & Qureshi.M., (2011). Fiscal fatigue, fiscal space and debt sustainability in advanced economies. National Bureau of Eco-nomic. Research Working Paper 16782..
-International Monetary Fund. (2012). How Emerging Europe Came Through the 2008/09 Crisis.
Medeiros, J. (2012). Stochastic debt simulation using VAR models and a panel fiscal reaction function: Results for a selected number of countries. European Com-mission Economic Papers 459.
Mencinger, J., & Aristovnik.A., (2013). Fiscal Policy Stance in the European Union: The Impact of the Euro.Engineering Economics, 24(1), 52-62.
Reinhart, C.M., & Rogoff, K.S. (2010). Growth in a Time of Debt. American Economic Review, 100(2), 573-578. doi:10.1257/aer.100.2.573
Annex – Data Coverage by Year and Country
Country Starting year
Albania 1997
Bosnia & Herzegovina 2004
Croatia 2002 Macedonia 2000 Montenegro 2002 Serbia 2002 Bulgaria 2002 Czech Republic 1995 Hungary 1995 Poland 1995 Romania 2004 Slovakia 1997 Slovenia 1995 Estonia 2003 Latvia 2003 Lithuania 2000 Belarus 1998 Moldavia 2004 Russia 1998 Ukraine 2004 Turkey 1997