Bubble-Up: Increasing Utilization in Modern Warehouse
Scale Computers via Sensible Co-locations
Jason Mars
University of Virginia[email protected]
Lingjia Tang
University of Virginia[email protected]
Robert Hundt
Google[email protected]
Kevin Skadron
University of Virginia[email protected]
Mary Lou Soffa
University of Virginia
[email protected]
ABSTRACT
As much of the world’s computing continues to move into the cloud, the overprovisioning of computing resources to
ensure the performance isolation oflatency-sensitive tasks,
such as web search, in modern datacenters is a major con-tributor to low machine utilization. Being unable to accu-rately predict performance degradation due to contention for shared resources on multicore systems has led to the heavy handed approach of simply disallowing the co-location of high-priority, latency-sensitive tasks with other tasks.
Per-forming thisprecise prediction has been a challenging and
unsolved problem.
In this paper, we present Bubble-Up, a
characteriza-tion methodology that enables the accurate prediccharacteriza-tion of the performance degradation that results from contention for shared resources in the memory subsystem. By using a
bubbleto apply a tunable amount of “pressure” to the
mem-ory subsystem on processors in production datacenters, our methodology can predict the performance interference be-tween co-locate applications with an accuracy within 1% to 2% of the actual performance degradation. Using this methodology to arrive at “sensible” co-locations in Google’s production datacenters with real-world large-scale applica-tions, we can improve the utilization of a 500-machine clus-ter by 50% to 90% while guaranteeing a high quality of ser-vice of latency-sensitive applications.
Categories and Subject Descriptors
B.3.3 [Hardware]: Memory Structures—Performance
Anal-ysis and Design Aids; C.4 [Computer Systems
Orga-nization]: Performance of Systems—Design studies; D.4.8 [Operating Systems]: Performance—measurements, mon-itors
General Terms
Design, Performance, Measurement
Permission to make digital or hard copies of all or part of this work for personal or classroom use is granted without fee provided that copies are not made or distributed for profit or commercial advantage and that copies bear this notice and the full citation on the first page. To copy otherwise, to republish, to post on servers or to redistribute to lists, requires prior specific permission and/or a fee.
MICRO’11,December 3–7, 2011, Porto Alegre, Brazil. Copyright 2011 ACM 978-1-4503-1053-6/11/12 ...$10.00.
85% 90% 95% 100%
ads bigtable maps protobuf sawzall semantic
QoS (1/latency) 60% 65% 70% 75% 80%
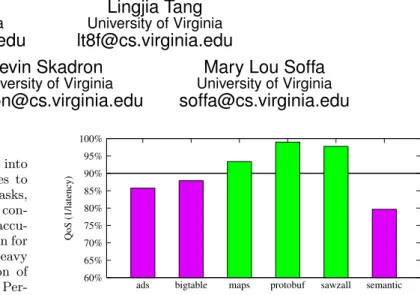
Figure 1: Some co-locations violate web search’s 90% QoS threshold. The inability to precisely pre-dict this performance interference leads to disallow-ing co-location for web searchand consequently, low machine utilization.
1.
INTRODUCTION
“Warehouse scale computers” (WSCs) [12, 22] house large scale web applications and cloud services. The cost of con-struction and operation of these datacenters ranges from tens to hundreds of millions of dollars. As more computing moves into the cloud, it is becoming exceedingly important to leverage the resources in WSCs as efficiently as possi-ble. However, the utilization of the computing resources in modern WSCs remains low, often not exceeding 20% [2].
Each machine in the datacenter house numerous cores, of-ten 4 to 8 cores per socket, and 2 to 4 sockets per machine. However, in light of the significant potential for parallelism on a single machine, there are a number of resources shared among cores. This sharing can result in performance inter-ference across-cores, negatively and unpredictably impact-ing the quality of service (QoS) of user-facimpact-ing and latency-sensitive application threads [36]. To avoid the potential for interference, co-location is disallowed for latency-sensitive applications, leaving cores idle, and resulting in an overpro-visioning that negatively impacts the utilization of the entire datacenter.
This overprovisioning is often unnecessary, as co-locations may or may not result in significant performance interfer-ence. Figure 1 demonstrates this uncertainty. In this
fig-ure, we show the performance ( 1
latency), normalized to solo execution, of a key user-facing component of Google’s web search when co-located with other Google workloads on a single socket. The horizontal line shows the maximum al-lowable performance interference. The co-location of some This is the author's version of the work. The authoritative version appears in Proceedings of MICRO 2011.
app
QoS
bubble’s pressure
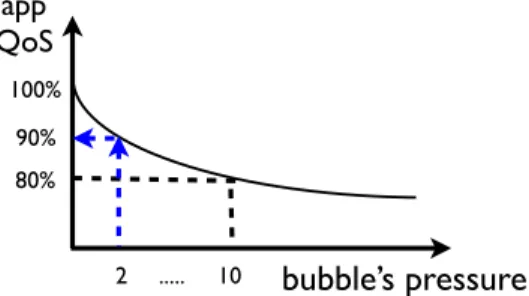
100% 90% 80% 2 ... 10Figure 2: Example sensitivity curve for A. Assum-ingB’s pressure score is 2 we can predict A will be performing at 90% of full performance.
workloads does not violate this QoS threshold (light bars), while others violate the threshold (dark bars). An
inabil-ity toprecisely predict the performance impact for a given
co-location leads to the heavy handed solution of simply disallowing co-location. On the other hand, without pre-diction, profiling all possible co-locations’ performance in-terference beforehand to guide co-location decisions is pro-hibitively expensive. The profiling complexity for all
pair-wise co-locations is O(N2
) (N as the number of
applica-tions). With hundreds to thousands of applications running in a datacenter, and the frequent development and updating of these applications, a brute-force profiling approach is not practical.
The goal of this work is to enable theprecise prediction
of the performance degradation that results from contention
for shared resources in the memory subsystem. A precise
prediction is one that provides an expected amount of per-formance lost when located. With this information, co-locations that do not violate the QoS threshold of an appli-cation can be allowed, resulting in improved utilization in the datacenter.
This is a challenging problem. The most relevant
re-lated work aims to classify applications based on how ag-gressive they are for the shared memory resources and iden-tify co-locations to reduce contention based on the classifi-cation [3,16,17,21,23,24,37,39,41]. However prior work has not presented a solution to precisely predict the amount of performance degradation suffered by each application due to co-location, which is essential for co-location decisions of latency-sensitive applications in WSCs. In this work, we
present such a solution: TheBubble-Upmethodology.
The key insight of Bubble-Up is that predicting the perfor-mance interference of co-running applications can be decou-pled into 1) measuring the pressure on the memory subsys-tem an application generates, and 2) measuring how much an application suffers from different levels of pressure. The underlying hypothesis is both pressure and sensitivity can be quantified using a common pressure metric. Having such a metric reduces the complexity of co-location analysis. As opposed to the brute force approach of profiling and charac-terizing every possible pairwise co-location, Bubble-Up only requires characterizing each application once to produce
pre-cise pairwise interference predictions (e.g. O(N)).
Bubble-Up is a two-step characterization process. First,
each application is tested against an expanding bubble to
produce a sensitivity curve. The bubble is a carefully
de-signed stress test for the memory subsystem that provides a “dial” for the amount of pressure applied to the entire
memory subsystem. This bubble is run along with the host application being characterized. As this dial is increased au-tomatically (expanding the bubble), the impact on the host application is recorded, producing a sensitivity curve for the host application such as the one illustrated in Figure 2. On the y-axis, we have the normalized QoS performance of the application (latency, throughput, etc), and the x-axis shows the bubble pressure. In the second step, we identify a
pres-sure score for the application using a bubble pressure score
reporter. After these two steps of the Bubble-Up method-ology is applied to each application, we have a sensitivity curve and a pressure score for each application. Given two
applicationsAandB, we can then predict the performance
impact of applicationAwhen co-located with applicationB
by usingA’s sensitivity curve to look up the relative
perfor-mance of A, at B’s pressure score. In the example shown
in Figure 2, B has a pressure score of 2, and as we can
see fromA’s sensitivity curve,A’s predicted QoS with that
co-location is 90%.
The specific contributions of this work are as follows:
• We present the design ofBubble-Up, a general
char-acterization methodology that enables theprecise
pre-diction of the performance degradation suffered by ar-bitrary applications when co-located.
• We introduce 17 production Google workloads and
char-acterize their propensity to performance interference when co-located on production servers.
• In addition to demonstrating the prediction accuracy
of our Bubble-Up methodology on the spectrum of
contentious kernel in ourSmashBenchsuite, we also
evaluate the prediction accuracy and the improvement in utilization when applying the Bubble-Up method-ology to steer pairwise co-locations of Google applica-tions in a production datacenter environment. Using Bubble-Up, we are able to precisely predict the performance degradation due to arbitrary co-locations of Google applications with at most a 2.2% error and often less than 1%. To evaluate using Bubble-Up to steer QoS enforced co-locations of production workloads, we perform a study in a 500-machine cluster and are able to increase the machine utilization in the cluster by 50%–90%, depending on the latency-sensitive applications’ allowable QoS thresh-old.
2.
BACKGROUND
In this section, we describe how large-scale web-services are run in modern datacenters. We then discuss QoS and co-locations in production datacenters.
2.1
Datacenter Task Placement
In modern warehouse scale computers, eachweb-serviceis
composed of one to hundreds of applicationtasks, and each
task runs on a single machine. A task is composed of an
application binary, associated data, and a configuration file that specifies the machine level resources required. These resources include the number of cores, amount of memory, and disk space that are to be allocated to the task. The configuration file for a tasks may also include special rules for the cluster manager such as whether to disallow co-locations with other tasks.
cluster manager
...
core3
server
core1 core2 core4
latency-sensitive
core3
server
core1 core2 core4
batch batch core3
server
core1 core2 core4
batch batch core3
server
core1 core2 core4
batch batch
core3
server
core1 core2 core4
batch batch
tasks
...
latency-sensitive
...
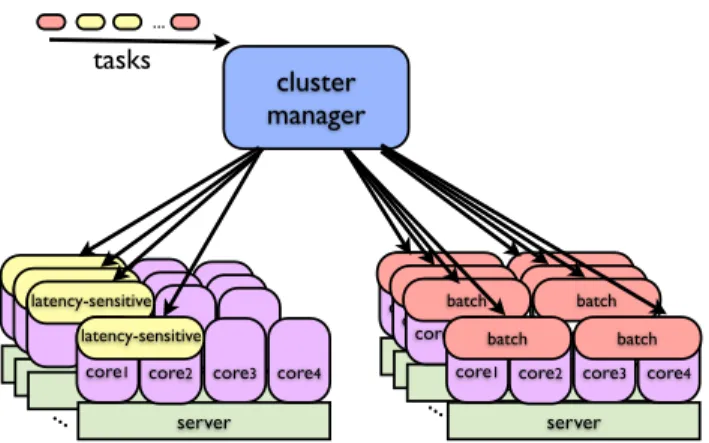
Figure 3: Task placement in a cluster. The cluster manager does not co-locate latency-sensitive appli-cations with others to protect their QoS from perfor-mance interference, causing low machine utilization.
Task placement is conducted by a cluster-level manager
that is responsible for a number of servers. Based on the re-source requirement, the cluster manager uses an algorithm similar to bin-packing to place each task in a cluster of ma-chines [25]. After a task is assigned a machine, a machine level manager (in the form of a deamon running in
user-mode) usesresource containers [1] to allocate and manage
the resources belonging to the task. For the remainder of
this work, we use the termapplicationto represent the
pro-gram binary for a given component of a web-service, and
application task as this binary coupled with its execution
configuration file.
2.2
QoS and Co-location
2.2.1
Application QoS
As multicores become widely adopted in datacenters, the cluster manager consolidates multiple disparate tasks on a single server to improve the machine utilization. However, various application tasks in a datacenter often have different quality-of-service (QoS) priorities. User-facing applications for web search, maps, email and other internet services are
latency-sensitive, and have high QoS priorities.
Applica-tions such as file backup, offline image processing, and video
compression arebatch applications that often have no QoS
constraints. For these, latency is not as important. We de-fine the QoS of a latency-sensitive application in terms of the relevant performance metric specified in its internal ser-vice level requirements (SLAs). For example, the QoS of Google’s web search is measured using query latency and queries-per-second, in contrast to Bing’s [15, 18], which uses the quality of search results provided. More details and ex-amples are presented in Section 4.
2.2.2
QoS Flexibility
As discussed above, there is a trade-off between the QoS performance of latency-sensitive applications and the ma-chine utilization in datacenters. When equipped with a pre-cise prediction, we can allow a small amount of QoS degrada-tion from co-locadegrada-tion to improve the machine utilizadegrada-tion. As long as a co-location pair is predicted to cause only a small amount of QoS degradation within a specified threshold, the cluster manager can allow the co-location. We specify the
tolerable amount of QoS degradation in aQoS policy. For
example, a 95% QoS policy indicates that we are willing to sacrifice 5% of the QoS performance to improve machine utilization. To enforce these QoS policies, the precise pre-diction for QoS degradation due to co-location is needed.
2.2.3
Co-location
A simplified illustration of the task placement process is shown in Figure 3. The amount of required core and mem-ory resources specified in the configuration of each task are carefully tuned by the developers of that task to achieve the QoS requirements. Latency-sensitive tasks that disallow co-location inadvertently occupies more resources on a server leading to unnecessary overprovisioning and lower machine utilization.
3.
THE BUBBLE-UP METHODOLOGY
The key insight of Bubble-Up is that predicting the per-formance interference of co-running applications can be de-coupled into two steps, 1) measuring how much an applica-tion suffers from different levels of pressure on the shared memory subsystem; and 2) measuring the pressure on the memory subsystem an application generates.
3.1
Two Step Methodology
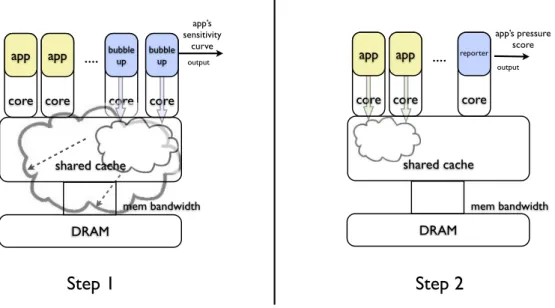
Figure 4 illustrates the Bubble-Up methodology. The two steps to Bubble-Up are,
1. In Step 1, we characterize thesensitivityof each
appli-cation task to pressure in the memory subsystem. In this step, we use a carefully designed stress test we call
thebubble to iteratively increase the amount of
pres-sure applied to the memory subsystem (e.g. bubble up in the subsystem). As we incrementally increase this
pressure “dial”, we produce what we call asensitivity
curve for the application with QoS on the y-axis and
pressure on the x-axis. This sensitivity curve shows how each application’s QoS degrades as pressure in-creases.
2. In Step 2, we characterize thecontentiousness of each
application task in terms of its pressure on the memory subsystem. We call this measure of contentiousness a bubble score. To identify the bubble score of an
appli-cation, we use areporter which observes how its own
performance is affected by the application to generate a score for the application.
With the sensitivity curves and bubble scores of each ap-plication we are able to precisely predict the performance degradation from arbitrary co-locations. It is important to note that step one needs only to be applied to applications whose QoS needs to be enforced. Step two only needs to be applied to the applications that may threaten an applica-tion’s QoS.
3.2
Modeling Bubble-Up and Error
In this section, we present the formal modeling of our Bubble-Up methodology and the source of errors. We first provide a general model the performance degradation an
ap-plicationAsuffers when co-running with other applications
as, DegAC = N X i (SARi×PCRi) (1)
output core core app DRAM bubble up mem bandwidth core bubble up core app
....
shared cache app’s sensitivity curve output core DRAM mem bandwidth core core....
reporter shared cache app’s pressure scoreStep 1
Step 2
app appFigure 4: Bubble-Up Methodology. In Step 1, we characterize thesensitivity of the host application task to pressure in the memory subsystem using abubble. In Step 2, we characterize thecontentiousness of the host application in terms of the amount of pressure it causes on areporter.
whereAis the application,C is the runner or set of
co-runners,DegAC is theA’s degradation when running with
C,Riis a shared memory resource component such as shared
cache, memory bandwidth or memory controller,PCRiis the
pressureC generates on the shared resourceRi, andSARi
isA’s performance sensitivity to the pressure on the shared
resourceRi. The total degradation is the sum of the stalled
cycles caused by contention for each shared resource. The main component of the Bubble-Up methodology is an expandable bubble, which functions as a “dial” for pressure on the memory system. We denote the bubble dial levels as
a setB :{B0, B1, ..., BM} where M is the number of dial
levels for the bubble. As we dial up, the bubble generates an increasing amount of pressure on each shared resource Ri, denoted asPBjRi. In step 1 of Bubble-Up, we increase
the bubble size and at each bubble dialj, we measure the
degradation of applicationAwhen co-running with the
bub-bleBj. The result is a set of A’s degradations at varying
bubble sizes: nDegAB
0, DegAB1, ..., DegABM o
. This set is
the discretized sensitivity curve of applicationA.
When the bubble reporter provides a pressure score of a
co-running applicationC, it reports this pressure in the form
of a bubble dial level,BK, that generates the closest amount
of pressure asC (for details see Section 3.4). To
approxi-mate applicationA’s degradation when co-running with C
(DegAC), Bubble-Up then usesA’s degradation when
run-ning with bubbleBK (DegABK).
Because the pressure score is using the bubble’s pressure to approximate an application’s pressure, Bubble-Up intro-duces a small amount of error when predicting the
degrada-tion ofA. This error stems from the mismatch of the relative
pressures applied to the various individual shared resources. As we discuss in Section 3.3, this mismatch is minimized by designing the bubble to prioritize those resources that act
as first-order effects in the degradation toA. By
substitut-ingDegAC andDegABK using Equation 1, we can formally
model the prediction error as:
Error= DegAC−DegA^C (2) = DegAC −DegABK (3) = N X i |SARi ×PBKRi−SARi ×PCRi| (4)
3.3
Step One: Characterizing Sensitivity
As described in Section 2.1, each task is configured to use a prescribed number of cores for the cluster level bin packing algorithm used to assign tasks to machines in the datacenter. This number is usually less than the number of cores avail-able on a socket. The bubble is run on the remaining cores.
It is important to understand that there is nocorrectdesign
for the bubble. Each design needs only to approximate vary-ing levels of pressure, and there may be many good designs. In this paper, we present one such design, and show that our single bubble design is effective across myriad applica-tion workloads and architectures. Keep in mind that there are a number of assumptions made about the architectures for which this type of bubble design is applicable. Most im-portantly we assume the microarchitecture uses shared last level caches, memory controller, and bandwidth to memory.
3.3.1
The Art of Bubble Design
Although there may be many ways to design a bubble, to arrive at a good design that is not prone to error and imprecision, there is a set of key requirements and guidelines that apply generally to bubble design.
1. Monotonic Curves - As the bubble’s pressure in-creases (turning the pressure “dial” up) the amount of performance interference should also increase mono-tonically. Assuming the host application task is sensi-tive to cross-core interference, higher amounts of pres-sure should result in worse performance.
/ / S u p e r c h e a p r a n d u s i n g a l i n e a r f e e d b a c k s h i f t r e g i s t e r unsigned l f s r ;
#d e f i n e MASK 0 x d 0 0 0 0 0 0 1 u
#d e f i n e r a n d ( l f s r = ( l f s r >> 1 ) ˆ (unsigned i n t) \
( 0 − ( l f s r & 1 u ) & MASK) )
unsigned i n t f o o t p r i n t s i z e =0; / / S i z e o f f o o t p r i n t unsigned i n t dump [ 1 0 0 ] ; / / Dumps ( m a n u a l s s a )
#d e f i n e r ( r a n d%f o o t p r i n t s i z e )
Figure 5: Bubble’s LFSR number generator.
w h i l e( 1 ) { dump[0]+= d a t a c h u n k [ r ]++; dump[1]+= d a t a c h u n k [ r ]++; dump[2]+= d a t a c h u n k [ r ]++; . . . dump[98]+= d a t a c h u n k [ r ]++; dump[99]+= d a t a c h u n k [ r ]++; }
Figure 6: Manual SSA for no dependencies.
2. Wide Dial Range - The pressure dial should have a range that captures the contentiousness of all the ap-plication tasks of interest. It should start from essen-tial no pressure, and incrementally increase pressure to a point close to the maximum possible pressure, or at least worse than the most contentious application task in the set.
3. Broad Impact - The bubble should be designed to apply pressure to the memory subsystem as a whole, not stressing a single component in the memory sub-system. However, keep in mind that, as mentioned in Section 3.2, error is introduced in the difference in component pressure relative to the host task’s sensi-tivity. This error is generally minimized if first-order effects are prioritized.
3.3.2
Designing the Bubble
The design principle of our bubble is to use working set size as our measure of pressure. For a given working set size, we perform memory operations in software to excercise that working set as aggressively as possible.
Our bubble is a multithreaded kernel that generates mem-ory traffic using both loads and stores with a mixture of random and streaming accesses. The number of threads spawned is based on the configuration file of the task being characterized. The pressure “dial” we use is the working set size on which our kernel works. For example, a pressure size of 1 means our bubble will continuously smash a 1MB chunk of memory. As we increase the pressure, we increase our kernel’s working set size. This increases the amount of data being pumped through the memory subsystem, as com-putation is not the bottleneck. Figures 5 – 7 show the key design points for our bubble.
As shown in Figure 5, we use a linear shift feedback
reg-ister (LFSR) based psuedo random number generator as
opposed the rand function provided by the C standard
li-brary. Minimizing the amount of computation in between memory accesses is critical to maximize the activity applied to a particular footprint. Using the standard library incurs a significant amount of computation between random num-bers. However, an LFSR implementation requires only a few cycles to arrive at the next random number on modern processors. In our LFSR implementation, we use a mask of
w h i l e( 1 ) { double ∗mid=b w d a t a +( b w s t r e a m s i z e / 2 ) ; f o r(i n t i =0; i<b w s t r e a m s i z e / 2 ; i ++) { b w d a t a [ i ]= s c a l a r∗mid [ i ] ; } f o r(i n t i =0; i<b w s t r e a m s i z e / 2 ; i ++) { mid [ i ]= s c a l a r∗b w d a t a [ i ] ; } }
Figure 7: Streaming access for bandwidth.
0xd0000001u, which produces aperiod of 232
random num-bers.
Figure 6 shows the random memory accesses used in our bubble. Here we have manually constructed a basic block of
100 memory operations that are insingle static assignment
form such that there are no dependencies in between oper-ations. This basic block has a high level of instruction level parallelism to maximize the number of operations applied to the footprint of the kernel.
As Figure 7 shows, we also use a streaming access pattern in our bubble. This implementation is based on the scalar portion of the STREAM bandwidth stressing benchmark. Using this access pattern further stresses the bandwidth to memory, and also triggers the prefetcher, another shared resource at the level of the shared last level cache.
3.4
Step Two: Bubble Scoring
The second step of Bubble-Up is to produce a pressure score for an application task that describes what size of bub-ble is representative of that task. To detect this score we use
a bubble scorereporter. The reporter is a carefully designed
single threaded workload that is sensitive to contention. Like the bubble, the reporter is only designed once and then can be used with myriad applications and architectures.
3.4.1
Designing the Reporter
The reporter’s own sensitivity to performance interference is used as a basis for reporting how its own performance has been affected by the pressure generated by a host
applica-tion. The impactfelt by the reporter is then translated in
terms of the predicted bubble score of the host application. The only guideline to designing a good reporter is to have a broad sensitivity, e.g. it should be sensitive to the memory subsystem holistically.
[Designing the Reporter]Like the bubble, there is also
nocorrectdesign for the reporter. However, unlike the
bub-ble, there is more flexibility in designing the reporter. This flexibility comes from the fact that the reporter is trained, and the sensitivity curve serves as a rubric for score report-ing, no matter the shape. To implement the reporter, we use a mixture of random accesses and streaming accesses similar to those used for the bubble itself, without the high ILP. The working set of the reporter is about 20MB, thus it uses the last level cache, memory bandwidth and prefetcher. Before the reporter can be used, it must first be trained using the bubble on the architecture for which it will be re-porting. This training involves running the reporter against the bubble on the architecture of interest, and collecting the sensitivity curve of the reporter. This needs to be done only once. The reporter can then use its own sensitivity curve to translate a performance degradation it suffers to the cor-responding bubble score. The curve is essentially used in
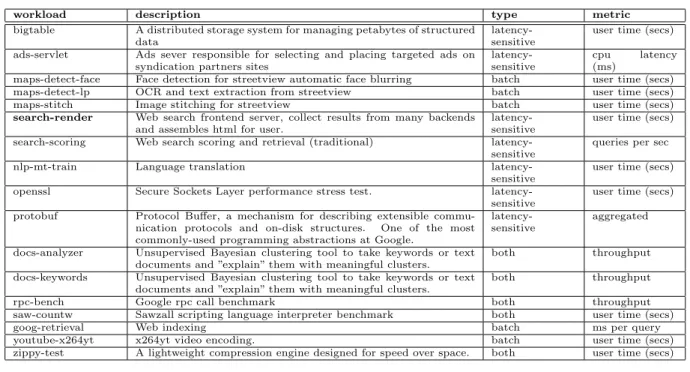
workload description type metric
bigtable A distributed storage system for managing petabytes of structured data
latency-sensitive
user time (secs) ads-servlet Ads sever responsible for selecting and placing targeted ads on
syndication partners sites
latency-sensitive
cpu latency (ms)
maps-detect-face Face detection for streetview automatic face blurring batch user time (secs) maps-detect-lp OCR and text extraction from streetview batch user time (secs) maps-stitch Image stitching for streetview batch user time (secs)
search-render Web search frontend server, collect results from many backends and assembles html for user.
latency-sensitive
user time (secs) search-scoring Web search scoring and retrieval (traditional)
latency-sensitive
queries per sec
nlp-mt-train Language translation
latency-sensitive
user time (secs) openssl Secure Sockets Layer performance stress test.
latency-sensitive
user time (secs) protobuf Protocol Buffer, a mechanism for describing extensible
commu-nication protocols and on-disk structures. One of the most commonly-used programming abstractions at Google.
latency-sensitive
aggregated
docs-analyzer Unsupervised Bayesian clustering tool to take keywords or text documents and ”explain” them with meaningful clusters.
both throughput docs-keywords Unsupervised Bayesian clustering tool to take keywords or text
documents and ”explain” them with meaningful clusters.
both throughput
rpc-bench Google rpc call benchmark both throughput
saw-countw Sawzall scripting language interpreter benchmark both user time (secs)
goog-retrieval Web indexing batch ms per query
youtube-x264yt x264yt video encoding. batch user time (secs) zippy-test A lightweight compression engine designed for speed over space. both user time (secs)
Table 1: Production Datacenter Applications
reverse. Instead of using scores to predict QoS, we use the QoS of the reporter to ascertain the score of the co-located application.
4.
LARGE-SCALE WSC WORKLOADS
In this section, we present the large-scale datacenter ap-plication workloads used in this work, and characterize their susceptibility to performance interference due to contention for the shared memory sybsystem resources. We also intro-duceSmashBench, our in house benchmark suite for the characterization of performance interference.
4.1
Large-Scale Data Intensive Workloads
While a large portion of the world’s computation is housed in the cloud, little is known about the application work-loads that live in this computing domain. The characteris-tics of the tasks that compose a large scale web-service vary significantly. In addition to data retrieval tasks, there are compute-intensive tasks for the analysis, organization, scor-ing, and preparation of information for applications such as search, maps, ad serving, etc.
Table 1 presents a number of key application tasks housed in Google’s production datacenters. These application tasks comprise a majority of the CPU cycles in arguably the largest datacenter infrastructure in the world. In addition to each application task’s name, Table 1 shows the description, pri-ority class, and key optimization metric for each workload. Each application task corresponds to an actual binary that is run in the datacenter. Application tasks that are
user-facing, both directly and indirectly, are classified as
latency-sensitive as the response time is paramount. Throughput
oriented tasks that are not user-facing are classified asbatch.
Notice that some tasks may be used in both roles, and are
denoted asBoth in the table. The column marked metric
shows the key metric for each application. In the context of this work, each task’s QoS is defined to be its performance along this metric.
openssl protobuf docs−analyzer docs−keywords rpc−bench saw−countw goog−retrieval youtube−x264yt zippy−test Performance
Performance Impact on search−render When Co−located
Xeon Opteron −50% −40% −30% −20% −10% 0% 10% bigtable ads−servlet maps−detect−face maps−detect−lp maps−stitch
search−render search−scoring nlp−mt_train
Figure 8: The performance degradation suffered by
search-renderwhen co-located with each of the other datacenter applications on Xeon and Opteron
We have highlightedsearch-renderin Table 1. This task
is responsible for assembling the final view of the search process for the user, which includes assembling scored search results (including web, image, and video), relevent ads from the ads-servlet, etc. This task is highly latency-sensitive and presents a compelling case that we use throughout this work to illustrate the necessity and value of Bubble-Up.
Figure 8 shows the performance degradation of
search-render when co-located with the other application tasks shown in Table 1. This figure shows this performance inter-ference on a production six-core Nehalem-based Xeon and a production six-core K10-based Opteron respectively. Each task in the co-location is configured to use three out of the six cores on the same socket of each platform. Note that docs-analyzer, docs-keywordsandgoog-retrieval do not have a data point for the Opteron. These particular
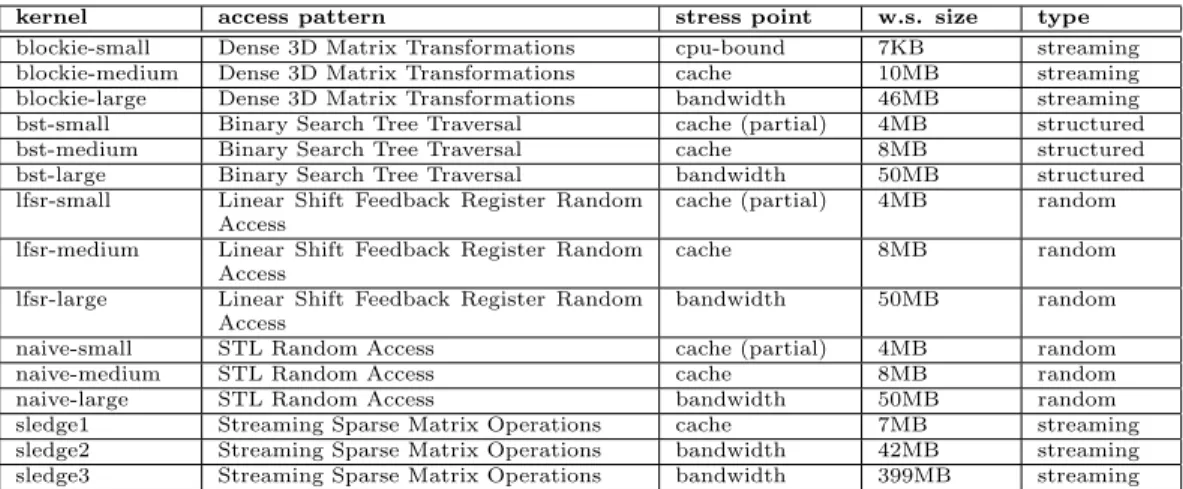
kernel access pattern stress point w.s. size type
blockie-small Dense 3D Matrix Transformations cpu-bound 7KB streaming blockie-medium Dense 3D Matrix Transformations cache 10MB streaming blockie-large Dense 3D Matrix Transformations bandwidth 46MB streaming bst-small Binary Search Tree Traversal cache (partial) 4MB structured bst-medium Binary Search Tree Traversal cache 8MB structured bst-large Binary Search Tree Traversal bandwidth 50MB structured lfsr-small Linear Shift Feedback Register Random
Access
cache (partial) 4MB random lfsr-medium Linear Shift Feedback Register Random
Access
cache 8MB random
lfsr-large Linear Shift Feedback Register Random Access
bandwidth 50MB random naive-small STL Random Access cache (partial) 4MB random
naive-medium STL Random Access cache 8MB random
naive-large STL Random Access bandwidth 50MB random sledge1 Streaming Sparse Matrix Operations cache 7MB streaming sledge2 Streaming Sparse Matrix Operations bandwidth 42MB streaming sledge3 Streaming Sparse Matrix Operations bandwidth 399MB streaming
Table 2: SmashBench Suite (stress point assumes a last level cache size of 6MB to 12MB)
workloads must be run on the Xeon platform as they have been specially configured for this platform. As shown in the figure, we observe a significant amount of cross-core interfer-ence. This has led to a policy to disallow the co-location of search-renderand other tasks on the same machine. How-ever, some co-locations result in minimal to no interference. With the ability to precisely predict the performance inter-ference suffered, those co-locations can be identified as safe, and the utilization of idle cores can be reclaimed.
4.2
SmashBench: Performance Interference
Benchmark Suite
It is also important to note that various applications gen-erate contention with various access patterns and working set sizes, which results in differing amounts of pressure across shared resources such as on-chip caches and buses to main memory. To characterize the sensitivity of our large-scale datacenter workloads to a spectrum of contention types, and to properly evaluate the effectiveness of Bubble-Up for predicting the performance interference that results from these various types of contention, we have created an in-house benchmark suite of contentious kernels, which we call
SmashBench.
Table 2 shows the various kernels in our SmashBench suite. This suite of contentious workloads were designed specifically to exercise the resources that lie between the cores of a multicore processor and main memory in a spec-trum of access patterns and working set sizes. As shown in the figure, SmashBench spans five access patterns. Each pattern continuously performs memory operation on a chunk
of memory, which is of the size denoted w.s. size. The
stress point of each application is either the shared on-chip caches or the bandwidth to memory, which is primarily a function of its working set size. Note that this instance of the suite assumes a last level cache size of approximately 6MB to 12MB. Current production datacenter deployments house processors with these specifications. It is important to note that while this version of the suite was designed for the platforms used in current production datacenters, it can be easily extended for future processor designs by modifying the working set size.
5.
EVALUATION
In this section, we evaluate both 1) the accuracy of Bubble-Up in precisely predicting performance degradations due to interference, and 2) the effectiveness of leveraging Bubble-Up to improve utilization in a production datacenter envi-ronment.
The primary platform used in our evaluation is a six-core Nehalem-based Xeon. The performance metric used to de-scribe the QoS of each Google application is the internal metric as presented in Table 1. Each application task is con-figured to use three cores on the six-core machines and two cores on the quad-core machines. As previously described, during the characterization phase, the bubble runs on the remaining cores.
5.1
Sensitivity Curves of WSC Workloads
We first present the sensitivity curves for Google bench-marks generated by our Bubble-Up methodology. The goal is to 1) examine our Bubble-Up design through analyzing the resulted sensitivity curves and 2) to further improve our understanding of how pressure in the shared resources af-fects the QoS of Google’s applications. To generate sen-sitivity curves, we adjust the pressure Bubble-Up generates and measure an application’s QoS under each given pressure. Figures 9 to 17 present the sensitivity curve of each Google application. For each figure, the x-axis shows the pressure on the shared memory system generated using Bubble-Up’s bubble. The y-axis shows the QoS performance of each ap-plication, normalized by its performance when it is running alone on the platform.
5.1.1
Bubble Design
Figures 9 to 17 illustrate that our bubble design does in-deed have the three properties described in Section 3.3. We
observe Monotonic Curves. In general, each application’s
QoS is decreasing as the pressure increases. This confirms our hypothesis that we can create an aggregate pressure “dial” in software that negatively and monotonically impacts
an application’s QoS. We also observe Wide Dial Range.
The sensitivity curves generally flatten after the Bubble-Up pressure goes beyond 20MB. At this point, the pressure on the shared cache and memory bandwidth saturates and fur-ther increase of the pressure would not have much more
0.6 0.65 0.7 0.75 0.8 0.85 0.9 0.95 1 0 5 10 15 20 25 30 Performance (norm.) Pressure (mb) Sensitivity Curve Intel Figure 9: bigtable 0.6 0.65 0.7 0.75 0.8 0.85 0.9 0.95 1 0 5 10 15 20 25 30 Performance (norm.) Pressure (mb) Sensitivity Curve Intel Figure 10: ads-servlet 0.6 0.65 0.7 0.75 0.8 0.85 0.9 0.95 1 0 5 10 15 20 25 30 Performance (norm.) Pressure (mb) Sensitivity Curve Intel Figure 11: maps-detect-face 0.6 0.65 0.7 0.75 0.8 0.85 0.9 0.95 1 0 5 10 15 20 25 30 Performance (norm.) Pressure (mb) Sensitivity Curve Intel Figure 12: search-render 0.6 0.65 0.7 0.75 0.8 0.85 0.9 0.95 1 0 5 10 15 20 25 30 Performance (norm.) Pressure (mb) Sensitivity Curve Intel Figure 13: search-scoring 0.6 0.65 0.7 0.75 0.8 0.85 0.9 0.95 1 0 5 10 15 20 25 30 Performance (norm.) Pressure (mb) Sensitivity Curve Intel Figure 14: protobuf 0.6 0.65 0.7 0.75 0.8 0.85 0.9 0.95 1 0 5 10 15 20 25 30 Performance (norm.) Pressure (mb) Sensitivity Curve Intel Figure 15: docs-analyzer 0.6 0.65 0.7 0.75 0.8 0.85 0.9 0.95 1 0 5 10 15 20 25 30 Performance (norm.) Pressure (mb) Sensitivity Curve Intel Figure 16: saw-countw 0.6 0.65 0.7 0.75 0.8 0.85 0.9 0.95 1 0 5 10 15 20 25 30 Performance (norm.) Pressure (mb) Sensitivity Curve Intel Figure 17: youtube-x264yt
Impact. The monotonic trend beyond 12MB shows that we
are not only saturating the cache, but also the bandwidth to memory. The pressure generated by the bubble stresses the caches, bandwidth and prefetchers (due to streaming behavior described in Section 3.3).
5.1.2
Workload Characteristics
Some curves (e.g., search-render) are decreasing more
sharply than others (e.g.,protobuf). Also, at a given
pres-sure point, each application suffers a different amount of QoS
degradation. For example, at pressure point 10,
search-render’s normalized QoS is only 0.7, whileprotobuf’s QoS is still around 0.95. When the curve flattens, each applica-tion’s plateau QoS is also different, ranging from 0.6 to 0.85. This shows that Google applications’ QoS have different lev-els of sensitivity to the pressure in the shared resources. Also, each application’s sensitivity to various resources may be different. Since the experimental platform has a 12MB last level cache, the pressure before 12MB is only applied on the shared cache, and after 12MB, the pressure is applied on both shared cache and memory bandwidth. Comparing the gradients of an application’s curve before and after 12 MB can help gain insights on its sensitivity to various
re-sources. For example,protobuf’s curve is fairly flat before
12 MB but has a steep dip after 12MB. This indicates that protobuf’s QoS may be more sensitive to the pressure on the memory bandwidth than the shared cache.
5.2
Bubble Up Prediction Accuracy
In this section, we evaluate Bubble-Up’s accuracy when predicting the QoS degradation of the applications due to performance interference.
5.2.1
Co-locating Google with SmashBench
We first evaluate the effectiveness of Bubble-Up in predict-ing the impact of our SmashBench workloads on Google’s applications. In this experiment, we apply step one of our methodology to 9 memory intensive Google applications, and step two to our 15 SmashBench workloads. As pre-viously mentioned, step one needs only to be applied to ap-plications whose QoS needs to be enforce. Step two only needs to be applied to the applications that may threaten an application’s QoS. Figure 18 to 26 present the results for each of the 9 Google applications. For each figure, the x-axis shows each of the 15 SmashBench benchmarks. The y-axis shows the Google application’s QoS degradation. For each benchmark on the x-axis, the first bar shows the Google ap-plication’s predicted degradation when co-located with the benchmark; the second bar is its measured degradation. The closer the two bars are, the more accurate the Bubble-Up prediction is. Each figure’s caption also documents the aver-age prediction error for each Google application, calculated using the absolute difference between the prediction and the measured value. In general, Bubble-Up’s prediction error is quite small. For the nine Google applications, the
pre-en−l ern−m n−s n−l n−m sl−s sl−m sl−l QoS Degradation Bubble−Up Accuracy predicted actual 0% 10% 20% 30% 40% 50% bl−s bl−m bl−l bt−s bt−l bt−m ern−s
Figure 18: bigtable, avg. error -2.2% en−l ern−m n−s n−l n−m sl−s sl−m sl−l QoS Degradation Bubble−Up Accuracy predicted actual 0% 10% 20% 30% 40% 50% bl−s bl−m bl−l bt−s bt−l bt−m ern−s
Figure 19: ads-servlet, avg. error - 0.8% en−l ern−m n−s n−l n−m sl−s sl−m sl−l QoS Degradation Bubble−Up Accuracy predicted actual 0% 10% 20% 30% 40% 50% bl−s bl−m bl−l bt−s bt−l bt−m ern−s
Figure 20: maps-detect-face, avg. error - 0.7%
ern−s en−l ern−m n−s n−l n−m sl−s sl−m sl−l
QoS Degradation Bubble−Up Accuracy predicted actual 0% 10% 20% 30% 40% 50% bl−s bl−m bl−l bt−s bt−l bt−m
Figure 21: search-renderer, avg. error - 1.8% en−l ern−m n−s n−l n−m sl−s sl−m sl−l QoS Degradation Bubble−Up Accuracy predicted actual 0% 10% 20% 30% 40% 50% bl−s bl−m bl−l bt−s bt−l bt−m ern−s
Figure 22: search-scoring, avg. er-ror - 0.8% en−l ern−m n−s n−l n−m sl−s sl−m sl−l QoS Degradation Bubble−Up Accuracy predicted actual 0% 10% 20% 30% 40% 50% bl−s bl−m bl−l bt−s bt−l bt−m ern−s
Figure 23: protobuf, avg. error -2.2% en−l ern−m n−s n−l n−m sl−s sl−m sl−l QoS Degradation Bubble−Up Accuracy predicted actual 0% 10% 20% 30% 40% 50% bl−s bl−m bl−l bt−s bt−l bt−m ern−s
Figure 24: docs-analyzer, avg. er-ror - 1.7% en−l ern−m n−s n−l n−m sl−s sl−m sl−l QoS Degradation Bubble−Up Accuracy predicted actual 0% 10% 20% 30% 40% 50% bl−s bl−m bl−l bt−s bt−l bt−m ern−s
Figure 25: saw-count2, avg. error -1.2% en−l ern−m n−s n−l n−m sl−s sl−m sl−l QoS Degradation Bubble−Up Accuracy predicted actual 0% 10% 20% 30% 40% 50% bl−s bl−m bl−l bt−s bt−l bt−m ern−s
Figure 26: youtube-x264yt, avg. er-ror - 1.5%
diction error is 2.2% or less. SmashBench exhibits a wide range of memory access patterns, stress points and working set sizes. The fact that a single Bubble-Up design can pre-dict accurately the QoS degradation caused by SmashBench demonstrates the generality of the Bubble-Up methodology.
5.2.2
Pairwise Google Co-location
Figure 27 summarizes the prediction accuracy of Bubble-Up for pairwise co-locations with nine of the most sensitive Google applications with the complete set of Google applica-tions (shown in the x-axis). Each bar shows the error (delta) between the performance degradation predicted by Bubble-Up and the actual measured performance degradation in the co-location. Errors in the negative direction imply that the actual QoS degradation is worse (more) than predicted; er-rors in the positive direction implies that the actual QoS degradation is better (less) than predicted. Only errors in the negative direction can result in a violation of a QoS pol-icy. As the figure shows, Bubble-Up’s prediction error is fairly small across all Google pairwise co-locations.
5.3
Applying Bubble-Up in the Datacenter
In this section, we present an evaluation of applying Bubble-Up’s QoS prediction to increase co-location and machine uti-lization in datacenters. To predict the performance
degra-dation on an applicationAwhen co-located withB, we use
B’s bubble score to index into A’s sensitivity curve. To
improve machine utilization, we allow latency-sensitive ap-plications to have a small amount of QoS degradation. The tolerable degradation threshold is specified in a QoS pol-icy (Section 2). Using Bubble-Up, we can predict the QoS degradation and allow co-location of latency-sensitive ap-plications with other apap-plications when the predicted QoS degradation is within the specified threshold. To evaluate the effectiveness of Bubble-Up, we constructed a scenario where we evaluate 1) the machine utilization improvement when using Bubble-Up; and 2) the success of Bubble-Up’s prediction in satisfying a QoS policy without violating the specified QoS threshold.
For the production scenario presented in this section, we conducted our evaluation using a cluster that is composed of 500 machines, described in Section 5. In this experiment,
we focused onsearch-renderas our main latency-sensitive
application whose QoS degradation must be limited within a small amount. In this cluster, there are 500 instances of search-render, each placed on a single machine. There are 500 other Google applications, evenly distributed across 15 application types shown in Table 1. Every application uses three cores. Our evaluation baseline is the currently deployed cluster management that disallows co-location of search-renderwith any other applications. In this experi-ment, we investigated the potential co-location and utiliza-tion gained using Bubble-Up predicutiliza-tions under varying QoS policies.
−30% −20% −10% 0% 10% 20% 30% bigtable ads−servlet maps−detect−face maps−detect−lp maps−stitch
search−render search−scoring nlp−mt_train
openssl protobuf docs−analyzer docs−keywords rpc−bench saw−countw goog−retrieval youtube−x264yt zippy−test mean Error bigtable ads−servlet maps−detect−face search−render search−scoring protobuf docs−analyzer saw−countw youtube−x264yt
Figure 27: Bubble-Up’s predication accuracy for pairwise co-locations of Google applications.
0% 10% 20% 30% 40% 50% 60% 70% 80% 90% 100% baseline 99% 98% 95% 90% 85% 80% max Cluster Utilization QoS Policy Datacenter Utilization Improvement
Figure 28: Improvement in cluster utilization when allowing Bubble-Up co-locations withsearch-render
under each QoS policy.
95% 90% 85% 80% Co−locations QoS Policy Increase in Co−locations QoS Violated 2%−3% QoS Violated 1%−2% QoS Violated <1% QoS Enforced 0 100 200 300 400 500 99% 98%
Figure 29: Number of Bubble-Up co-locations under each QoS policy.
Figure 28 presents the cluster’s utilization achieved by Bubble-Up prediction under various QoS policies. The base-line is the utilization of the cluster when co-location is
dis-allowed and each instance of search-render is occupying
three out of the six cores on a single machine, and thus at 50% cluster utilization. The max utilization is achieved by allowing all co-locations; placing each of all 500 other Google
applications to co-run with asearch-renderon every
ma-chine, regardless ofsearch-render’s QoS degradation. The
max utilization is not 100% because we define a machine’s utilization as the aggregate performance of all applications running on the machine, normalized by their solo
perfor-mance. For example, applicationA and B are co-locating
and occupying all six cores on a machine, but due to cross-core interference, their performance is only 90% of that when running alone occupying three cores on a machine. Then the
0% 20% 40% 60% 80% 100% 99% 98% 95% 90% 85% 80% 99% 98% 95% 90% 85% 80% 99% 98% 95% 90% 85% 80% 99% 98% 95% 90% 85% 80% Co−locations
0% Tolerance 1% Tolerance 2% Tolerance 3% Tolerance
QoS Violated 2%−3% QoS Violated 1%−2% QoS Violated <1% QoS Enforced
Figure 30: Reduction in QoS violations when apply-ing a tolerance to each QoS policy. Having a toler-ance of just a few percent results in no violations.
machine utilization when co-located is only 90% instead of 100%.
As Figure 28 demonstrates, Bubble-Up prediction greatly improves machine utilization. Even under 99% of QoS pol-icy (when the tolerable QoS degradation is only 1%), the utilization is improved from 50% to close to 70%. Allow-ing a more relaxed QoS policy improves the utilization even more. Under 80% QoS policy, the utilization improvement is close to 80%, showing great potential benefit of adopting Bubble-Up in datacenters.
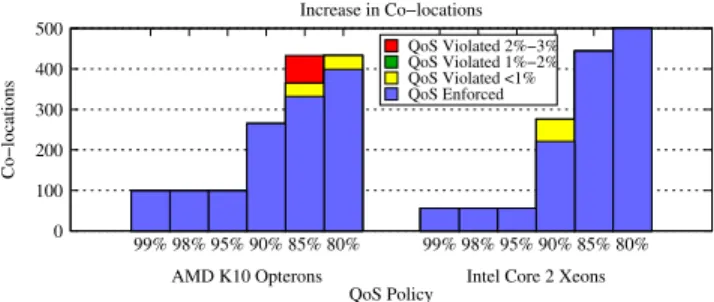
Figure 29 presents the total number of co-locations al-lowed by the cluster manager according to Bubble-Up pre-diction under each QoS policy. Similar to utilization, the number of co-location increases as the allowed QoS degra-dation increases. The baseline co-location is 0. With 99% QoS policy, the co-location is close to 200. With 80% QoS policy, the allowed co-locations increase to 400. However, because of Bubble-Up’s prediction error, there may be co-locations that violate the QoS threshold specified in the pol-icy. Both the number of co-locations that satisfy the QoS policy and the number of violations are presented in stack bars. The violations are broken down into three categories: violations that cause less than 1% extra degradation beyond the QoS policy, 1-2% extra degradation and 2-3% degrada-tion. For example, as shown in the figure, under 99% QoS policy, around 10% of the co-locations violate the policy. However, all of these violations only cause less than 1% ex-tra QoS degradation beyond the policy, meaning their QoS is within a 98% QoS policy. Figure 30 shows the effect of
80% 100%
99% 98% 95% 90% 85% 80%
Violating Co−locations
QoS Policy Percent of Violating Co−locations
0% 20% 40% 60%
Figure 31: QoS violations when allowing all 500 co-locations withsearch-renderunder each QoS policy. (Random Assignment)
max
Cluster Utilization
QoS Policy Datacenter Utilization Improvement AMD K10 Intel Core 2 10% 20% 30% 40% 50% 60% 70% 80% 90% 100% baseline 99% 98% 95% 90% 85% 80%
Figure 32: Improved utilization in a clusters com-posed of AMD K10 Opteron servers and Intel Core 2 Xeon servers.
updating the QoS policy to include an errortolerance. As
shown in the figure, increasing error tolerance at each QoS policy reduces the number of violations. Note that most of the violations cause only less than 2% of extra QoS degrada-tion beyond the QoS policy. Figure 31 shows the percentage of violating co-locations when allowing all co-locations for each QoS policy.
5.4
Impact of Varying Architecture
To evaluate the generality of our Bubble-Up across mi-croarchitectures, we conducted similar experiments on two additional platforms (a six-core K10-based Opteron and a four-core Core2-based Xeon) with the same bubble and re-porter used on the Nehalem processor. The experimental setup is similar as Section 5.3. Figure 32 demonstrates the utilization improvement for the cluster when using Bubble-Up prediction for a cluster composed of Opteron and a clus-ter composed of Core2-based Xeons. As Figure 33 shows, Bubble-Up can effectively increase the number of co-locations with a small amount of error on both platforms. The plat-forms presented here both have a smaller shared cache sizes and lower bandwidth than the Nehalem processor. This leads to a higher degree of contention on these processors. As a result, we observe fewer co-locations at higher QoS policy thresholds. At the 90% threshold the number of co-locations allowed increases dramatically.
6.
RELATED WORK
While there has been a lot of work on mitigating the per-formance interference due to resource contention on multi-core, not much work is directly applicable to the datacen-ter co-location problem. Perhaps the closest related work is the Quarta work by Govindan et al. [9]; however this work requires access to physical memory addresses which can only be attained via custom changes to the OS, and
QoS Enforced 0 100 200 300 400 500 99% 98% 95% 90% 85% 80% 99% 98% 95% 90% 85% 80% Co−locations QoS Policy Increase in Co−locations
AMD K10 Opterons Intel Core 2 Xeons
QoS Violated 2%−3% QoS Violated 1%−2% QoS Violated <1%
Figure 33: Co-locations allowed in Opteron and Xeon clusters.
as the authors themselves mention, such an approach is not feasible at user-level. One direction that has attracted much research attention is the management of shared cache and bandwidth through techniques such as resource parti-tioning [4, 20, 27–34, 38], throttling [7] and adaptive cache replacement policies [14]. Previous work has also investi-gated providing QoS management for different applications on multicore [10, 11, 13, 26]. While demonstrating promising results, the previous work on QoS management and resource partitioning typically requires changes to the hardware de-sign, which is not applicable to deployed servers. Software resource partitioning has also been proposed [6,19,35]. How-ever, most software partitioning techniques focus on shared cache, while ignoring memory bandwidth contention, which is another main cause of performance interference. In gen-eral, our work is complementary to the above resource man-agement research. While previous work focuses on providing resource management for performance isolation or perfor-mance optimization for co-running applications, our work focus on predicting which applications can be co-run with a given application without degrading its QoS beyond a cer-tain threshold.
Previous work on scheduling to mitigate contention and to improve cache sharing is closely related to our work [5, 8, 16, 17, 40]. For an application, different co-runners may cause different amounts of performance interference on a CMP. The intuition of many contention-aware scheduling is to classify applications based on how aggressively they are for shared memory resources and intelligently matches highly aggressive applications with not aggressive applica-tions to minimize the performance degradation [16, 17, 41]. However, most previous work focuses on maximizing the overall throughput or maintaining performance fairness. The approaches cannot address challenges when applications have different priorities and a subset of the applications have strict requirements in terms of the tolerable QoS degra-dation. The challenge for scheduling to provide such QoS guarantee is that the scheduler needs to accurately predict the potential performance degradation for co-running appli-cations. Current classifiers in contention-aware schedulers only indirectly classify or rank applications in terms of their levels of aggressiveness [17, 37, 41] or predict their potential cache misses [3, 16, 21], but cannot provide direct accurate prediction in terms of performance degradation.
7.
CONCLUSIONS
In this work, we have presented a novel methodology for the precise prediction of the performance degradation that results from contention for shared resources. This mecha-nism is of particular importance in the emerging domain of
warehouse scale computing. By decoupling the characteriza-tion of an applicacharacteriza-tion’s sensitivity to contentious pressure to the memory subsystem, and the pressure it generates in the subsystem, we are able to predict pairwise co-locations with only a 1% prediction error on average. Using Bubble-Up in our experimental cluster setup, we are able to increase the utilization in the datacenter by 50% to 90% while enforcing a range of QoS policies.
8.
ACKNOWLEDGEMENTS
We would like to thank Dick Sites, Silvius Rus, and Rick Hank for their invaluable feedback. We would also like to thank Neil Vachharajani for his healthy skepticism and keep-ing us on our toes. Finally, we would like to thank the re-viewers for there feedback and suggestions. Jason Mars is supported by a Google Ph.D. fellowship. This work was par-tially supported by Google and NSF grant 0811689 to the University of Virginia.
9.
REFERENCES
[1] G. Banga, P. Druschel, and J. C. Mogul. Resource containers: a new facility for resource management in server systems. In
OSDI ’99, Berkeley, CA, USA, 1999. USENIX Association. [2] L. A. Barroso and U. H¨olzle. The case for energy-proportional
computing.IEEE Computer, 40:33–37, December 2007. [3] D. Chandra, F. Guo, S. Kim, and Y. Solihin. Predicting
inter-thread cache contention on a chip multi-processor architecture. InHPCA ’05, pages 340–351, Washington, DC, USA, 2005. IEEE Computer Society.
[4] J. Chang and G. Sohi. Cooperative cache partitioning for chip multiprocessors.Supercomputing, page 252, 2007.
[5] S. Chen, P. Gibbons, M. Kozuch, V. Liaskovitis, A. Ailamaki, G. Blelloch, B. Falsafi, L. Fix, N. Hardavellas, T. Mowry, and C. Wilkerson. Scheduling threads for constructive cache sharing on cmps.SPAA ’07, Jun 2007.
[6] S. Cho and L. Jin. Managing distributed, shared l2 caches through os-level page allocation.MICRO 39, Dec 2006. [7] E. Ebrahimi, C. Lee, O. Mutlu, and Y. Patt. Fairness via
source throttling: a configurable and high-performance fairness substrate for multi-core memory systems.ASPLOS ’10, 2010. [8] A. Fedorova, M. Seltzer, and M. Smith. Improving performance
isolation on chip multiprocessors via an operating system scheduler.PACT ’07, Sep 2007.
[9] S. Govindan, J. Liu, A. Kansal, and A. Sivasubramaniam. Cuanta: Quantifying effects of shared on-chip resource interference for consolidated virtual machines. InSOCC ’11, Oct 2011.
[10] F. Guo, Y. Solihin, L. Zhao, and R. Iyer. A framework for providing quality of service in chip multi-processors.MICRO 40, Dec 2007.
[11] A. Herdrich, R. Illikkal, R. Iyer, D. Newell, V. Chadha, and J. Moses. Rate-based qos techniques for cache/memory in cmp platforms.ICS ’09, Jun 2009.
[12] U. Hoelzle and L. A. Barroso.The Datacenter as a Computer: An Introduction to the Design of Warehouse-Scale Machines. Morgan and Claypool Publishers, 1st edition, 2009.
[13] R. Iyer, L. Zhao, F. Guo, R. Illikkal, S. Makineni, D. Newell, Y. Solihin, L. Hsu, and S. Reinhardt. Qos policies and architecture for cache/memory in cmp platforms.
SIGMETRICS ’07, Jun 2007.
[14] A. Jaleel, W. Hasenplaugh, M. Qureshi, J. Sebot, S. Steely, Jr, and J. Emer. Adaptive insertion policies for managing shared caches.PACT ’08, Oct 2008.
[15] V. Janapa Reddi, B. C. Lee, T. Chilimbi, and K. Vaid. Web search using mobile cores: quantifying and mitigating the price of efficiency. InISCA ’10, New York, NY, USA, 2010. ACM. [16] Y. Jiang, K. Tian, and X. Shen. Combining locality analysis
with online proactive job co-scheduling in chip multiprocessors.
HiPeac ’10, pages 201–215, 2010.
[17] R. Knauerhase, P. Brett, B. Hohlt, T. Li, and S. Hahn. Using os observations to improve performance in multicore systems.
IEEE Micro, 28:54–66, May 2008.
[18] C. Kozyrakis, A. Kansal, S. Sankar, and K. Vaid. Server engineering insights for large-scale online services.IEEE Micro, 30, July 2010.
[19] J. Lin, Q. Lu, X. Ding, Z. Zhang, X. Zhang, and P. Sadayappan. Gaining insights into multicore cache partitioning: Bridging the gap between simulation and real systems.HPCA ’08, pages 367–378, 2008.
[20] F. Liu, X. Jiang, and Y. Solihin. Understanding how off-chip memory bandwidth partitioning in chip multiprocessors affects system performance.HPCA ’10, pages 1–12, 2010.
[21] J. Machina and A. Sodan. Predicting cache needs and cache sensitivity for applications in cloud computing on cmp servers with configurable caches.IPDPS 2009, pages 1 – 8, 2009. [22] J. Mars, L. Tang, and R. Hundt. Heterogeneity in
“homogeneous” warehouse-scale computers: A performance opportunity.IEEE Computer Architecture Letters, 2011. [23] J. Mars, L. Tang, and M. L. Soffa. Directly characterizing
cross-core interference through contention synthesis. In
HiPEAC ’11, pages 167–176, New York, NY, USA, 2011. ACM. [24] J. Mars, N. Vachharajani, R. Hundt, and M. L. Soffa.
Contention aware execution: online contention detection and response. InCGO ’10, New York, NY, USA, 2010. ACM. [25] A. Mishra, J. Hellerstein, W. Cirne, and C. Das. Towards
characterizing cloud backend workloads: insights from google compute clusters.ACM SIGMETRICS Performance Evaluation Review, 37(4):34–41, 2010.
[26] M. Moreto, F. Cazorla, A. Ramirez, R. Sakellariou, and M. Valero. Flexdcp: a qos framework for cmp architectures.
SIGOPS Operating Systems Review, 43(2), Apr 2009. [27] K. Nesbit, N. Aggarwal, J. Laudon, and J. Smith. Fair queuing
memory systems.MICRO-39, pages 208 – 222, 2006. [28] K. Nesbit, M. Moreto, F. Cazorla, A. Ramirez, M. Valero, and
J. Smith. Multicore resource management.Micro, IEEE, 28(3):6 – 16, 2008.
[29] M. Qureshi and Y. Patt. Utility-based cache partitioning: A low-overhead, high-performance, runtime mechanism to partition shared caches.MICRO 39, Dec 2006.
[30] N. Rafique, W.-T. Lim, and M. Thottethodi. Architectural support for operating system-driven cmp cache management.
PACT ’06, Sep 2006.
[31] N. Rafique, W.-T. Lim, and M. Thottethodi. Effective management of dram bandwidth in multicore processors.PACT 2007, pages 245 – 258, 2007.
[32] S. Srikantaiah, R. Das, A. Mishra, C. Das, and M. Kandemir. A case for integrated processor-cache partitioning in chip multiprocessors.SC ’09, Nov 2009.
[33] S. Srikantaiah, M. Kandemir, and M. Irwin. Adaptive set pinning: managing shared caches in chip multiprocessors.
ASPLOS XIII, Mar 2008.
[34] G. E. Suh, S. Devadas, and L. Rudolph. A new memory monitoring scheme for memory-aware scheduling and partitioning. InHPCA ’02. IEEE Computer Society, 2002. [35] D. Tam, R. Azimi, L. Soares, and M. Stumm. Rapidmrc:
approximating l2 miss rate curves on commodity systems for online optimizations.ASPLOS ’09, Feb 2009.
[36] L. Tang, J. Mars, N. Vachharajani, R. Hundt, and M. L. Soffa. The impact of memory subsystem resource sharing on datacenter applications. InISCA ’11, pages 283–294, New York, NY, USA, 2011. ACM.
[37] Y. Xie and G. Loh. Dynamic classification of program memory behaviors in cmps.Proc. of CMP-MSI, held in conjunction with ISCA-35, 2008.
[38] Y. Xie and G. Loh. Pipp: promotion/insertion
pseudo-partitioning of multi-core shared caches.ISCA ’09, Jun 2009.
[39] C. Xu, X. Chen, R. Dick, and Z. Mao. Cache contention and application performance prediction for multi-core systems. In
ISPASS 2010, march 2010.
[40] D. Xu, C. Wu, and P.-C. Yew. On mitigating memory bandwidth contention through bandwidth-aware scheduling.
PACT ’10, Sep 2010.
[41] S. Zhuravlev, S. Blagodurov, and A. Fedorova. Addressing shared resource contention in multicore processors via scheduling.ASPLOS ’10, Mar 2010.