The Processing-Speed Theory of Adult Age Differences in Cognition
T i m o t h y A . S a l t h o u s eGeorgia Institute o f Technology
A theory is proposed to account for some of the age-related differences reported in measures of Type A or fluid cognition. The central hypothesis in the theory is that increased age in adulthood is associated with a decrease in the speed with which many processing operations can be executed and that this reduction in speed leads to impairments in cognitive functioning because of what are termed the limited time mechanism and the simultaneity mechanism. That is, cognitive perfor- mance is degraded when processing is slow because relevant operations cannot be successfully exe- cuted (limited time) and because the products of early processing may no longer be available when later processing is complete (simultaneity). Several types of evidence, such as the discovery of con- siderable shared age-related variance across various measures of speed and large attenuation of the age-related influences on cognitive measures after statistical control of measures of speed, are con- sistent with this theory.
The purpose of the current article is to describe, and discuss the evidence relevant to, the processing-speed theory o f cogni- tive aging phenomena. The fundamental assumption in the the- ory is that a major factor contributing to age-related differences in memory and other aspects of cognitive functioning is a re- duction with increased age in the speed with which many cog- nitive operations can be executed (Salthouse, 1985b). In this article, discussion o f evidence relevant to the theory is restricted to the adult portion of the life span, but the basic mechanism may be relevant across the entire life span because similar ideas have been proposed by Kail (e.g., 1986, 1991; Kail & Park, 1992 ) regarding the development of cognitive functioning dur- ing childhood.
Because the success o f a theory cannot be evaluated if the goal one hopes to achieve is never clearly specified, I begin by briefly describing the phenomenon that the present theory is intended to explain. Some o f the best-documented findings in the literature on aging and cognition are the age-related differ- ences in Type A (Hebb, 1942) or fluid (Cattell, 1943; Horn, 1982; Horn & Cattell, 1963) cognition, which include a wide variety o f measures o f memory, reasoning, and spatial abilities. The relations between age and cognition have been well docu- mented since the earliest mental testing of adults (e.g., Foster & Taylor, 1920; Jones & Conrad, 1933), and they are readily apparent in the results from the standardization data in psycho- metric and neuropsychological test batteries (e.g., see Salt- house, 1991c, chap. 2, for a review). Because the samples for the standardization data in these test batteries are typically large and representative, and because the performance measures are
Preparation of this article was supported by National Institute on Aging Grant R37 AG06826. I would like to thank John Dunlosky, Julie Earles, Dan Fisk, Leah Light, Ulman Lindenberger, and David Madden for helpful comments on earlier versions of this article.
Correspondence concerning this article should be addressed to Tim- othy A. Salthouse, School of Psychology, Georgia Institute of Technol- ogy, Atlanta, Georgia 30332-0170. Electronic mail may be sent via In- ternet to [email protected].
403
o f established reliability and span a broad range of cognitive abilities, the general phenomenon o f negative relations between age and Type A or fluid cognition can be considered quite robust.
Performance on tests o f cognitive ability is also a meaningful target or criterion phenomenon because cognitive batteries have proven useful for prediction and assessment outside o f the lab- oratory and in nonacademic settings (e.g., Ghiselli, 1973; Hunter & Hunter, 1984). A focus on cognitive test performance therefore provides a relatively parsimonious linkage to real- world activities. The prediction is not perfect, but significant relations to real-world functioning have been empirically estab- lished; thus, if the age-related influences on these measures can be explained, at least some of the age-related effects in extra- laboratory activities might also be explainable (Salthouse,
1992c).
Although the range of cognitive measures is extensive, it is important to emphasize that the present goal is not to explain all determinants o f cognitive functioning but, rather, to account for the differences in cognitive functioning that are systemati- cally related to adult age. The phenomenon to be explained is thus the age-related variation in behavior, and not the behavior itself (Salthouse, 1991 c, 1992d). Ultimately, of course, more comprehensive theories should encompass all dimensions of cognitive phenomena, but an explanation o f the relations be- tween adult age and Type A or fluid aspects o f cognition is by itself an extremely formidable goal at the present time.
The article is organized in two major sections. The first sec- tion summarizes the primary assumptions o f the processing- speed theory. Evidence relevant to critical hypotheses o f the the- ory is then described in the second section.
T h e o r e t i c a l A s s u m p t i o n s
One substantive assumption o f the current perspective is that performance in many cognitive tasks is limited by relatively general processing constraints, in addition to restrictions o f knowledge (declarative, procedural, and strategic), and varia-
404 SALTHOUSE
tions in the efficiency or effectiveness of specific processes. Some relevant limitations may be partially overcome by experience, and indeed one view of expertise is that it serves to circumvent processing constraints or limitations (Salthouse, 1991a). Nev- ertheless, it is assumed that general limitations frequently im- pose constraints on many types of processing and, hence, that they have consequences for the performance of a large variety of cognitive tasks.
It is sometimes asserted that general mechanisms are not plausible as explanations of adult age differences in cognitive functioning because of evidence presumed to implicate selec- tive or differential age-related effects, such as Age X Treatment statistical interactions. However, the assumption o f one or more fairly general age-related factors does not preclude the occur- rence of significant interactions because interactions can origi- nate as a result of (a) the existence of specific or local age-re- lated influences in addition to the hypothesized broad or gen- eral influences (Salthouse, 1992d), (b) differential reliance of processes or measures on the general or common factor(s) (e.g., Salthouse & Coon, 1994), (c) a multiplicative or proportional influence of the general factor(s) such that the absolute differ- ences between age groups increase with the magnitude of the treatment effect (e.g., Cerella, 1990; Cerella, P o o n , & Williams, 1980; Salthouse, 1985a), or (d) a statistical artifact attributable to differential discriminating power (e.g., reliability, power, and region in the measurement range) of the variables (e.g., Salt- house, 1985b, 1991c). Particularly when one does not assert that general factors are the exclusive source of age-related differences in cognition, therefore, the existence of what appear to be selective or differential age-related effects in the form of statistical interactions is not at all inconsistent with the exis- tence of common or general factors.
A second substantive assumption of the processing-speed the- ory is that speed of processing is a critical processing constraint associated with increased age. From the current perspective, the speed with which an individual performs a cognitive activity is not simply a function of the processes required in that activity but also a reflection of his or her ability to rapidly carry out many different types of processing operations. A slower speed of executing many cognitive operations is not assumed to be the exclusive source of age-related differences, because other age- related influences are also postulated to exist. Nevertheless, a reduction with increased age in the speed with which many cog- nitive operations can be executed is hypothesized to be a major contributor to the adult age differences in many measures of cognition ( Salthouse, 1980, 1985b, 1991 b, 1992b, 1994d). ~ Be- cause this is a fundamental aspect of the theory, much of the remainder of the article is devoted to the elaboration and justi- fication of this assumption.
Two distinct mechanisms are postulated to be responsible for the relation between speed and cognition. The limited time mechanism is assumed to operate because relevant cognitive operations are executed too slowly to be successfully completed in the available time, and the simultaneity mechanism is hy- pothesized to operate because slow processing reduces the amount of simultaneously available information needed for higher level processing. A metaphor for the limited time mech- anism is an assembly line because if relevant processing opera- tions are not successfully completed within a particular tempo-
ral window, then the quality of the final product is likely to be impaired because later processing operations would be either less effective or only partially completed. Some type of juggling activity might be a metaphor for the simultaneity mechanism because the fundamental principle is that many complex activ- ities require synchronization of the constituent tasks, and syn- chronization is easier when the relevant processing operations can be executed rapidly.
Limited Time Mechanism
The basis for the limited time mechanism is simply that the time to perform later operations is greatly restricted when a large proportion of the available time is occupied by the execu- tion of early operations. This mechanism is primarily relevant when there are external time limits or other restrictions on the time available for processing, such as the presence of concurrent demands on processing.
Some cognitive tasks (or tests) have a relatively low level of difficulty, such that the primary determinant of individual differences in performance is likely to be the speed of perform- ing relevant operations. For these types of tasks no special ex- planation appears to be needed to account for the relation be- tween speed and measures of very simple cognition because per- formance on the cognitive measure could merely be another manifestation o f slow processing.
The limited time mechanism may also operate in more com- plicated cognitive tasks in which the quality or accuracy of per- formance is affected by the number of operations (e.g., associa- tions, elaborations, and rehearsals) that can be carried out in the available time (Salthouse, 1980, 1982; Salthouse & Kail, 1983). If complex operations are dependent on the products of simpler operations, and fewer of those products are available because of a slower execution speed, the effects of slow process- ing can be expected to be most pronounced on the speed and accuracy o f complex operations. A mechanism of this type may therefore account for what is sometimes referred to as the com- plexity effect, or the positive relation between task complexity and the magnitude of age differences in both speed and accuracy measures of task performance (Salthouse, 1982, 1985b, 1991 c; Salthouse & Kail, 1983).
Because a gradual reduction in the speed of basic processes with increased age is likely to be accompanied by numerous adaptations, the consequences o f slower processing are not al- ways easy to predict (Salthouse, 1985b). This point can be il- lustrated by considering what may be an analogous situation in reverse, in the form of the evolutions of computer programs that have occurred as successive generations of computers have become progressively faster and more powerful. The enormous increases in performance have not simply been attributable to increases in the speed of executing the same programs, because major modifications in the nature of the programs have also
Note that not all cognitive operations are assumed to be necessarily affected by slower processing and that a role for nonspeed influences is explicitly acknowledged. The theory described here is thus not accu- rately characterized by claims such as the following: "Slowing of infor- mation processing.., is a single master factor underlying involutional changes in all cognitive skills" (Nettelbeck & Rabbitt, 1992, p. 191 ).
occurred to capitalize on the faster speed ( and larger memories) of newer computers. Similar types of adaptations in the form of alterations in strategy, reliance on prestored solutions instead of novel problem solving, and so forth could also occur in the hu- m a n processing system as it becomes progressively slower and less efficient with increased age. Despite the complications as- sociated with identifying all of the consequences of a slower rate of processing, however, the basic principle underlying the lim- ited time mechanism is quite simple; namely, more processing frequently results in higher levels of performance, and the op- portunity to accomplish a larger a m o u n t of processing is greater when the speed of processing is faster.
Simultaneity Mechanism
The second hypothesized mechanism for the relation be- tween processing speed and quality of cognitive performance is based on the idea that the products of early processing may be lost by the time that later processing is completed. To the extent that this is the case, relevant information may no longer be avail- able when it is needed. Processing deficits could therefore emerge because of discrepancies between the time course of loss of information and the speed with which critical operations such as encoding, elaboration, search, rehearsal, retrieval, inte- gration, or abstraction can be executed (Salthouse, 1982,
1985b, 1988a, 1992b).
A key assumption of the simultaneity mechanism is that in- formation decreases in availability (i.e., quantity or quality) over time as a function of either decay or displacement. More- over, under rapidly changing conditions, the information could also become obsolete in that it may no longer be accurate or pertinent by the time it becomes available. In either case, when the rate of executing operations is slow, relevant information is less likely to be useful because it is more impoverished or de- graded by the time that preceding operations are finally com- pleted. Moreover, this will occur regardless of the amount of time allowed for processing because the critical limitations are based on internal dynamics rather than on the relation between internal (i.e., processing speed) and external (e.g., stimulus pre- sentation time) factors.
Performance on tasks assumed to assess working memory ca- pacity might be postulated to reflect functioning of the simulta- neity mechanism because working memory is sometimes con- ceptualized as consisting of information that is currently avail- able for storage or processing, or both. However, it is important to distinguish the a m o u n t of simultaneously available informa- tion, which may be indexed by measures of working memory, from possible causes of age-related reductions in that amount. A critical hypothesis in the processing-speed theory is that an age-related decrease in speed is one of the major causes of the variations in working memory associated with increased age (e.g., Salthouse, 1992a; Salthouse & Babcock, 1991 ). As dis- cussed later, there is considerable evidence in support of this hypothesis because statistical control of measures of processing speed has been found to greatly reduce the amount of age-re- lated variance in measures of working memory (see also Salt- house, 1994b).
From the perspective of the processing-speed theory, it is the slower speed of activating or processing information rather than
the rate of information loss or decay that is primarily responsi- ble for age-related consequences of the simultaneity mechanism (Salthouse, 1992a, 1994b; Salthouse & Babcock, 1991 ). In fact, research with tasks such as continuous recognition or continu- ous paired-associates memory suggests that forgetting functions are very similar across the adult age range (see Salthouse, 1992a, for a review). However, it should be noted that simulta- neous availability of information can also be reduced because of disruptions in the synchronization of neural signals or pat- terns of activation, and not only because of changes in the rates of decay or information loss. For example, alterations in the variability of timing at elementary levels might also lead to de- creases in the quantity or quality of information based on multiple interacting inputs. The simultaneity mechanism should therefore not simply be viewed as attributable to forget- ting because any factor that affects the synchronization of rele- vant inputs also has the potential to alter the amount (and quality) of simultaneously available information.
The importance of simultaneous availability of relevant in- formation is not a novel idea, because it has been mentioned in one form or another for at least 60 years. For example, the con- cept is similar to speculations by Eysenck ( 1987 ), Jensen (e.g., 1982, 1987 ), and Vernon ( 1983, 1987 ). The idea of a trade-off between loss of information and speed of relevant processing is also fundamental to the notion of an articulatory loop in Bad- deley's (e.g., 1986) model of working memory. Analogous ar- guments in discussions related to aging have been made by Bir- ren (e.g., 1965, 1974) and Jones (1956). To illustrate, Jones ( 1956, p. 138) suggested that problem-solving effectiveness is impaired when lower level operations are too slow and earlier steps are lost before the relevant information can be integrated. Perhaps the first discussion of the simultaneity mechanism was in the following passage by Lemmon (1927):
It is possible that the quality of intelligence may depend upon the number of connections, but also upon the speedwith which those connections are formed. Nerve centers (e.g., association centers) cannot remain excited indefinitely at maximum intensity; conse- quently in the case of the person who forms connections slowly it is possible that the excitation of the first association centers to be affected will have diminished and disappeared before the latter cen- ters come into play. Thus only a limited number of centers are co- operating at any one time. The person who forms connections quickly, however, is apt to have more association centers interacting at once, since the later centers are aroused before the earlier ones had a chance to lose their effectiveness. But the most intelligent response is, in general, the one in which the determination of which the greatest number of factors have been taken into consideration. In neural terms this may well mean the response in the determina- tion of which the greatest number of association centers have coop- erated, and the number of simultaneously active centers may in turn depend to some extent upon the speed with which nervous impulses are conducted from center to center and through syn- apses within the centers. (p. 35)
Another early description of the simultaneity mechanism was provided by Travis and Hunter ( 1928 ):
Intelligence is probably best defined as the ability to see relation- ships and meanings by having access to as many alternatives or judgments as possible at approximately the same instant of time. This would necessitate the reaction patterns which subserve the
406 SALTHOUSE judgments to be active within an extremely short interval of time. The "feeble-minded" individual has relatively speaking, such a slow conduction rate that one reaction pattern becomes inactive by the time another becomes active, thus doing away with the very factor, relative simultaneity of activity, which makes possible the seeing of a relationship between ideational elements. (p. 352 ) An important implication of the simultaneity mechanism is that the dynamic capacity of processing "structures" or "sys- tems" such as working memory will be affected, with likely im- pairments of higher order processes such as abstraction, elabo- ration, or integration, because not all of the relevant informa- tion will be available in a usable form when it is needed (Salthouse, 1992b). Furthermore, degradation o f these pro- cesses will lead either to increased errors or to time-consuming repetitions of critical processing operations (cf. Mayr & Kliegl, 1993). Speed effects on cognitive functioning thus may be indi- rect because they alter the effectiveness o f a process (such as abstraction, elaboration, or integration) that directly affects cognitive performance. Because the simultaneity mechanism is so fundamental, it could have an impact on many aspects of cognition, including performance in tasks without external time constraints. From the current perspective, therefore, Peak and Boring (1926) were correct in suggesting that power tests are not necessarily those that do not involve speed but may sim- ply be those that do not take speed into account.
Some evidence o f the sufficiency of the simultaneity mecha- nism can be obtained from computational models incorporat- ing variations in the speed o f propagation of activation or in the speed of firing productions (e.g., Salthouse, 1985b, 1988a; see also MacKay & Burke, 1990, for additional discussion of a very similar mechanism). Prediction of the specific consequences o f a processing-speed limitation requires a detailed understanding of, or a willingness to make many assumptions about, the pro- cesses involved in a particular task. It may also be difficult to distinguish the contribution o f other aspects of the model from the speed parameter being manipulated for the particular con- sequences that are predicted. That is, the consequences could vary according to the type o f processing algorithm or represen- tation system used, even when the method of manipulating the critical variable, in this case processing speed, is identical (cf. Salthouse, 1988a).
Despite these limitations, the absolute differences in various indexes of performance between fast and slow processing sys- tems are often larger when the amount of processing increases (Salthouse, 1988a). Furthermore, if there are external time lim- its on the usefulness (i.e., accuracy or relevance) of the infor- mation or decreases in its availability because o f displacement or decay, then qualitative impairments in certain types of pro- cessing can also be expected. It is also noteworthy that an im- portant characteristic o f a reduction in processing speed exhib- ited by computational models is graceful degradation of perfor- mance (Salthouse, 1985b, 1988a). That is, reductions in the speed of processing seldom result in the total or catastrophic loss of a particular kind o f processing but, instead, tend to lead to a broad or diffuse reduction in the efficiency of many types of processing. At least in a relatively general manner, therefore, analyses of speed manipulations in computational models are consistent with the assumptions of the processing-speed theory. In summary, two mechanisms have been postulated to ac-
count for the speed-cognition relation. The principle underly- ing the limited time mechanism is that necessary operations may not be completed if the processing is slow. The simultaneity mechanism is based on the idea that if the processing is too slow, then not all relevant information will be available when needed, leading to impairments o f critical operations that could result in either a high rate o f errors or time-consuming repetitions of critical operations.
E v i d e n c e
Empirical evidence relevant to the processing speed theory is discussed in the context of three major hypotheses: (a) Age- related slowing is not exclusively determined by specific and independent deficits; (b) processing speed functions as a medi- ator o f some o f the relations between age and measures of cog- nitive functioning; and (c) the limited time and simultaneity mechanisms are primarily responsible for the relations between speed and cognitive functioning. However, before discussing these hypotheses, I briefly summarize the age-related slowing phenomenon, and describe the method by which processing speed has been assessed.
Slowing with age is often considered one of the best-docu- mented and least controversial behavioral phenomena o f aging. One illustration of the slowing phenomenon is the median cor- relation of.45 between age and measures o f speed across a very wide range of behavioral activities reported by Salthouse (1985a). The age-related slowing phenomenon is also evident in analyses of the age trends from perceptual speed tests in psy- chometric test batteries such as the Digit Symbol Substitution Test from the Wechsler Adult Intelligence Scale-Revised (see Salthouse, 1992e) and the Visual Matching and Cross Out Tests from the Woodcock-Johnson Cognitive Ability Tests (see Kail & Salthouse, 1994). Performance in the Finding A's and Identi- cal Pictures tests (Ekstrom, French, Harman, & Dermen, 1976) has also been found to be negatively related to age in both cross-sectional and longitudinal comparison, by Schaie (1989) and Schaie and Willis (1993). Not only have these researchers reported pronounced age trends in each type of comparison, but Schaie (1989) has suggested that, in contrast to the situa- tion with many cognitive variables, the age-related declines are actually greater in longitudinal comparisons than in cross-sec- tional comparisons.
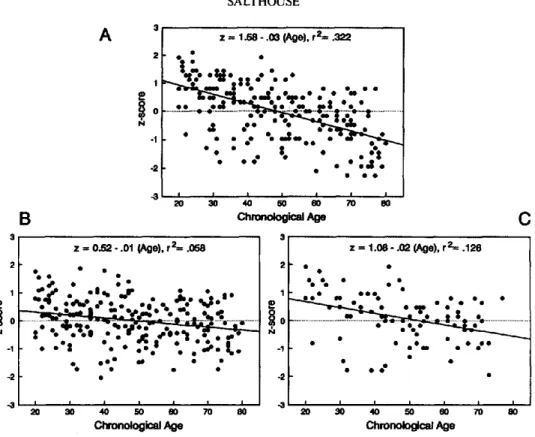
Figure 1 illustrates the age-related slowing phenomenon with data from a sample of 221 adults between 20 and 80 years of age (Salthouse, 1993b, Study l ) on two paper-and-pencil per- ceptual speed tasks (i.e., Letter Comparison and Pattern Com- parison, described subsequently). The vertical axis in this figure is the average o f the two perceptual speed measures expressed in standard deviation units, with higher scores representing faster performance. These results are typical of many in the literature in that a strong systematic relation is usually found in which increased age is associated with a largely monotonic, and ap- proximately linear, decrease in speed of performance.
Because the processing speed construct is fundamental to the theory, it is important to consider how this construct has been assessed in recent studies. Several criteria have been proposed to guide the selection of measures used to assess processing speed (e.g., Salthouse, 1985b, 1991c, 1992b). For example, one
3 I z = 1.59 - .03 (Age), r2= .371
I
ee •""
°
•
I
• Q O / . ' . , , ' . o I ' - ' t ":. • • •I
~ 0 . . . - - - 0 - ... o -2 -3 C h r o n o l o g i c a l A g eFigure/. Relation between age and a composite measure of process-
ing speed (data from Salthouse, 1993b, Study 1 ).
criterion is that the tasks used to assess processing speed should be relatively simple, such that most of the individual differences in performance are attributable to how quickly one can carry out the relevant operations rather than to variations in amount o f knowledge or in other cognitive abilities. When more com- plex measures are used, such as lexical decision speed or read- ing speed (e.g., Hartley, 1986, 1993; Hultsch, Hertzog, & Dixon, 1990; Hultsch, Hertzog, Small, McDonald-Miszczak, & Dixon, 1992), it is difficult to determine how much of the variation in the measures is due to differences in the speed with which elementary cognitive operations can be executed as op- posed to differences in the quality or quantity of semantic knowledge or differences in the level of more general verbal abil- ities. However, the speed measure should not merely represent input and output processes or sensory and motor processes, or else it may not reflect the duration of relevant cognitive opera- tions. Finally, as with the assessment o f any theoretical con- struct, it is generally desirable that the construct be evaluated with several measures to minimize the specific variance associ- ated with single measures and to emphasize the common, con- struct-relevant variance. Reliance on multiple measures also has the advantage of increasing the reliability of the assessment because of aggregation (Rushton, Brainerd, & Pressley, 1983 ).
Much of the research described subsequently has used vari- ous combinations of seven measures to assess processing speed. One measure is the score on the Digit Symbol Substitution Test (Wechsler, 1981 ). This is a paper-and-pencil test consisting of a code table with pairs of digits and symbols and rows of double boxes with a digit in the top box and nothing in the bottom box. The task for the research participant is to refer to the code table to write the symbol in the bottom box that is associated with the digit in the top box. Performance on the test is represented by the number o f correct symbols written in 90 s.
Two perceptual speed measures require comparisons of pairs o f letters (Letter Comparison) or pairs of line patterns (Pattern Comparison). In each case, the paper-and-pencil test form con- sists o f pairs of items with a horizontal line between the mem- bers of the pair. The task for the participant is to write an S (for
same) or a D (for different) on the line between the two mem- bers o f the pair and to complete as many of the items as possible within a specified time (usually 30 s).
Two additional paper-and-pencil tests were designed to in- volve minimal cognitive operations, but with stimulus and r e -
s p o n s e requirements similar to the perceptual speed tests. One
measure (Digit Copying) assesses how quickly individuals can copy digits, and another (Boxes) assesses how quickly they can draw lines in specified locations.
Finally, in several projects processing speed has been assessed with two computer-administered reaction time tasks. These tasks are based on the Digit Symbol Substitution Test in that they consist of a code table at the top of the screen and a probe stimulus in the middle of the screen. In the Digit Symbol ver- sion of the task, the code table contains pairs of digits and sym- bols, and the probe stimulus consists of a single digit-symbol pair. In the Digit Digit version of the task, the code table con- tains pairs of identical digits, and hence is superfluous, and the probe stimulus consists of a single pair of digits. In both tasks, the research participant is to press one key on the keyboard if the probe stimuli match, either with respect to associational equivalence (Digit Symbol) or in terms of physical identity (Digit Digit), and to press a different key if they do not match.
In addition to exhibiting moderate to large relations with age ( see later discussion), all of these measures have been found to have respectable test-retest reliabilities. To illustrate, in a sam- ple of 240 adults between 19 and 82 years of age (Salthouse, 1994a, Study 1 ), the immediate test-retest correlations were .86 for Boxes, .86 for Digit Copying, .58 for Letter Comparison, .73 for Pattern Comparison, .61 for Digit Digit reaction time, and .93 for Digit Symbol reaction time. Values from a sample of 131 adults between 17 and 79 years o f age (Salthouse, Fristoe, Lineweaver, & Coon, 1995, Study 2) were .93 for Boxes, .93 for Digit Copying, .60 for Letter Comparison, .78 for Pattern Comparison, .69 for Digit Digit reaction time, and .89 for Digit Symbol reaction time.
Hypothesis 1: Age-related slowing is a broad phenomenon and is not simply attributable to specific and independent processing deficits.
A key hypothesis of the processing-speed theory is that age- related speed differences o f the type just discussed originate at least partially because o f a small number of fairly general or common factors rather than exclusively from a large number o f specific and local factors. One reason for the assumption o f a substantial shared or common influence is that many measures o f processing speed have been found to be related to increased age, and not merely those restricted to a few tasks or to a few types of cognitive operations. More important, evidence dis- cussed later indicates that the age-related influences on many speed measures are not independent but, instead, have consid- erable shared or common variance.
There are two primary implications of the hypothesis that common age-related influences contribute to measures o f pro- cessing speed. The first is that it should be possible to predict the age differences in particular speed measures from knowledge o f the age differences in other speed measures. The second im- plication is that the age-related effects in different speed mea- sures are not expected to be independent, rather, they are as-
408 SALTHOUSE
sumed to have a considerable amount of shared age-related variance. Analytical procedures based on the examination o f systematic relations and on statistical control techniques can be used to examine these implications.
Analyses of Systematic Relations
In recent years, there has been considerable interest, and con- troversy, regarding the existence and interpretation of system- atic relations between mean levels of performance in different age groups (e.g., Cerella, 1985, 1990, 1991, 1994; Fisk & Fisher, 1994; Fisk, Fisher, & Rogers, 1992; Hale, Lima, & Myerson, 1991; Laver & Burke, 1993; Madden, Pierce, & Allen, 1992, 1993; Mayr & Kliegl, 1993; Myerson, Hale, Wagstaff, P o o n , & Smith, 1990; Myerson, Wagstaff, & Hale, 1994; Perfect, 1994). The method o f examining age-comparative data in which the task or condition means of one group are plotted against those o f another group was originally described by Brinley (1965), who used it to express relations with both accuracy measures and speed measures. Most subsequent researchers using this method have focused on speed measures, and heated debates have arisen concerning the meaning of these relations. One of the major issues of contention is whether the primary contribu- tion of portraying condition means o f two groups as a function of one another is to illuminate global age-related influences or to obscure specific age-related effects.
From the perspective of the processing-speed theory, system- atic relations are interesting primarily because o f their potential to generate estimates of the relative contributions o f general and specific, or common and unique, age-related influences. That is, given certain assumptions, the relations between the mean levels o f performance in two age groups may allow a distinction between common and unique age-related effects (Salthouse,
1992b, 1992d). The rationale has been described as follows: Only if at least some of the age-related effects on each variable were determined by a factor common to other relevant variables does it seem reasonable to expect age differences on one variable to be related to age differences on other variables. "'General" or "com- mon" in this context thus implies lack of independence, in the sense that knowing the magnitude of the age differences on one variable provides information about the magnitude of the age differences on other variables. (Salthouse, 1992d, p. 330) One application of systematic relation analyses to distinguish common and unique age-related influences was described by Madden et al. ( 1992; see also 1993). These investigators used the performance of young adults and the systematic relations from a set of variables to predict the mean values of older adults in a given condition. The method is based on the assumption that the systematic relation reflects the influence of the common or general speed factor for that sample and those variables. If this assumption is valid, then adjusting each score o f the mem- bers of one age group by the parameters of the function relating the mean scores in the two groups can be interpreted as remov- ing the common or general influence. If the adjustment does in fact eliminate the effects of the common or general factor, then the magnitude o f the remaining differences between the original scores in one group and the adjusted scores in the other group provides an estimate o f the contribution of unique or specific
age-related influences on the target variable (Saithouse, 1991 c, 1992b, 1992d).
A similar method was applied in a recent study by Salthouse and Kersten (1993), and it resulted in the elimination o f most of the age-related differences across a variety o f speed measures. Furthermore, very similar results were obtained even when the adjustment was based on different types of speed tasks (i.e., those derived from paper-and-pencil procedures rather than from reaction time tasks). This outcome not only is consistent with the existence o f the hypothesized common speed influence but suggests that, for some measures, nearly all of the age-re- lated influences may be attributable to the common or general factor.
One possible objection to the adjustment of scores by the pa- rameters of the systematic relation is that this method may not be very sensitive to specific age-related effects that are small rel- ative to any general age-related influences that might exist (e.g., Fisk et aL, 1992). Although this concern is valid, exceptions to the general pattern were detected in both the Madden et al. (1992) and the Salthouse and Kersten (1993) studies. For ex- ample, in the Salthouse and Kersten (1993) study, the time taken by older adults to perform the Digit Symbol reaction time task after an opportunity to learn the associations between digit-symbol pairs was greater than that expected from the sys- tematic relation. According to the reasoning underlying the an- alytical method, therefore, it can be inferred that specific or unique age-related influences contributed to the age differences on this measure, in addition to the general or common influ- ences that were postulated to be responsible for the systematic relation.
It is important to note that the relations between the mean performance of young and old adults need not be described by a single function to produce moderate to high levels of predict- ability. That is, although some researchers have relied on the number of distinct quantitative functions relating the perfor- mance o f young and old adults as the basis for distinguishing between general and specific age-related effects or between sin- gle and multiple speed factors (e.g., Kliegl, Mayr, & Krampe, 1994; Lima, Hale, & Myerson, 1991; Mayr & Kliegl, 1993; My- erson et al., 1990), distinctions among alternative functions are only o f secondary interest from the current perspective. The question o f primary importance in the processing-speed theory is the extent to which the age-related effects in some variables are independent of, or not predictable from, the age-related effects in other variables. If there is considerable independence and lack of predictability, then specific influences would be in- ferred to predominate over general or common influences. In contrast, if the variables were found to share a large proportion of their age-related variance, and if the age differences in some variables were highly predictable from the age differences in other variables, then general or common influences would be inferred to be of greater relative importance.
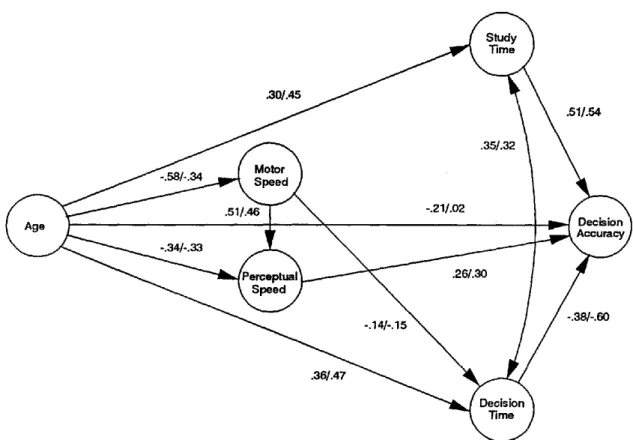
This argument can be illustrated with data from two condi- tions in a speeded verification arithmetic task (Salthouse & Coon, 1994, Study 2). Between zero and seven arithmetic oper- ations were presented in this study in either a sequential condi- tion (e.g., 3 + 2 - 4 = 2; false) or a hierarchical condition in which temporary preservation o f intermediate products was re- quired (e.g., [5 - 3) + 4] - 1 = 4; false).
"6"
E
° ~I--
u) c o o. O9 CC ~D0
2 0 1 8 - 1 6 - 1 4 -1 2 -
1 0 -
8 - 6 - 4 - 2 I0
0
• V s ° s " o O l d ~ - o ~ 4 . ~ " . o r == .99 I I I I I I I I I2
4
6
8
10
12
14
16
18
20
Seq~ntial
Hierarchical
Young Response Time (sec)
Figure 2. Mean time of older adults as a function of mean time of young adults in sequential and hierar- chical arithmetic tasks (data from Salthouse & Coon, 1994, Study 2 ).
The systematic relation functions for the sequential and hier- archical arithmetic data in this study are portrayed in Figure 2. Separate regression lines are illustrated for the conditions in each task because the interaction of condition (sequential or hierarchical) with time of the young adults was statistically sig- nificant (cf. Salthouse, 1985a, 1991 c, 1992d, 1992f).
Because all participants in this study also performed two pa- per-and-pencil perceptual speed tasks (Letter Comparison and Pattern Comparison) and two reaction time tasks (Digit Digit and Digit Symbol), ratios of perceptual speed and reaction time speed measures were computed to serve as additional estimates of the hypothesized general speed factor for these participants. Table 1 summarizes the actual (original) group differences for all speed measures and the differences between actual values and predicted values for older adults after adjustments for the general influence according to each of the equations shown in the notes to the table. The values in the table are d units, which correspond to the mean difference between the groups divided by the pooled standard deviation (Cohen, 1988 ).
Inspection of Table 1 reveals that almost all o f the differences involving an adjustment are smaller than the initial differences (i.e., the mean effect size for the original scores was 1.75 units, and the grand means for all other conditions, displayed in the table notes, were between -0.51 and 0.40). The degree o f pre- diction is certainly not perfect, and examination of the mea- sures with consistently large residual differences may be infor- mative about the nature of the specific age-related influences
operating in these variables. However, the important point for the current argument is that the magnitude o f the age differ- ences in nearly every variable was greatly reduced after adjust- ing for the estimated contribution of a common speed factor. On average, therefore, there appears to be moderate predictabil- ity o f the age differences in certain speed measures from knowl- edge of the pattern of age differences in other speed measures.
Because there were different systematic functions in Figure 2, it is informative to examine the degree to which the age-related variance in the measures from these conditions was indepen- dent. That is, even though there are distinct quantitative re- lations for the sequential and hierarchical measures, it is possi- ble to examine the amount o f age-related variance the measures from the two functions have in common. Estimates o f the shared age-related variance can be derived by determining the proportion of age-related variance in the measures from the condition with the larger age differences (i.e., hierarchical ) that is shared with the measures from the condition with the smaller age differences (i.e., sequential). Moreover, these computations can be carried out both for the mean values across each condi- tion and for pairs of measures with the same number o f arith- metic operations. Results of the computations are summarized in Table 2.
Two points should be noted about the entries in this table. First, estimates of the shared age-related variance are moder- ately high, with an estimate of .871 based on the computations of the mean values and a mean across estimates from different
4 1 0 SALTHOUSE Table l
Effect Sizes Before and After Adjustment for the Influence of a General Speed Factor
Number of arithmetic operations
Condition 0 1 2 3 4 5 6 7 M Sequential Original a 2.15* 2.05* 1.59" 1.56" 1.43" 1.28* 1.09* 1.29" 1.56 Equation I b 0.36 0.28 -0.47 -0.66* -0.95* -0.92* - 1.06" -0.88* -0.54 Equation 2 c 0.64* 0.57* -0.18 -0.36 -0.63* -0.62* -0.78* -0.60* -0.25 Equation 3 o -0.25 0.17 0.04 0.04 -0.05 -0.01 -0.13 0.08 -0.01 Equation 4 e 0.41 0.08 - 1.0 l* - 1.27* - 1.65" - 1.62" - 1.71" - 1.53" - 1.04 Equation 5 r 1.16* 0.75* -0.36 -0.64* - 1.0 l* - 1.03* - I. 18* - 1.02* -0.42 Hierarchical Original a 2.24* 2.30* 2.08* 1.76" 1.92* 1.76* 1.82" 1.67" 1.94 Equation I b 0.39 0.54* 0.30 0.04 0.74* 0.49 0.69* 0.43 0.45 Equation 2 c 0.69* 0.81" 0.56 0.29 0.93* 0.69* 0.86* 0.62* 0.68 Equation 3 d -0.19 0.48 0.79* 0.68* 1.29" 1.11" 1.27" 1.08" 0.81 Equation 4 e 0.40 0.29 -0.19 -0.53 0.24 -0.07 0.18 -0.13 0.02 Equation 5 f 1.17* 0.97* 0.37 0.01 0.67* 0.38 0.57 0.29 0.55
a M d = 1.75. b Ratio of perceptual speed: Old = Young × (1/.62) (M d = 0.05). c Ratio of reaction time speed: Old = Young × 1.51 (M d = 0.22).
d Regression equation for sequential condition: Old = (Young × 1.23) + .55 (M d = 0.40). e Regression equation for hierarchical condition: Old =
(Young × 1.96) - .34 (M d = -0.51). f Regression equation for both conditions: Old = (Young × 1.72) - .37 (Md = 0.07).
* p < .01.
n u m b e r s o f o p e r a u o n s o f .817. Despite the quantitative differ- ence in the functions, therefore, the values r e p r e s e n t i n g the two f u n c t i o n s s h a r e d an average o f m o r e t h a n 80% o f their age-re- lated variance. 2 Second, the p r o p o r t i o n s o f s h a r e d age-related variance t e n d to decrease as the n u m b e r o f a r i t h m e t i c opera- tions increases. This decrease may reflect an i n c r e a s e d involve- m e n t o f novel or distinct age-related processes ( p e r h a p s related to working m e m o r y a n d t h e t e m p o r a r y p r e s e r v a t i o n o f infor- m a t i o n while processing o t h e r i n f o r m a t i o n ) w h e n the p r o b l e m s c o n t a i n four or m o r e operations. Even w h e n it a p p e a r s t h a t o t h e r age-related influences are operating, however, it is i m p o r - t a n t to n o t e t h a t m o r e t h a n 50% o f the age-related variance is s h a r e d with speed m e a s u r e s t h a t are p r e s u m a b l y unaffected by those i n f l u e n c e s ?
T h e d a t a r e p o r t e d in Figure 2 a n d in Tables 1 a n d 2 suggest t h a t the quantitative p a r a m e t e r s o f the systematic f u n c t i o n s are n o t necessarily i n f o r m a t i v e a b o u t the existence, or relative con-
Table 2
Estimates of Proportions of Age-Related Variance in the Hierarchical Arithmetic Task
Age-related variance
Number of Proportion of
operations Alone After sequential variance shared
0 .594 .008 .987 1 .613 .013 .979 2 .547 .069 .874 3 .478 .042 .912 4 .503 .131 .740 5 .459 .084 .817 6 .470 .202 .570 7 .417 .142 .659 M .518 .067 .871
t r i b u t i o n , o f a c o m m o n age-related speed factor. A l t h o u g h those p a r a m e t e r s have descriptive value a n d may be useful for esti- m a t i n g the c o n t r i b u t i o n o f the h y p o t h e s i z e d general f a c t o r ( s ) on a p a r t i c u l a r variable, they d o n o t directly indicate the e x t e n t t o w h i c h the age-related influences in different variables are dis- t i n c t a n d i n d e p e n d e n t o f o n e another.
In s u m m a r y , the considerable literature d o c u m e n t i n g the ex- istence o f systematic relations b e t w e e n m e a n t i m e s o f y o u n g a n d old adults is viewed as consistent with the hypothesis o f a general age-related slowing factor. T h e c u r r e n t perspective differs f r o m t h a t e s p o u s e d by o t h e r theorists, however, in t h a t analyses o f systematic relations are n o t necessarily a s s u m e d to be i n f o r m a t i v e a b o u t t h e n u m b e r o f i n d e p e n d e n t age-related in- fluences; instead, they are p o s t u l a t e d to be p r i m a r i l y useful as 2 Mayr and Kliegl (1993) reported that slightly more than 6% of the variance in measures from tasks involving coordinative complexity was independent of that in measures from tasks involving sequential com- plexity. However, because they did not report the total age-related vari- ance in the coordinative complexity measures, estimates of the propor- tions of shared age-related variance could not be derived from the in- formation in their article. Figure 8 in that article also illustrates results of an adjustment analogous to those reported in Table 2 of this article in which a similar pattern was apparent (i.e., under-prediction of the effects in the complex condition from an adjustment based on results in the simple condition ).
3 A very similar pattern of results was obtained in a contrast of se- quential arithmetic performed alone and performed while also remem- bering four letters (Salthouse et al., 1995). That is, the regression equations for the two sets of variables differed significantly in slope (i.e.,
Old = 0.47 + I. 11 [Young], r 2 = .99, for arithmetic alone, and Old =
0.33 + 1.38 [Young], r 2 = .99, for arithmetic with concurrent letter
memory), the magnitude of the age difference in d units was greatly reduced after adjustment for the influence of the common factor, and a large proportion of the age-related variance in the concurrent arithme- tic measures was shared with the single-task arithmetic measures.
Controlled
Vanable ~
Age
Criterion
Variable
Figure 3. Illustration of regions of variance for age and two variables. The circles represent the total variance in the variables, and the regions of overlap correspond to proportions of shared variance.
a means o f identifying variables with potentially specific age- related influences.
Statistical Control Procedures
Because many speed measures have been found to have neg- ative relations with age, a fundamental question within the pro- cessing-speed theory concerns the number of separate and dis- tinct age-related influences on speed. That is, are there many independent and unique age-related influences, or are there, in- stead or in addition, a relatively small number o f factors with fairly broad consequences? As noted earlier, a central hypothe- sis of the processing-speed theory is that some version of the latter interpretation is the most plausible and, hence, that there should be substantial commonality, or overlap, o f the age-re- lated influences on many different speed measures. In other words, rather than being completely independent, it is hypothe- sized that much of the age-related variance in any given speed measure is shared with the age-related variance in other speed measures.
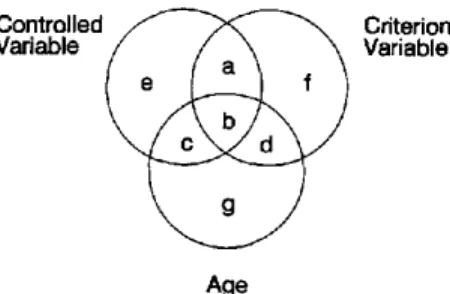
One way o f investigating the degree o f commonality among speed measures is through use o f statistical control methods. The logic of statistical control procedures in the present context can be described by reference to Figure 3 (see also Salthouse, 1992b, 1992d, 1994c, for further discussion o f the rationale). This figure represents the total variance, and the regions of shared or overlapping variance, in three variables. Note that the proportion o f variance in the criterion variable that is shared with the age variable corresponds to the ratio (b + d)/(a +f+ b + d). In a similar manner, the proportion o f variance in the criterion variable that is shared with the controlled variable cor- responds to the ratio (a + b)/(a +f+ b + d). However, it is also apparent in Figure 3 that the proportion of age-related variance in the criterion variable that is shared with the controlled vari- able corresponds to the ratio b/(b + d). It is this latter quantity that is o f greatest interest in the current context because the prediction from the processing-speed theory is that the age-re- lated influences on many speed variables are not independent and, hence, that the variables will share a large proportion o f their age-related variance. In other words, the ratio b/(b + d) is predicted to be relatively large when the two variables both re- flect speed of processing. In contrast, if separate and distinct age-related influences are responsible for the age differences in every speed measure, then most o f the age-related variance in
the variables will be independent, and the ratio b/(b + d) will be small.
Both correlation and hierarchical regression procedures can be used to derive estimates o f the proportions o f variance illus- trated in Figure 3. That is, the square o f the correlation between age and the criterion variable corresponds to the proportion of the criterion variance shared with age (i.e., [b + d]/[a + f + b + d ] ) . Hierarchical regression techniques, in which the vari- ance in the controlled variable is removed before the relation o f age to the criterion variable is examined, can be used to derive the square of the semipartial correlation (i.e., d/[a + f + b + d ] ) . Finally, subtracting the second quantity from the first, and then dividing by the first, yields an estimate of the proportion o f age-related variance in the criterion variable that is shared with the controlled variable (i.e., b/[b + d ] ) .
These analyses can be illustrated with an example reported in Salthouse (1994c). The primary data in that report were from a large ( N = 910) sample o f adults across a wide age range. The two speed measures were the Digit Symbol Substitution Test and a composite perceptual speed measure formed by averaging z scores from the Letter Comparison and Pattern Comparison tasks. The correlation between the Digit Symbol Substitution Test and composite perceptual speed variables was .73, indicat- ing that 54% (i.e., .732) of the total variance in each variable was shared. The R 2 value associated with age in the Digit Sym- bol Substitution Test was .289, but the increment in R 2 associ- ated with age after control o f the perceptual speed measure was only .008. It can therefore be inferred that 97.2%--[.289 - .008)/.289] X 1 0 0 - - o f the age-related variance in the Digit Symbol Substitution Test was shared with the composite per- ceptual speed measure.
Because the proportions o f total age-related variance in the variables need not be identical (i.e., b + d is not necessarily equal to b + c), estimates o f the proportion of shared age-re- lated variance in two variables are not necessarily symmetric. In fact, when the analyses in the data set just described were reversed, the age-associated R 2 value in the perceptual speed measure was .412, but the increment in R 2 associated with age after control o f the Digit Symbol Substitution Test was .086. This leads to an estimate that 79.1%--[.412 - .086)/.412] X 1 0 0 - - o f the age-related variance in the composite perceptual speed measure was shared with the age-related variance in the Digit Symbol Substitution Test.
A very similar pattern of shared age-related variance was found in the data from an independent sample o f 305 adults reported in the Salthouse (1994c) article. That is, in this sample 92.3% of the age-related variance in the Digit Symbol Substitu- tion Test was shared with the perceptual speed measure, and 77.3% of the age-related variance in the perceptual speed mea- sure was shared with the Digit Symbol Substitution Test. In con- trast, because the correlation between the two measures was .68, only 46% o f the total variance in each measure was shared with the other measure. The results from these two data sets there- fore indicate that a very large percentage of the age-related vari- ance in at least these particular speed measures was shared, and hence relatively little was independent or unique to each measure.
Procedures similar to those just described have also been con- ducted on a variety of different speed measures from two sepa-
4 1 2 SALTHOUSE Table 3
Proportions of Shared Age-Related Variance in Speed Measures: Salthouse (1993d; N = 305)
Criterion variable
Controlled variable 1 2 3 4 5 6 7 8 9 10 11 Age r
1. Horizontal Marking - - .975 .873 .763 .468 .467 .942 .745 .449 .462 .590 -.38 2. Vertical Marking .993 - - .879 .780 .535 .511 .981 .855 .492 .512 .617 - . 4 0 3. Digit Copying .926 .894 - - .919 .588 .583 .999 .909 .625 .587 .705 -.41 4. Letter Copying .980 .969 .994 - - .738 .793 .942 .999 .781 .728 .870 - . 4 9 5. Digit Comparison .838 .875 .915 .877 - - .989 .731 .909 .898 .858 .943 -.55 6. Letter Comparison .791 .806 .867 .881 .963 - - .865 .964 .852 .789 .908 -.53 7. Digit Transformation .439 .456 .503 .428 .399 .395 - - .855 .422 .332 .433 -.23 8. Letter Transformation .318 .369 .388 .398 .369 .380 .885 - - .363 .301 .379 - . 2 4 9. Letter Comparison .723 .731 .861 .826 .807 .808 .904 .982 - - .827 .820 -.51 10. Pattern Comparison .912 .925 .976 .941 .930 .913 .808 .964 .973 - - .885 - . 5 9 11. Digit Symbol .892 .881 .939 .919 .870 .877 .846 .982 .828 .720 - - -.51
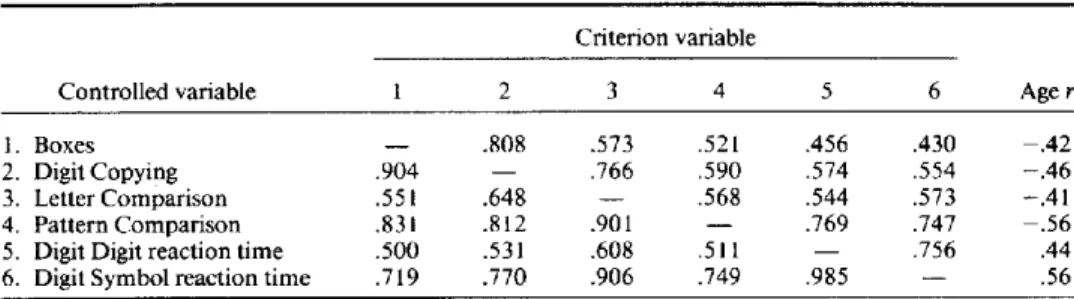
rate d a t a sets; results are s u m m a r i z e d in Tables 3 a n d 4. Table 3 c o n t a i n s results f r o m 11 speed m e a s u r e s o b t a i n e d f r o m the 305 a d u l t s r e p o r t e d in the S a l t h o u s e ( 1 9 9 3 d ) article. All m e a - sures f r o m t h a t study were derived f r o m p a p e r - a n d - p e n c i l tests. Table 4 c o n t a i n s results f r o m 4 p a p e r - a n d - p e n c i l tests a n d 2 re- a c t i o n t i m e tests f r o m a total o f 744 a d u l t s w h o h a d p a r t i c i p a t e d in o n e o f t h r e e r e c e n t studies (i.e., Salthouse, 1994d, Studies 1 a n d 2; Salthouse, 1994a, Study 1 ).
In all cases, the e n t r i e s i n Tables 3 a n d 4 c o r r e s p o n d to pro- p o r t i o n s o f s h a r e d age-related v a r i a n c e c o m p u t e d b y s u b t r a c t - ing the i n c r e m e n t in R 2 associated w i t h age after e l i m i n a t i n g the v a r i a n c e in the c o n t r o l l e d v a r i a b l e f r o m the t o t a l R 2 associ- ated with age a n d t h e n dividing this difference b y the total R 2 associated with age. As in the e x a m p l e s d e s c r i b e d earlier, these values i n d i c a t e how m u c h o f the age-related v a r i a n c e in one v a r i a b l e ( r e p r e s e n t e d in the c o l u m n s ) is shared, or in c o m m o n with, the age-related v a r i a n c e in a n o t h e r v a r i a b l e ( r e p r e s e n t e d in the r o w s ) .
T h e m e d i a n for the values in Table 3 was .842, a n d t h a t for the values in Table 4 was .628. O n l y the values o b t a i n e d after the c o n t r o l for Digit T r a n s f o r m a t i o n a n d L e t t e r T r a n s f o r m a t i o n m e a s u r e s were consistently lower t h a n .5, a n d this m a y reflect the fact t h a t these two variables h a d relatively low c o r r e l a t i o n s w i t h age (i.e., - . 2 3 a n d - . 2 4 , respectively, as c o m p a r e d w i t h a range o f - . 3 8 t o - . 5 9 for all o t h e r v a r i a b l e s ) . T h e a m o u n t o f age-related v a r i a n c e t h a t c a n b e s h a r e d b e t w e e n two variables
is o b v i o u s l y l i m i t e d b y the total age-related v a r i a n c e in e a c h variable.
Because all o f the m e a s u r e s in Tables 3 a n d 4 are single vari- ables, the age-related v a r i a n c e is n o t easily p a r t i t i o n e d i n t o t h a t a t t r i b u t a b l e to the h y p o t h e s i z e d c o n s t r u c t , in this case a c o m - m o n speed factor, a n d t h a t specific to the p a r t i c u l a r m e t h o d s , materials, a n d measures. Nevertheless, t h e results s u m m a r i z e d in the two tables reveal t h a t there is s u b s t a n t i a l overlap o f the age-related v a r i a n c e in the i n d i v i d u a l m e a s u r e s o f p r o c e s s i n g speed, w i t h a n average o f nearly 75% o f the age-related v a r i a n c e in these variables s h a r e d w i t h o t h e r variables. Very s i m i l a r re- suits have also b e e n r e p o r t e d in two r e c e n t studies. Salthouse a n d M e i n z ( 1 9 9 5 ) f o u n d t h a t a n average o f 86.3% o f the age- related v a r i a n c e was s h a r e d across 2 r e a c t i o n time, 2 p a p e r - a n d - pencil, a n d 10 vocal speed measures. A n d S a l t h o u s e ( 1 9 9 6 ) f o u n d t h a t a n average o f a p p r o x i m a t e l y 62% o f the age-related v a r i a n c e in 19 different speed m e a s u r e s i n v o l v i n g vocal, writ- ten, a n d r e a c t i o n t i m e responses was shared.
A s e c o n d m e t h o d t h a t c a n b e used to investigate the degree o f c o m m o n a l i t y o f age-related v a r i a n c e in m e a s u r e s o f speed is b a s e d o n a s t r u c t u r a l e q u a t i o n m o d e l w i t h a single l a t e n t speed c o n s t r u c t related to all speed m e a s u r e s a n d with relations f r o m age t o t h e l a t e n t speed c o n s t r u c t a n d t o e a c h i n d i v i d u a l speed m e a s u r e . W i t h i n a m o d e l o f this type, e s t i m a t e s o f the c o m m o n age-related influence o n each speed m e a s u r e can b e o b t a i n e d f r o m the p r o d u c t o f the p a t h coefficients f r o m age to the corn-
Table 4
Proportions of Shared Age-Related Variance in Speed Measures: Earles and Salthouse (1995; N = 744)
Criterion variable
Controlled variable 1 2 3 4 5 6 Age r
1. Boxes - - .808 .573 .521 .456 .430 - . 4 2
2. Digit Copying .904 - - .766 .590 .574 .554 - . 4 6 3. Letter Comparison .551 .648 - - .568 .544 .573 -.41 4. Pattern Comparison .831 .812 .901 - - .769 .747 - . 5 6 5. Digit Digit reaction time .500 .531 .608 .511 - - .756 .44 6. Digit Symbol reaction time .719 .770 .906 .749 .985 - - .56
mon speed factor and from the common factor to the individual speed measures. The direct path coefficients from age to the individual speed measures serve as estimates of the specific or unique age-related influences on the measures.
Salthouse (1996) recently applied this method to four inde- pendent data sets and, in all cases, found very similar results. For every variable, the estimate of the common or shared age- related influence was much larger than the estimate of the unique or specific age-related influence. Moreover, the unique age-related influence was significantly greater than zero for only
18 of the 53 variables across the four data sets.
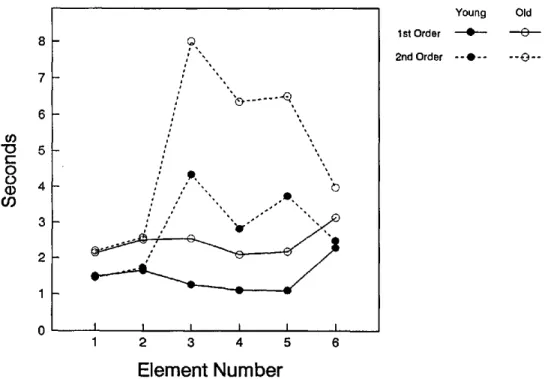
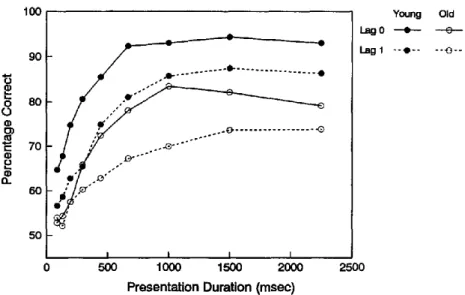
It is important to point out that a general or common age- related influence is also likely to be operating with measures often postulated to reflect the duration of discrete and specific cognitive processes. In fact, results from several analyses suggest that 50% or more of the age-related variance in measures of purportedly specific information-processing components is at- tributable to a common or general speed factor. Analyses lead- ing to this conclusion can be illustrated with data from an arti- cle by Salthouse and Prill (1987) involving a series completion task. In the condition of greatest interest in the present context, each element in the problem was presented successively, and the time taken by the participant in examining each element was monitored by a computer. Two different types of problems were distinguished on the basis of the abstractness of the relations among elements. Problems with first-order relations among el- ements consisted of a simple continuation sequence (e.g., 2-4- 6-8-10-??). In contrast, problems with second-order relations had the invariance or constancy at the second level of abstrac- tion, in the difference among differences (e.g., 2-3-5-8-12-??). A measure of abstraction time can be derived from the differ-
ence in inspection or processing time in the two types of prob- lems, particularly at the third element in the sequence, where the problems are first distinguishable. Mean inspection times for correct trials for young and old adults in the two types o f problems are illustrated in Figure 4.
It is apparent in Figure 4 that older adults were slower than young adults across every item in the sequence for both types of problems. Of particular interest are the much longer times in the third, fourth, and fifth elements in the second-order prob- lems because these durations presumably reflect the time needed to infer or abstract relations among items. Because these durations are longer for older adults than for young adults, some of the lower accuracy o f older adults on the second-order prob- lems (i.e., 35.8% correct, as compared with 68.6% correct for young adults) may be attributable to a greater probability o f forgetting early items in the sequence during the longer period needed to identify the relations among elements.
The first two rows in Table 5 contain the values leading to estimates of the proportion of age-related variance in the task- specific speed measures that was shared with a speed measure from a separate task (i.e., Digit Symbol Substitution Test score). Note that statistical control analyses of the type de- scribed earlier yield estimates that 49.1% of the age-related vari- ance in the abstraction measure, and 62.5% of the age-related variance in the mean inspection time measure, was shared with the Digit Symbol speed measure.
The remaining entries in Table 5 are based on studies with a mixture of task-specific speed measures. Two distinct patterns are evident in these data. One is similar to that described earlier in that the age-related variance in the task-specific measure was greatly reduced after control of the variance in another speed
6 oO " 0 5 C 0 O (1) 4 O~ 3 Q
f
' , , i • / / / t , " ,." " 0 , 0 s • . - i s " Young Old 1st Order ~ 0 2nd Order - - 0 . . . . 0 - - 0 I I I I I I 1 2 3 4 5 6Element Number
Figure 4. Time to inspect successive series completion elements for young and old adults in first-order and second-order abstraction problems (data from Salthouse & Prill, 1987, Study 2).
4 1 4 SALTHOUSE Table 5
Estimates of Shared Age-Related Variance in Different Speed Measures
Study and criterion variable Alone
Age-related variance After control of
Proportion of variance shared with Salthouse & Prill (1987), series
completion (N = 48) Mean inspection time
Difference: 2nd order minus I st order
.518 .228 Digit Symbol .194 •116 Digit Symbol .625 .491 Salthouse (1987), geometric analogies
(N = 48)
Mean inspection-decision time
Slope of time-element: complete problem Slope of time-element: first 2 terms
.505 .280 •368 Digit Symbol .054 .006 .053 Digit Symbol .893 .979 .856 Salthouse & Coon (1993), reordered letter
memory span, Study 1 (N = 55) Mean recall time
Reorder time .376 .187 RTS .034 • 0 0 1 RTS .910 .999 Salthouse & Coon (1993), reordered letter
memory span, Study 2 (N = 71) Mean recall time
Reorder time Encoding time .236 .063 .274 RTS •013 .001 .101 RTS .945 .984 .631 Salthouse & Kersten (1993), symbolic
arithmetic (N = 104) Symbol arithmetic RT Digit arithmetic RT .518 .450 PS .068 .050 RTS .015 .001 DART .047 a PS .869 .889 RTS .971 .998 DART .911 a
Salthouse & Coon (1994), Study l, subtraction RT (N = 240) Borrow RT No borrow RT .051 .087 PS .001 .001 RTS .004 .002 N B R T .001 a PS .980 .989 RTS .922 .977 NBRT .980 a
Salthouse & Coon (1994), Study 2, arithmetic with 1 to 7 operations (N = 80)
Sequential arithmetic intercept Slope
Hierarchical arithmetic intercept Slope .193 .169 .083 .401 PS .034 .036 .099 .188 IRT • 0 0 1 .032 .013 .026 Intercept a .334 a .169 PS •824 .787 b .531 IRT .995 .811 .843 .935 Intercept a b a .579 Salthouse et al. (1995), arithmetic with 1 to 4
operations (N = 131) Single-task arithmetic intercept Slope
Dual-task arithmetic intercept Slope .167 .018 .039 .069 PS .074 .016 .024 • 0 0 1 IRT .091 .003 .000 • 0 0 1 Intercept a .096 a .162 PS .557 .111 .385 .986 RT .455 ,833 ,999 .986 Intercept a b a b
Salthouse (1994d), digit symbol with 3, 6, and 9 digit-symbol pairs, Study 1 (N = 246) Intercept Slope .284 .115 PS .058 .008 DDRT .024 .046 Intercept a .124 PS .796 .930 DDRT .915 .600 Intercept a b
Salthouse (1994d), digit memory search with 1 to 4 items, Study 2 (N = 258) Intercept Slope .164 .002 PS .038 .000 RTS •004 .000 Intercept a .022 PS .768 1 . 0 0 0 RTS .976 1 . 0 0 0 Intercept a
Salthouse (1994d), letter memory search with 1 to 4 items, Study 2 (N = 258) Intercept Slope .145 • 0 0 1 PS .026 .003 RTS .002 .000 Intercept a .003 PS •821 b RTS •986 1 . 0 0 0 Intercept a b
Table 5 (continued)
Study and criterion variable Alone
Age-related variance After control of
Proportion of variance shared with Salthouse & Meinz (1995), Stroop interference
(incongruent - neutral; N = 242) PS RTS PS RTS
Color .217 .033 .028 .848 .871
Number .031 .002 .002 .935 .935
Position .073 .001 .001 .986 .986
Salthouse (1996), Stroop interference (incongruent - neutral; N = 172) Color
PS RTS PS RTS
.361 .067 a .814 a
Note. RTS = reaction time speed; PS = perceptual speed; DART = digit arithmetic reaction time; RT = reaction time; NBRT = no borrow reaction time; IRT = identification reaction time; DDRT = Digit Digit reaction time.
a Variable not available or not relevant in the analysis, b Estimates of shared variance not meaningful as a result of an apparent suppression relationship because the age-related variance increased rather than decreased after control of the other variable.
measure (i.e., symbol arithmetic reaction time, digit arithmetic reaction time, borrow reaction time, no borrow reaction time, sequential arithmetic intercept, Digit Symbol intercept, mem- ory search intercept, and Stroop color interference). The sec- ond pattern is that the age-related variance in the criterion vari- able increased rather than decreased after control of the vari- ance in the other speed variable (i.e., sequential arithmetic slope, hierarchical arithmetic intercept, single-task and dual- task arithmetic slope, Digit Symbol slope, and memory search slope). Instances with the second pattern indicate that statistical control need not always reduce the amount of age-related vari- ance because it can also "release" the age-related variance that had been suppressed because of a negative relation between the two speed measures. For example, the intercept could operate as a third variable that obscures the relations between age and the slope unless its effects are taken into consideration. Even though the age-related variance in these cases increased rather than decreased after statistical control of the other measure, it is important to note that the results are still consistent with the interpretation that the age-related influences on the speed mea- sures were not independent. Statistical control can alter the age relations, in either a negative or a positive dire