For Peer Review Only
Progression of Doppler changes in early-onset small for gestational age fetuses. How frequent are the different
progression sequences?
Journal: The Journal of Maternal-Fetal & Neonatal Medicine
Manuscript ID DJMF-2017-0055.R1 Manuscript Type: Original Paper Date Submitted by the Author: n/a
Complete List of Authors: Morales-Roselló, José; Hospital Universitario y Politécnico La Fe, Servicio de Obstetricia
Khalil, Asma; St George's Hospital, Fetal Medicine Unit
Fornés-Ferrer, Victoria; Instituto de Investigación Sanitaria La Fe, Unidad de Bioestadística
Alberola-Rubio, José; Universidad Politécnica, Grupo Bioelectrónica (I3BH)
Hervás Marín, David; Instituto de Investigación Sanitaria La Fe, Unidad de Bioestadística
Peralta-LLorens, Nuria; Hospital Universitario y Politécnico La Fe, Servicio de Epidemiología
Perales-Marín, Alfredo; Hospital Universitario y Politécnico La Fe, Servicio de Obstetricia
Keywords: Early-onset fetal growth restriction, small-for-gestational-age, umbilical artery, fetal middle cerebral artery, ductus venosus
For Peer Review Only
Progression of Doppler changes in early-onset small
for gestational age fetuses. How frequent are the
different progression sequences?
José Morales-Roselló†, Asma Khalil*, Victoria Fornés-Ferrer††, José Alberola-Rubio**, David Hervas-Marín††, Núria Peralta Llorens***, Alfredo Perales-Marín.
†
Servicio de Obstetricia, Hospital Universitario y Politécnico La Fe, Valencia, Spain.
*
Fetal Medicine Unit, St George’s Hospital, London, UK. **
Grupo Bioelectrónica (I3BH), Universidad Politécnica, Valencia, Spain. ††
Unidad de bioestadística, Instituto de Investigación Sanitaria La Fe, Valencia, Spain.
***Servicio de Epidemiología, Hospital Universitario y Politécnico La Fe, Valencia, Spain.
Corresponding author: Dr. José Morales-Roselló Servicio de Obstetricia
Hospital Universitario y Politécnico La Fe Avenida Fernando Abril Martorell 106 46026 Valencia, Spain E-mail: [email protected] 3 4 5 6 7 8 9 10 11 12 13 14 15 16 17 18 19 20 21 22 23 24 25 26 27 28 29 30 31 32 33 34 35 36 37 38 39 40 41 42 43 44 45 46 47 48 49 50 51 52 53 54 55 56 57
For Peer Review Only
Running Title:
Progression of Doppler in early-onset fetal smallness.
Word count: Word count: 3052, Table count: 3, Figure count: 5. 3 4 5 6 7 8 9 10 11 12 13 14 15 16 17 18 19 20 21 22 23 24 25 26 27 28 29 30 31 32 33 34 35 36 37 38 39 40 41 42 43 44 45 46 47 48 49 50 51 52 53 54 55 56 57 58
For Peer Review Only
ABSTRACT
Objective: To evaluate the progression of Doppler abnormalities in early-onset fetal smallness (SGA).
Methods: 948 Doppler examinations of the umbilical artery (UA), middle cerebral artery (MCA) and ductus venosus (DV), belonging to 405 early-onset SGA fetuses, were studied, evaluating the sequences of Doppler progression, the interval examination-labor at which Doppler became abnormal and the cumulative sum of Doppler anomalies in relation with labor proximity.
Results: The most frequent sequences were that in which only the UA pulsatility index (PI) became abnormal (42.1%) and that in which an abnormal UA PI appeared first, followed by an abnormal MCA PI (24.2%). In general, 71.3% of the fetuses followed the classical progression sequence UAMCADV, mostly in the early stages of growth restriction (84.1%). In addition, the UA PI was the first parameter to be affected (9 weeks before delivery), followed by the MCA PI and the DV PIV (1 and 0 weeks). Finally, the UA PI began to sum anomalies 5 weeks before delivery, while the MCA and DV did it at 3 and 1 weeks before the pregnancy ended.
Conclusion: In early-onset SGA fetuses, Doppler progression tends to follow a predictable order, with sequential changes in the umbilical, cerebral and ductus venosus impedances.
3 4 5 6 7 8 9 10 11 12 13 14 15 16 17 18 19 20 21 22 23 24 25 26 27 28 29 30 31 32 33 34 35 36 37 38 39 40 41 42 43 44 45 46 47 48 49 50 51 52 53 54 55 56 57
For Peer Review Only
KEY WORDS
Early-onset fetal growth restriction, small-for-gestational-age, fetal hemodynamics, umbilical artery, fetal middle cerebral artery, ductus venosus. 3 4 5 6 7 8 9 10 11 12 13 14 15 16 17 18 19 20 21 22 23 24 25 26 27 28 29 30 31 32 33 34 35 36 37 38 39 40 41 42 43 44 45 46 47 48 49 50 51 52 53 54 55 56 57 58
For Peer Review Only
INTRODUCTION
Growth restriction imposes an adaptive burden on fetal hemodynamics, which aims to improve intrauterine survival1. This strain has been recently characterized and divided from a physiopathological point of view in two different conditions2. Late-onset fetal growth restriction (FGR) occurs more frequently, and is characterized by a state of nutritional imbalance with a preserved or mildly impaired placental function. The middle cerebral artery (MCA) Doppler and the cerebroplacental ratio (CPR) are usually the first to be affected in these pregnancies, while the umbilical artery (UA) Doppler pulsatility index (PI) remains normal or mildly increased3. On the other extreme, early-onset FGR is initiated by placental dysfunction, resulting in anomalies of the UA blood flow, followed by changes in the MCA PI and the CPR in the so-called “brain-sparing phenomenon”. If restriction progresses, the left ventricle becomes dominant, and the flow in the aortic isthmus becomes reverted. Finally, late adaptive changes include an increase in the ductus venosus pulsatility index of the vein (DV PIV), reflecting different degrees of cardiac failure, which in severe cases anticipate fetal death4-10. This scenario of hemodynamic changes in early-onset fetal growth restriction was generally accepted for long as the most frequent. However it has been recently challenged11, suggesting that no specific sequence of Doppler progression among the participant vessels was more frequent than the other. The purpose of the study was to evaluate the progression of hemodynamic changes in small for gestational age (SGA) fetuses.
3 4 5 6 7 8 9 10 11 12 13 14 15 16 17 18 19 20 21 22 23 24 25 26 27 28 29 30 31 32 33 34 35 36 37 38 39 40 41 42 43 44 45 46 47 48 49 50 51 52 53 54 55 56 57
For Peer Review Only
MATERIAL AND METHODS
In a retrospective study, 948 Doppler examinations of the UA PI, MCA PI and DV PIV were performed between 24 and 33 weeks (24+0-33+6 days) in 405 early-onset SGA fetuses attending the ultrasound and prenatal diagnosis units of two tertiary centers in the UK (London) and Spain (Valencia). All fetuses had an estimated fetal weight (EFW) at examination below the 10th centile according to Hadlock 4 formula12 and were delivered prior to 37 weeks’ gestation (36+6 days). The birth weight of all these fetuses was confirmed to be below the 10th centile at delivery. Fetuses affected with aneuploidy or major structural abnormalities were not included. As the object of the study was the evaluation of Doppler progression towards abnormal values, for every fetus and regardless of the number of examinations, we took into account only the first time the UA PI, MCA PI and DV PI crossed their abnormal percentiles (>95th centile for the UA PI, >95th centile for the DV PIV and <5th centile for the MCA PI). We acknowledge this was not the only way to analyze data, however we considered this methodology depicted better the order of Doppler progression.
The limit percentile values were calculated for each week of gestational age (GA) according to the following formulas14-16:
UA PI P95 = 2.6075 - 0.061129 * GA + 0. 00057877 * GA2
MCA PI P5 = -1.404152194 + 0.209338699 * GA - 0.003768618 * GA2 DV PIV P95 = 0.69054 + 0.01431 * GA - 0.00035751 * GA2
Where GA indicated the gestational age at examination expressed in weeks For every fetus, we studied the order in which the three Doppler parameters became abnormal and calculated for all fetuses the frequency of all possible 3 4 5 6 7 8 9 10 11 12 13 14 15 16 17 18 19 20 21 22 23 24 25 26 27 28 29 30 31 32 33 34 35 36 37 38 39 40 41 42 43 44 45 46 47 48 49 50 51 52 53 54 55 56 57 58
For Peer Review Only
combinations of Doppler progressions. In other words, the number of times a specific sequence of Doppler anomalies followed a specific order, including those in which only one, two or the three vessels were abnormal. Importantly, we considered the existence of an abnormal Doppler value when it was found abnormal for the first time, even though this parameter became normal in any of the following examinations, e.g. following the administration of steroids. Management of cases with two or more abnormal Doppler parameters in the same examination.
In case that two or three Doppler parameters were abnormal at the same time the parameter that showed a higher statistical difference with its limit percentile was considered first in the sequence to become abnormal. This was also the methodology followed in fetuses with only one or with few examinations.
Management of fetuses with only one examination
Although we initially thought that only fetuses with multiple examinations could inform about Doppler progression (like small sequences of Doppler changes that could be collected and studied) in fact fetuses with only one examination were also interesting. The methodology applied to obtain information of progression in these cases used again the statistical differences with the respective abnormal percentiles to evaluate which Doppler parameter had earlier become abnormal.
For example: let us consider that in a fetus with only one examination at week 32 the DV Doppler was normal (<p95) and the UA and MCA Doppler were both abnormal (respectively >p95 and <p5). So the progression order could be either UAMCA or MCAUA. In order to know which parameter had 3 4 5 6 7 8 9 10 11 12 13 14 15 16 17 18 19 20 21 22 23 24 25 26 27 28 29 30 31 32 33 34 35 36 37 38 39 40 41 42 43 44 45 46 47 48 49 50 51 52 53 54 55 56 57
For Peer Review Only
been the first to become abnormal we calculated the statistical difference with the respective limit percentile (the 5th percentile for the MCA, and the 95th percentile for the UA Doppler). If the difference with this limit percentile was for example minimal in the UA Doppler, and more important in the MCA Doppler, this meant that the MCA had probably become abnormal earlier. Therefore, the sequence of activation in this fetus might be expressed as MCAUA.
This was done in all fetuses with a single examination, being these sequences incorporated to the general sum of sequences in order to evaluate the general order of Doppler progression. In fetuses with two or more examinations the same procedure was applied. However, in these cases only the first abnormal examination (the first time the Doppler value became abnormal) was taken into account.
We were aware that these calculations were based on statistical assumptions however as the errors were applicable to the three Doppler parameters, we considered that the final bias introduced in the total sum of Doppler progression represented just a small deviation from real order in fetuses with multiple examinations.
Apart from this general order, we also evaluated the frequency of fetuses with any abnormal Doppler, the frequency of fetuses following the classical sequence (UAMCADV) among those with any abnormal Doppler, the frequency of fetuses following the classical sequence among those showing initial hemodynamic changes (abnormal UA PI or MCA PI values), the frequency of fetuses following the classical sequence among those showing late hemodynamic changes (an abnormal DV PIV value) and finally, the 3 4 5 6 7 8 9 10 11 12 13 14 15 16 17 18 19 20 21 22 23 24 25 26 27 28 29 30 31 32 33 34 35 36 37 38 39 40 41 42 43 44 45 46 47 48 49 50 51 52 53 54 55 56 57 58
For Peer Review Only
frequency of cases with an abnormal DV PIV as the last parameter to be affected among those with an abnormal DV PIV.
Subsequently, in order to compare how the three parameters became abnormal in relation with the interval to delivery, we constructed three scattergrams in which the differences between the 948 UA PI, MCA PI and DV PIV values and their limit percentiles were plotted against the indicated interval. In this graphs we drew a line that represented the limit centile for each parameter (where the difference was equal to 0), and calculated three regression lines for the scattered values representing the 10th, 50th and 90th percentiles. All these regression lines were constructed using splines to allow for non-linear relationships and taking into account that some of the values might have been longitudinally obtained in the same patient. In order to compare the three parameters, the x-axis point where the median regression line crossed the limit centile line represented for each parameter the interval to delivery in which 50% of the fetuses became abnormal. These crossing points were used to compare the intervals among the three parameters. Finally, a graph describing the cumulative sum of abnormal Doppler events in the 948 examinations was plotted against the interval to delivery. Three ascending lines representing the three Doppler parameters reflected how the sum of abnormal Doppler examinations grew in relation to this interval.
The work received an IRB authorization to perform retrospective studies. Statistical analysis and graphs were performed with R-Software® 3.2.2 (http://www.r-project.org/). The statistical significance was established at p<0.05. A search in PubMed was done, to identify previous citations reporting the sequence of changes in the UA, MCA and DV Doppler parameters in 3 4 5 6 7 8 9 10 11 12 13 14 15 16 17 18 19 20 21 22 23 24 25 26 27 28 29 30 31 32 33 34 35 36 37 38 39 40 41 42 43 44 45 46 47 48 49 50 51 52 53 54 55 56 57
For Peer Review Only
pregnancies complicated by SGA. Reference lists of relevant articles and reviews were hand searched for additional reports. The authors report no conflicts of interest. 3 4 5 6 7 8 9 10 11 12 13 14 15 16 17 18 19 20 21 22 23 24 25 26 27 28 29 30 31 32 33 34 35 36 37 38 39 40 41 42 43 44 45 46 47 48 49 50 51 52 53 54 55 56 57 58
For Peer Review Only
RESULTS
The total number of examinations was 948, the total number of fetuses was 405 and the median (and interquartile range, IQR) GA at the first examination was 28.86 (27.14-31.43) weeks. All fetuses had at least one examination. Of these 157 (43.7%), 89 (24.8%), 42 (11.7%), 26 (7.2%), 13 (3.6%), 11 (3.1%), 7 (2.0%), 5 (1.4%), 4 (1.1%), 1 (0.3%), 3 (0.8%) and 1 (0.3%) were respectively examined 1, 2, 3, 4, 5, 6, 7, 8, 9, 10, 11, and 16 times.
The descriptive statistics of the study population are shown in table 1. The study group had a median (and IQR) maternal age of 30 (26-34) years a median GA at examination of 29.57 (28.14-31.71) weeks, a median GA at delivery of 31.79 (29.57-34) weeks, a median estimated fetal weight (EFW, according to Hadlock equation-412) of 890 (640-1230) g, a median BW of 1080 (750-1380) g, a median EFW12 centile of 0.09 (0.01-0.57), a median BW centile of 0.35 (0.08-1.42) and a median interval examination-delivery of 1.28 (0.43-2.89) weeks.
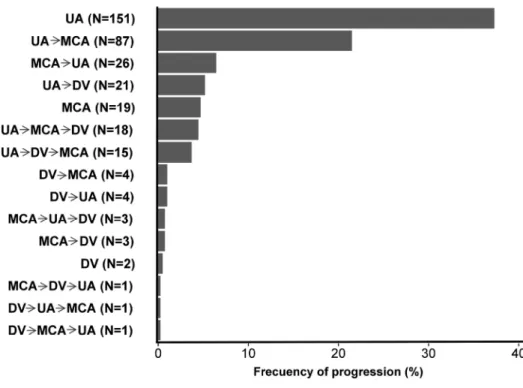
The order in which the abnormal Doppler values were observed and the frequency of the sequences of Doppler progression is shown in table 2 and in figure 1. Of the 405 fetuses studied, 46 (11.4%) did not present abnormal Doppler values, while 359 (88.6%) showed at least one abnormal Doppler value in any of the examinations performed. Of the 359 fetuses that presented Doppler anomalies, the most frequent sequence for the appearance of abnormal Doppler values (n=151, 42.1%) was that in which only the UA PI was abnormal, the second (n=87, 24.2%) in which an abnormal UA PI appeared first, followed by an abnormal MCA PI and the third (n=26, 7.2%) in which an abnormal MCA PI appeared first followed by an abnormal UA PI. Of 3 4 5 6 7 8 9 10 11 12 13 14 15 16 17 18 19 20 21 22 23 24 25 26 27 28 29 30 31 32 33 34 35 36 37 38 39 40 41 42 43 44 45 46 47 48 49 50 51 52 53 54 55 56 57
For Peer Review Only
the 359 fetuses with any abnormal Doppler, 256 (71.3%) presented progression orders that followed the classical sequence UAMCADV, while 103 (28.7%) did not. However, if we performed the analysis considering the existence of early (changes in the UA and MCA PI) or late hemodynamic changes (changes in the DV PIV), we found that those with early changes (n=283) followed the classical sequence in a higher proportion of cases (n= 238, 84.1%). Conversely, when the DV was affected (n=73), the classical sequence was much less frequent, and although in 64.4% (n=47) of these fetuses the DV PI remained as the last parameter to be abnormal, only a small proportion (n=18; 24.7%) of abnormal DV PIV values were preceded by the full expected progression sequence.
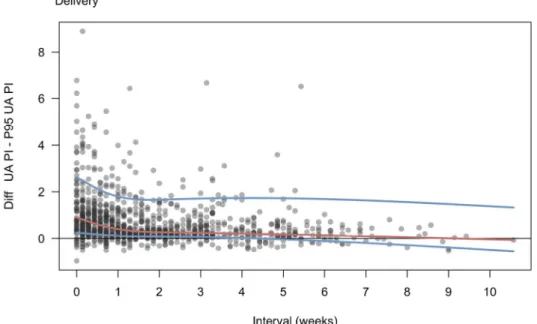
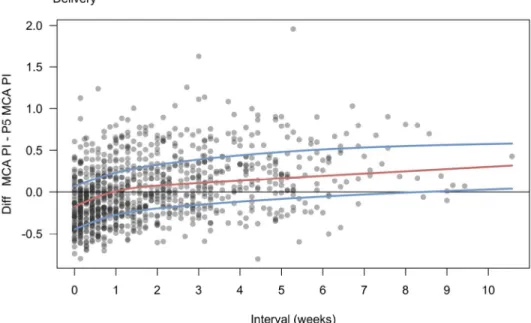
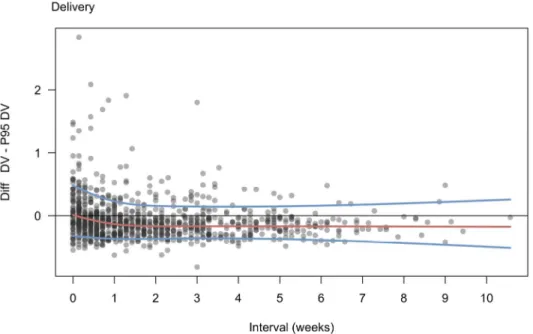
Regarding the intervals to delivery, the percentile regressions drawn on the scattergrams which represented the differences between the Doppler values and the abnormal percentiles, showed that the UA PI was the first parameter to be affected, as 50% of the fetuses (represented by the median line or percentile 50th regression line) showed abnormal UA PI values 9 weeks prior to delivery (figure 2A), while for the MCA PI this occurred 1 week before delivery (figure 2B) and for the DV PIV 0 days before delivery (figure 2C). Finally, the graph describing the cumulative sum of abnormal Doppler events (figure 3) showed that the number of Doppler examinations crossing the limit percentile raised in the UA PI 8 weeks prior to delivery, while in the MCA and DV this was observed 3 weeks and one week before delivery, respectively The literature review revealed 8 studies in which the sequence of Doppler changes in pregnancies complicated by FGR was described. The details of these studies are shown in table 3.
3 4 5 6 7 8 9 10 11 12 13 14 15 16 17 18 19 20 21 22 23 24 25 26 27 28 29 30 31 32 33 34 35 36 37 38 39 40 41 42 43 44 45 46 47 48 49 50 51 52 53 54 55 56 57 58
For Peer Review Only
DISCUSSION Summary of findings
The findings of this study suggest that the order of progression of Doppler abnormities in early-onset SGA follows a predictable pattern in the majority of cases. The hemodynamic changes start with an increase in the UA PI, followed by a reduction in the MCA PI, and an increase in the DV PIV. In 71.3% of cases the observed pattern fully coincides with the previously reported order, and this frequency rises to 84.1% if we consider the early hemodynamic changes (abnormal UA PI and MCA PI) only. Furthermore the Doppler changes in the UA are already seen in 50% of the patients 9 weeks before delivery. This was followed by Doppler changes in the MCA PI and DV, which were observed in 50% of the pregnancies one and 0 weeks prior delivery, respectively.
Interpretation of these findings and comparison with existing literature
The initially described hemodynamic changes in early-onset SGA fetuses follow a pattern in which an early increase in the umbilical artery resistance, is followed by a mechanism of brain sparing with vasodilation of the MCA, and a further increase in the resistance in the DV, heralding the presence of brain sparing and cardiac failure4-10. This sequence of Doppler activations was recently challenged11 suggesting that no specific order predominated over the other. We have shown that in contrary to these last descriptions, the order of progression of Doppler abnormalities during FGR tends to follow a predictable order that coincides with the physiological order of experimental adaption to growth restriction17. 3 4 5 6 7 8 9 10 11 12 13 14 15 16 17 18 19 20 21 22 23 24 25 26 27 28 29 30 31 32 33 34 35 36 37 38 39 40 41 42 43 44 45 46 47 48 49 50 51 52 53 54 55 56 57
For Peer Review Only
Our study is in line with the earlier studies, reporting a common pattern of Doppler progression4-10, and differs from the conclusions shown in the PORTO study11 (Table 3). An explanation could be the different inclusion criteria in these studies. Our study included only pregnancies with suspected early-onset SGA (defined as EFW below the 10th centile), which was confirmed to be SGA at birth (defined as BW below the 10th centile). Furthermore, our fetuses were examined before 34 weeks and were delivered always before 37 weeks’ gestation. Contrarily, the PORTO study included a mix of pregnancies with early and late-onset cases, which according to their data were frequently examined after 34 weeks and usually delivered after 37 weeks’ gestation. This issue is of paramount importance, as the progression of Doppler changes is known to differ in both gestational intervals according to the different physiopathological mechanisms occurring in early and late-onset FGR18.
Clinical and research implications
Taking into account that the late stages in the sequence of Doppler deterioration are associated with a worse pregnancy outcome6,7, the existence of this predictable progression is crucial to schedule the frequency of the ultrasound assessments and plan parental counselling19. Although the aim of the study was the evaluation of the order of progression of Doppler abnormalities, we also included a mean interval value for comparison purposes among the three vessels and a cumulative sum of first time Doppler abnormalities. Interestingly, our results were in line with the findings of previous studies, especially those which aimed to calculate these intervals and cumulative sums in a more accurate way4,20, 21.
3 4 5 6 7 8 9 10 11 12 13 14 15 16 17 18 19 20 21 22 23 24 25 26 27 28 29 30 31 32 33 34 35 36 37 38 39 40 41 42 43 44 45 46 47 48 49 50 51 52 53 54 55 56 57 58
For Peer Review Only
Two other interesting findings could also be highlighted in our study. One is that the presence of an abnormal MCA PI occurs on average much later that earlier described20, when the UA impedance is already abnormal, a finding in line with an earlier work published by our group22. The other is that the expected sequence of Doppler progression seems to vary depending on the stage of hemodynamic compensation. In fact, fetuses affected with early Doppler changes (UA PI or MCA PI) tend to maintain more frequently the predicted classical sequence (84.1%) than those at the end of the hemodynamic compensation (abnormal DV PIV) (24.7%). Considering that the presence of an abnormal DV has proven to be the best Doppler predictor of fetal acidosis, and postnatal neurocognitive impairment23-24, our study underlines that an abnormal DV PIV might not be always preceeded by an abnormal UA PI followed by an abnormal MCA PI, and could be, for example, directly preceded by an abnormal UA PI without the presence of an abnormal MCA PI (N=21, 5.8%). This issue is however minimized by the fact that 47 (64.4%) of the 73 cases with an abnormal DV Doppler, presented it as the last parameter to be affected, and therefore the presence of an abnormal DV PI should still be considered as a sign of late hemodynamic dysfunction.
Strengths and weaknesses
Our study is the first to study Doppler progression from a double perspective; the order of appearance of Doppler abnormalities regardless of GA and time intervals, and the analysis of Doppler abnormalities in relation to the examination-to-delivery interval. We consider that this combined approach provided more robust assessment in order to evaluate the progression of fetal hemodynamics. Furthermore, our study focused on early-onset smallness by 3 4 5 6 7 8 9 10 11 12 13 14 15 16 17 18 19 20 21 22 23 24 25 26 27 28 29 30 31 32 33 34 35 36 37 38 39 40 41 42 43 44 45 46 47 48 49 50 51 52 53 54 55 56 57
For Peer Review Only
including pregnancies with EFW less than 10th centile before 34 weeks’ gestation. However, we did not include other Doppler parameters such as the aortic isthmus or the myocardial performance index20,21. Unfortunately, these data were not available in the majority of the cases. Also, we defined the existence of an abnormal Doppler value when it was found abnormal for the first time, even though it became normal afterwards in the follow-up, a discrepancy that could be due to the use of corticosteroids for lung maturation, which is known to influence the Doppler values24 or directly due to technical or intra and inter-observer measurement errors. We recognize that this might cause biases in the calculation of frequencies and sequences of Doppler abnormalities. However, the fact that all the parameters (UA, MCA and DV) were affected similarly by the same circumstances would diminish the possibility of systematic bias. Finally, considering the order of Doppler progression, we considered that a parameter was affected first when statistically its value was further away from the limit percentile. We were aware that this was only a mathematical approach. However the bias was again minimized considering that the possible error would be equally distributed among the three parameters. In addition, from a methodological point of view, it was the only way to analyze much of the data, as not infrequently two different parameters were found to be affected at unison in the same examination.
Conclusion
As observed in earlier animal experimentation17 and in earlier human observational studies4-9, the progression order of Doppler abnormalities in early-onset smallness tends to follow a predictable order, with an increase in 3 4 5 6 7 8 9 10 11 12 13 14 15 16 17 18 19 20 21 22 23 24 25 26 27 28 29 30 31 32 33 34 35 36 37 38 39 40 41 42 43 44 45 46 47 48 49 50 51 52 53 54 55 56 57 58
For Peer Review Only
UA PI followed by a decrease in the MCA PI and an abnormal DV PIV. In one third of cases however, variations may occur, especially in the latter stages of fetal adaptation, when the DV Doppler is involved. More studies are needed to elucidate the cause of those exceptional Doppler progression patterns.
3 4 5 6 7 8 9 10 11 12 13 14 15 16 17 18 19 20 21 22 23 24 25 26 27 28 29 30 31 32 33 34 35 36 37 38 39 40 41 42 43 44 45 46 47 48 49 50 51 52 53 54 55 56 57
For Peer Review Only
REFERENCES
1. Verburg BO, Jaddoe VW, Wladimiroff JW, Hofman A, Witteman JC, Steegers EA. Fetal hemodynamic adaptive changes related to intrauterine growth: the Generation R Study. Circulation. 2008;117:649-59. 2. Figueras F, Gratacós E. Update on the diagnosis and classification of fetal growth restriction and proposal of a stage-based management protocol. Fetal Diagn Ther. 2014;36:86-98.
3. Morales-Roselló J, Khalil A, Perales-Marín A. The PORTO study and the importance of cerebroplacental ratio in fetalgrowth restriction. Am J Obstet Gynecol. 2015;212:551-2.
4. Ferrazzi E, Bozzo M, Rigano S, Bellotti M, Morabito A, Pardi G, Battaglia FC, Galan HL. Temporal sequence of abnormal Doppler changes in the peripheral and central circulatory systems of the severely growth-restricted fetus. Ultrasound Obstet Gynecol. 2002;19:140-6.
5. Baschat AA, Gembruch U, Harman CR. The sequence of changes in Doppler and biophysical parameters as severe fetal growth restriction worsens. Ultrasound Obstet Gynecol. 2001;18:571-7.
6. Baschat AA, Gembruch U, Reiss I, Gortner L, Weiner CP, Harman CR. Relationship between arterial and venous Doppler and perinatal outcome in fetal growthrestriction. Ultrasound Obstet Gynecol. 2000;16:407-13.
7. Ozcan T, Sbracia M, d'Ancona RL, Copel JA, Mari G. Arterial and venous Doppler velocimetry in the severely growth-restricted fetus and associations with adverse perinatal outcome. Ultrasound Obstet Gynecol. 1998;12:39-44. 8. Turan OM, Turan S, Gungor S, Berg C, Moyano D, Gembruch U, Nicolaides KH, Harman CR, Baschat AA. Progression of Doppler 3 4 5 6 7 8 9 10 11 12 13 14 15 16 17 18 19 20 21 22 23 24 25 26 27 28 29 30 31 32 33 34 35 36 37 38 39 40 41 42 43 44 45 46 47 48 49 50 51 52 53 54 55 56 57 58
For Peer Review Only
abnormalities in intrauterine growth restriction. Ultrasound Obstet Gynecol. 2008;32:160-7.
9. Machlitt A, Wauer RR, Chaoui R. Longitudinal observation of deterioration of Doppler parameters, computerized cardiotocogram and clinical course in a fetus with growth restriction. J Perinat Med. 2001;29:71-6.
10. Hecher K, Bilardo CM, Stigter RH, Ville Y, Hackelöer BJ, Kok HJ, Senat MV, Visser GH. Monitoring of fetuses with intrauterine growth restriction: a longitudinal study. Ultrasound Obstet Gynecol. 2001;18:564-70.
11. Unterscheider J, Daly S, Geary MP, Kennelly MM, McAuliffe FM, O'Donoghue K, Hunter A, Morrison JJ, Burke G, Dicker P, Tully EC, Malone FD. Predictable progressive Doppler deterioration in IUGR: does it really exist? Am J Obstet Gynecol. 2013;209:539.e1-7.
12. Hadlock FP, Harrist RB, Sharman RS, Deter RL, Park SK. Estimation of fetal weight with the use of head, body, and femur measurements- a prospective study. Am J Obstet Gynecol. 1985;151:333-7.
13. Yudkin PL, Aboualfa M, Eyre JA, Redman CW, Wilkinson AR. New birthweight and head circumference centiles for gestational ages 24 to 42 weeks. Early Hum Dev 1987;15:45-52.
14. Acharya G, Wilsgestational ageard T, Berntsen GK, Maltau JM, Kiserud T. Reference ranges for serial measurements of umbilical artery Doppler indices in the second half of pregnancy. Am J Obstet Gynecol 2005;192:937-44. 15. Morales-Roselló J, Khalil A, Morlando M, Hervás-Marín D, Perales-Marín A. Doppler reference values of the fetal vertebral and middle cerebral arteries, at 19-41 weeks gestation. J Matern Fetal Neonatal Med. 2015;28:338-43. 3 4 5 6 7 8 9 10 11 12 13 14 15 16 17 18 19 20 21 22 23 24 25 26 27 28 29 30 31 32 33 34 35 36 37 38 39 40 41 42 43 44 45 46 47 48 49 50 51 52 53 54 55 56 57
For Peer Review Only
16. Kessler J, Rasmussen S, Hanson M, Kiserud T. Longitudinal reference ranges for ductus venosus flow velocities and waveform indices. Ultrasound Obstet Gynecol. 2006;28:890-8.
17. López-Tello J, Barbero A, González-Bulnes A, Astiz S, Rodríguez M, Formoso-Rafferty N, Arias-Álvarez M, Rebollar PG. Characterization of early changes in fetoplacental hemodynamics in a diet-induced rabbit model of IUGR. J Dev Orig Health Dis. 2015;6:454-61.
18. Morales-Roselló J, Khalil A. Fetal cerebroplacental ratio and adverse perinatal outcome. J Perinat Med. 2016;44:355.
19. Baschat AA, Hecher K. Fetal growth restriction due to placental disease. Semin Perinatol. 2004;28:67-80.
20. Figueras F, Benavides A, Del Rio M, Crispi F, Eixarch E, Martinez JM, Hernandez-Andrade E, Gratacós E. Monitoring of fetuses with intrauterine growth restriction: longitudinal changes in ductus venosus and aortic isthmus flow. Ultrasound Obstet Gynecol. 2009;33:39-43.
21. Cruz-Martinez R, Figueras F, Benavides-Serralde A, Crispi F, Hernandez-Andrade E, Gratacos E. Sequence of changes in myocardial performance index in relation to aortic isthmus and ductus venosus Doppler in fetuses with early-onset intrauterine growth restriction. Ultrasound Obstet Gynecol. 2011;38:179-84.
22. Morales Roselló J, Hervás Marín D, Perales Marín A, López Fraile S. Doppler study of the fetal vertebral and middle cerebral arteries in fetuses with normal and increased umbilical artery resistance indices. J Clin Ultrasound. 2013;41:224-9. 3 4 5 6 7 8 9 10 11 12 13 14 15 16 17 18 19 20 21 22 23 24 25 26 27 28 29 30 31 32 33 34 35 36 37 38 39 40 41 42 43 44 45 46 47 48 49 50 51 52 53 54 55 56 57 58
For Peer Review Only
23. Lees CC, Marlow N, van Wassenaer-Leemhuis A, Arabin B, Bilardo CM, Brezinka C, Calvert S, Derks JB, Diemert A, Duvekot JJ, Ferrazzi E, Frusca T, Ganzevoort W, Hecher K, Martinelli P, Ostermayer E, Papageorghiou AT, Schlembach D, Schneider KT, Thilaganathan B, Todros T, Valcamonico A, Visser GH, Wolf H; TRUFFLE study group. 2 year neurodevelopmental and intermediate perinatal outcomes in infants with very preterm fetal growth restriction (TRUFFLE); a randomized trial. Lancet. 2015 30;385:2162-72. 24. Lees C, Marlow N, Arabin B, Bilardo CM, Brezinka C, Derks JB, Duvekot J, Frusca T, Diemert A, Ferrazzi E, Ganzevoort W, Hecher K, Martinelli P, Ostermayer E, Papageorghiou AT, Schlembach D, Schneider KT, Thilaganathan B, Todros T, van Wassenaer-Leemhuis A, Valcamonico A, Visser GH, Wolf H; TRUFFLE Group. Perinatal morbidity and mortality in early-onset fetal growth restriction: cohort outcomes of the trial of randomized umbilical and fetal flow in Europe (TRUFFLE). Ultrasound Obstet Gynecol. 2013;42:400-8.
25. Nozaki AM, Francisco RP, Fonseca ES, Miyadahira S, Zugaib M. Fetal hemodynamic changes following maternal betamethasone administration in pregnancies with fetal growth restriction and absent end-diastolic flow in the umbilical artery. Acta Obstet Gynecol Scand. 2009;88:350-4.
3 4 5 6 7 8 9 10 11 12 13 14 15 16 17 18 19 20 21 22 23 24 25 26 27 28 29 30 31 32 33 34 35 36 37 38 39 40 41 42 43 44 45 46 47 48 49 50 51 52 53 54 55 56 57
For Peer Review Only
Figure 1. Sequence of progression for Doppler anomalies observed in the studied group of small-for-gestational age fetuses. 71% of cases coincided with the progressive sequence of abnormal values in the UA
PI, MCA PI and DV PIV. Exceptions to this scenario occur mostly in the last stages of the hemodynamic progression. figure 1 141x100mm (300 x 300 DPI) 3 4 5 6 7 8 9 10 11 12 13 14 15 16 17 18 19 20 21 22 23 24 25 26 27 28 29 30 31 32 33 34 35 36 37 38 39 40 41 42 43 44 45 46 47 48 49 50 51 52 53 54 55 56 57 58
For Peer Review Only
Figure 2A. Observed UA PI values – UA PI 95th centile. 0 line represents those values at the limit of normality. As soon as eight weeks before the end of pregnancy half of the fetuses already present anomalies
in the UA PI. figure 2a 133x90mm (300 x 300 DPI) 3 4 5 6 7 8 9 10 11 12 13 14 15 16 17 18 19 20 21 22 23 24 25 26 27 28 29 30 31 32 33 34 35 36 37 38 39 40 41 42 43 44 45 46 47 48 49 50 51 52 53 54 55 56 57
For Peer Review Only
Figure 2B. Observed MCA PI values – MCA PI 5th centile. 0 line represents those values at the limit of normality. One week before the end of pregnancy half of the fetuses present anomalies in the MCA PI.
figure 2b 133x90mm (300 x 300 DPI) 3 4 5 6 7 8 9 10 11 12 13 14 15 16 17 18 19 20 21 22 23 24 25 26 27 28 29 30 31 32 33 34 35 36 37 38 39 40 41 42 43 44 45 46 47 48 49 50 51 52 53 54 55 56 57 58
For Peer Review Only
Figure 2C. Observed DV PI values – DV PI 95th centile. 0 line represents those values at the limit of normality. At the end of pregnancy half of the fetuses already present anomalies in the DV PI.
figure 2c 133x90mm (300 x 300 DPI) 3 4 5 6 7 8 9 10 11 12 13 14 15 16 17 18 19 20 21 22 23 24 25 26 27 28 29 30 31 32 33 34 35 36 37 38 39 40 41 42 43 44 45 46 47 48 49 50 51 52 53 54 55 56 57
For Peer Review Only
Figure 3. Cumulative sum of Doppler anomalies along the interval to delivery. The UA was the parameter in which the abnormal percentile was sooner and most frequently crossed, followed by the MCA and the DV. The increase of Doppler examinations crossing the limit percentile appeared in the UA PI as soon as 8 weeks
prior to delivery, while in the MCA and DV this was respectively observed 3 and 1 weeks before the end of pregnancy. figure 3 133x90mm (300 x 300 DPI) 3 4 5 6 7 8 9 10 11 12 13 14 15 16 17 18 19 20 21 22 23 24 25 26 27 28 29 30 31 32 33 34 35 36 37 38 39 40 41 42 43 44 45 46 47 48 49 50 51 52 53 54 55 56 57 58
For Peer Review Only
Table 1.
Description of the study group
Parameter
Median (IQR) or N (%)
Age (years)
30 (26-34)
Gestational age at examination (weeks)
29.57 (28.14-31.71)
Gestational age at delivery
31.79 (29.57- 34)
EFW (Hadlock-4) (grams)
890 (640 -1230)
BW (grams)
1080 (750-1380)
EFW (Hadlock-4) centile
0.09 (0.01-0.57)
BW centile
0.35 (0.08, 1.42)
Interval examination-delivery (weeks)
1.28 (0.43, 2.89)
Gestational age at the 1
stexamination (weeks)
28.86 (27.14-31.43)
Examinations (total)
948
Fetuses (total)
405
Fetuses with no abnormal Doppler
46 (11.4%)
Fetuses with any abnormal Doppler
359 (88,6%)
Fetuses with 1 examination
157 (43.73)
Fetuses with 2 examinations
89 (24.79)
Fetuses with 3 examinations
42 (11.70)
Fetuses with 4 examinations
26 (7.24)
Fetuses with 5 examinations
13 (3.62)
Fetuses with 6 examinations
11 (3.06)
Fetuses with 7 examinations
7 (1.95)
Fetuses with 8 examinations
5 (1.39)
Fetuses with 9 examinations
4 (1.11)
Fetuses with 10 examinations
1 (0.28)
Fetuses with 11 examinations
3 (0.84)
Fetuses with 16 examinations
1 (0.28)
3 4 5 6 7 8 9 10 11 12 13 14 15 16 17 18 19 20 21 22 23 24 25 26 27 28 29 30 31 32 33 34 35 36 37 38 39 40 41 42 43 44 45 46 47 48 49 50 51 52 53 54 55 56 57
For Peer Review Only
Table 2
Progression pattern for the Doppler anomalies in the UA, MCA and DV; percentage of progression for the different sequences.
Sequence N Frequency
Total early-onset small fetuses (EFW<p10) 405 100.00%
No abnormal Doppler found in the follow-up 46 11.36%
Any abnormal Doppler found in the follow-up 359 88.64%
UA alone 151 42.06%* UAMCA 87 24.23%* MCAUA 26 7.24%* UADV 21 5.84%* MCA alone 19 5.29%* UAMCADV 18 5.01%* UADVMCA 15 4.17%* DVMCA 4 1.11%* DVUA 4 1.11%* MCAUADV 3 0.83%* MCADV 3 0.83%* DV alone 2 0.56%* MCADVUA 1 0.28%* DVUAMCA 1 0.28%* DVMCAUA 1 0.28%*
Sequences following the classical sequence among those with any abnormal Doppler
(UA alone, UAMCA, UAMCADV)
256 71.31%*
Sequences not following the classical sequence among those with any abnormal Doppler
(UADV, MCA alone, MCAUA,
UADVMCA, DV alone, DVMCA,
DVUA, MCAUADV, MCADV,
MCADVUA, DVUAMCA,
DVMCAUA)
103 28.69%*
Sequences following the classical sequence in early stages of hemodynamic dysfunction (abnormal Doppler in the UA or MCA, N=283).
(UA alone, UAMCA)
238 84.10%†
Sequences not following the classical sequence in early stages of hemodynamic dysfunction (abnormal Doppler in the UA or MCA, N=283).
(MCA alone, MCAUA)
45 15.90%†
Sequences following the classical sequence in late stages of hemodynamic compensation (abnormal Doppler in the DV, N=73).
(UAMCADV)
18 24.66%††
Sequences not following the classical sequence in late stages of hemodynamic compensation
55 75.34%†† 3 4 5 6 7 8 9 10 11 12 13 14 15 16 17 18 19 20 21 22 23 24 25 26 27 28 29 30 31 32 33 34 35 36 37 38 39 40 41 42 43 44 45 46 47 48 49 50 51 52 53 54 55 56 57 58
For Peer Review Only
Notes: UA=umbilical artery Doppler, MCA= middle cerebral artery Doppler, DV= ductus venosus Doppler, p=percentile, *indicated percentage refers only to cases with any abnormal Doppler (N=359),
†indicated percentage refers only to early stages of hemodynamic
dysfunction (abnormal Doppler in the UA or MCA) (N=283), ††indicated
percentage refers only to late stages of hemodynamic dysfunction
(abnormal Doppler in the DV) (N=73), ††indicated percentage refers only
to fetuses with an abnormal Doppler in the DV (N=73).
MCADV, MCADVUA, DVUAMCA,
DVMCAUA)
DV PIV as the last abnormal Doppler to be affected in fetuses with an abnormal Doppler in the DV, (N=73). 47 64.38%†† 3 4 5 6 7 8 9 10 11 12 13 14 15 16 17 18 19 20 21 22 23 24 25 26 27 28 29 30 31 32 33 34 35 36 37 38 39 40 41 42 43 44 45 46 47 48 49 50 51 52 53 54 55 56 57
For Peer Review Only
Comparison among the different studies evaluating either Doppler progression or the sequence of changes followed by the different Doppler parameters.
NOTES: UA: umbilical artery, MCA: middle cerebral artery, DV: ductus venosus, UV: umbilical vein, MPI: myocardial performance index, AoI: aortic isthmus, DT-Ao: descending thoracic aorta, Ao-OT: aortic outflow tract, P-OT: pulmonary outflow tract, IVC: inferior vena cava, PI: pulsatility index, G: group, P: percentile, †cases with 2 normalized MCA PI values were excluded, exam: examination, EFW: estimated fetal weight, CTG: cardiotocogram, BPS: biophysical score, GA: gestational age.
Study N GA at exam (weeks) GA at delivery (weeks) Inclusion criteria Vessels examined Other exams Interval exam. Number exams per fetus Criteria for abnormal Doppler Finalization of pregnancy criteria
Method of analysis Conclusions
Ozcan et al7 1998 19 fetuses 26.4-31.4 27-32 EFW<P5th UA, MCA, DV, UV CTG No interval (1 measurement only)
1 (the last) First measurement
abnormal
Abnormal CTG
Association of arterial
and venous Doppler
parameters with perinatal outcome
DV Doppler was the only parameter associated with perinatal death and low 5’ Apgar score
Baschat et al6 2000 121 fetuses Not indicated 24-40 G1: 27-40 G2: 27-37 G3: 24-37 AC<P5th + abnormal UA PI. BW<P10th UA, MCA, DV, IVC, UV CTG, BPS
Not indicated At least 2 First measurement
abnormal†
Abnormal CTG and BPS
Classification of fetuses in 3 groups according to Doppler findings with outcome comparison
Progression of Doppler changes
exists: 1-UA, 2-MCA, 3-DV.
Outcome depends on progression.
Baschat et al5 2001 236 fetuses 44 with abnormal BPS 16-37 Entry at: 16-31, Last exam: 24-37 25-37 (Stillbirth: 25-28, livebirths: 26-37) AC<P5th + abnormal UA PI. BW<P10th UA, MCA, DV, IVC, UV CTG, BPS 1-14 days,
daily the last week 4-17 First measurement abnormal† Abnormal BPS, CTG Percentage of abnormal Doppler findings. Frequencies for Doppler deterioration sequences, progression interval
UA-MCA-DV sequence occurs in 73% of cases. In 64% with the full sequence.
BPS deteriorates at the end of the sequence. Hecher et al10 2001 547 exams, 93 fetuses with at least 3 exams 24 h prior to delivery 24-40 Entry at: 24-34 24-40 Group 1 (24-31) Group 2 (32-40) AC<P5th UA, DT-Ao, MCA, DV, IVC CTG 1-7 days depending on Doppler findings 3-27 (At least 3) First measurement abnormal CTG, Attending obstetrician discretion Patterns of progression: GA at onset, interval to delivery, progression intervals, classification in 2 groups with outcome comparison
Temporal sequence of changes exist: 1-UA, 2-MCA, 3-DV. Outcome depends on progression, DV and CTG are the best predictors of mortality Ferrazzi et al4 2002 26 fetuses <32-34 Entry <32 weeks, followed until 34 weeks 26-34 AC<P2nd abnormal UA PI, abnormal Ut PI UA, MCA, UtA, DV, Ao-OT, P-OT
CTG 2 per week Not
indicated Two or more consecutive abnormal measurements CTG, exclusion of pregnancies with maternal causes to finalize
Cumulative onset time
curves of Doppler
anomalies, interval to
delivery. Outcome
according to progression
Temporal sequence of changes exist: 1-UA and Ut, 2-MCA, 3-DV. Outcome depends on progression. Late changes are the best predictors of adverse outcome. Turan et al8 2008 668 Doppler exams, 104 fetuses 23-33 26-40 AC<P5th+ abnormal UA PI or CPR. BW<P10th UA, MCA, CPR, DV, UV CTG 1-56 days 3-26 (At least 3) First measurement abnormal CTG Attending obstetrician discretion Patterns of progression: GA at onset, interval to delivery, progression intervals
According to the interval to delivery, a temporal sequence of changes exist: 1-UA, 2-MCA, 3-DV. Unterscheider et al (PORTO)11 2013 7769 exams, 1116 patients 24-36 at first exam. Interval of exams not indicated Not indicated Mean and SD 37.8 +-3 weeks EFW<P10th UA, MCA, DV, AoI, MPI CTG 1-14 days Not indicated Not indicated CTG, Attending obstetrician discretion
Frequencies for Doppler deterioration sequences, Cumulative
Frequencies of Doppler anomalies, interval to delivery
Temporal sequence of changes like 1-UA, 2-MCA, 3-DV does not exist as other sequences present a similar frequency Morales-Roselló et al 948 exams, 405 fetuses 24-33+6 <37 EFW<p10th Suspicion of SGA Plus BW<p10th UA, MCA, DV CTG 1-16 First measurement abnormal CTG, Attending obstetrician discretion
Frequencies for Doppler deterioration sequences, Cumulative
Frequencies of Doppler anomalies,
interval to delivery
Temporal sequence of changes: 1-UA, 2-MCA, 3-DV exists. UA-MCA-DV sequence occurs in 2 thirds % of cases. Interval to delivery is shorter for the DV
URL: http://mc.manuscriptcentral.com/djmf Email: [email protected] 3 4 5 6 7 8 9 10 11 12 13 14 15 16 17 18 19 20 21 22 23 24 25 26 27 28 29 30 31 32 33 34 35 36 37 38 39 40 41 42 43 44 45 46 47 48 49 50 51 52 53 54 55 56