i - V i s @ B i l k e n t & c B i o @ M S K C C
SBGNViz.js 1.1 User’s Guide
i-Vis@Bilkent and cBio@MSKCC2014 Bilkent University
Ankara 06800, TURKEY
Table of Contents
1. Introduction ... 3
2. Loading and Saving SBGN Models ... 3
2.1. Load an SBGN Model ... 3
2.2. Sample Models ... 3
2.3. Save as SBGN Model ... 4
2.4. Save as Image ... 4
2.5. Properties ... 4
3. Interacting with Current Model and Recalculating Layout ... 4
4. Filter ... 5 4.1. Hide Selected ... 5 4.2. Show Selected ... 6 4.3. Show All... 6 4.4. Delete Selected ... 6 5. Highlighting ... 7 5.1. Highlight Neighbors ... 7
5.2. Highlight Processes of Selected ... 7
5.3. Remove Highlights ... 8 6. Legends ... 8 7. Help ... 9 7.1 How to use... 9 7.2. About ... 9 References ... 10
1. Introduction
SBGNViz.js is a Cytoscape.js [1] based tool to visualize pathways represented in System Biology Graphical Notation (SBGN) [2] Process Description (PD) notation [3]. The tool has been developed as an extension to Cytoscape.js[1], an open-source JavaScript graph theory library for analysis and visualization which provides native browser support and allows to use in mobile devices.
In summary, SBGNViz.js comes with usual zoom-scroll and move capabilities inherited from Cytoscape.js. In addition, context sensitive filtering and highlighting capabilities are provided by the tool as described later. Unlike most other pathway visualization tools, SBGNViz.js has full support for compound structures (i.e., molecular complexes and compartments), handling them during interactive editing operations such as move.
Please cite [5] if you use SBGNViz.js.
2. Loading and Saving SBGN Models
2.1. Load an SBGN Model
You can load files that contain SBGN-PD graphs for visualization via the "Load…" button under the File menu. A file dialog will appear in order to upload the desired file.
2.2. Sample Models
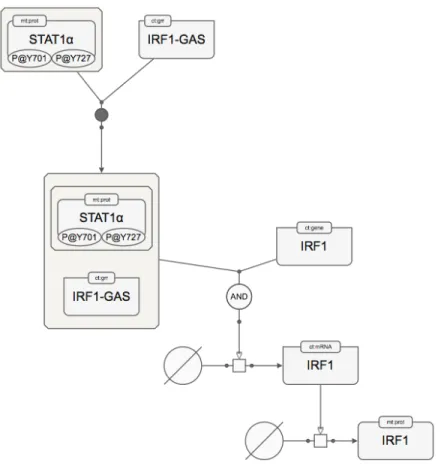
Figure 1 An example sample biological network in SBGN PD notation as rendered by SBGNViz.js
2.3. Save as SBGN Model
"Save…" button available under the File menu exports the current network (including both topology and geometry and applied filtering operations) in SBGN-ML format to a file on your computer.
2.4. Save as Image
"Save as Image" available under the File menu lets you export the current network visualized on the canvas to an image file. Currently only the PNG and JPG image formats are supported.
2.5. Properties
“Properties” available under the File menu lets the user modify properties of the maps being visualized such as padding/margins of compounds.
3. Interacting with Current Model and Recalculating Layout
SBGNViz.js provides standard visualization facilities such as zooming and scrolling and lets the user change the positions of map elements using dragging. When you right-click on a macro-molecule or a nucleic acid feature, detailed properties of the associated entity is displayed on a pop-up window as fetched from BioGene [4].
Figure 2 Sample screenshot illustrating how genes may be inspected for details [5]
Layout of the current map could also be re-calculated using “Perform Layout” under the Layout menu. The options available to user controlling the layout operation are exposed to the user through the “Layout Properties” dialog also available in this menu.
4. Filter
SBGNViz.js allows users to filter node group taking the context rules into consideration. User may show and hide specific processes, select an entity pool node and show every process it involves.
4.1. Hide Selected
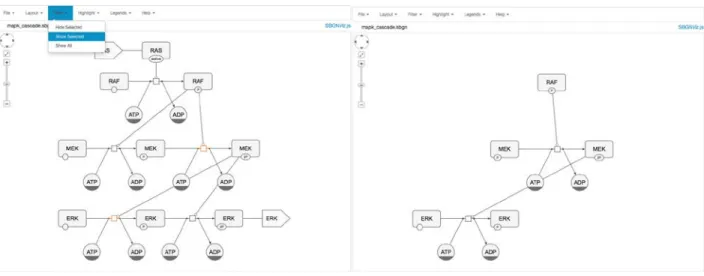
In case you're not interested in a certain node group, you may hide them from the current model by simply selecting them and hiding them using "Hide Selected" under the Filter menu.
Figure 3 Mapk cascade SBGN diagram and selected MEK macromolecule (left) and after hiding selected node by SBGNViz.js taking SBGN context into consideration (right)
4.2. Show Selected
In case you're only interested in a certain node group, you may only show them from the current model by simply selecting them and selecting "Show Selected" under the Filter menu.
Figure 4 Mapk cascade SBGN diagram and selected processes are orange (left) and after showing only selected node by SBGNViz.js taking SBGN context into consideration (right)
4.3. Show All
User can apply any filtering operations and then bring all nodes back in the graph by selecting Show all under Filter menu.
4.4. Delete Selected
5. Highlighting
5.1. Highlight Neighbors
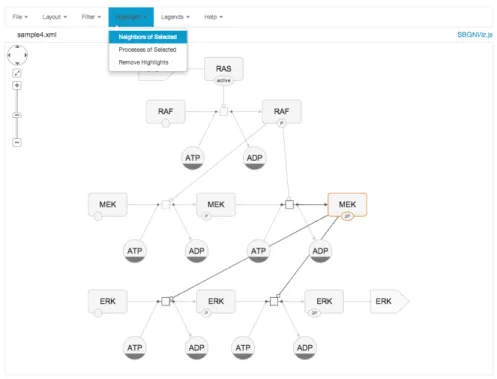
This operation highlights the neighbors of selected node group on the canvas.
Figure 5 A sample highlight of the neighbors of a simple molecule
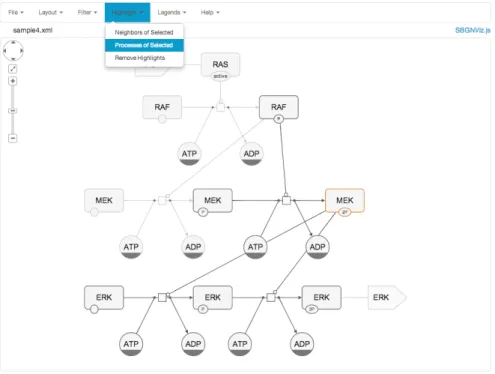
5.2. Highlight Processes of Selected
Figure 6 A sample highlight of the processes of selected; in this example selected simple molecule is involved in three processes, which are highlighted.
5.3. Remove Highlights
User can apply any Highlight operations and then remove any highlight in the graph by selecting Remove Highlights under Highlight menu.
6. Legends
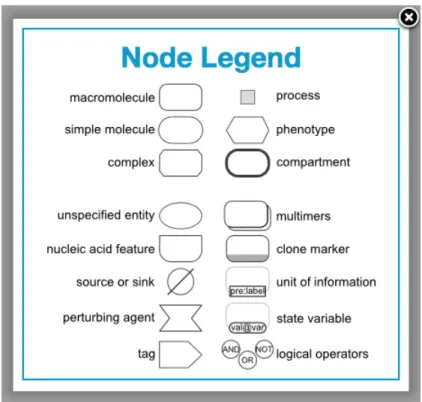
“Node Legend” under Legends menu opens a dialog that shows the node types supported by SBGN PD notation and how they are represented in SBGNViz.js.
Figure 7 Node legend for process description diagrams in SBGN
“Interaction Legend”, on the other hand, opens a new pop-up window that shows the interaction types supported by SBGN PD notation and how they are represented in SBGNViz.js.
Figure 8 Interaction legend for process description diagrams in SBGN
7. Help
7.1 How to use
This menu item opens a page on a new browser tab that includes the User Guide of SBGNViz.js (this document).
7.2. About
References
[1] Cytocape.js, http://cytoscape.github.io/cytoscape.js/
[2] Systems Biology Graphical Notation, http://www.sbgn.org/.
[3] SBGN Process Description Notation, http://www.sbgn.org/images/5/56/Sbgn_PD-level1-user-public.pdf.
[4] BioGene: an information tool for biological research, http://cbio.mskcc.org/biogene/. [5] M. Sari, I. Bahceci, U. Dogrusoz, S.O. Sumer, B.A. Aksoy, O. Babur, E. Demir, "SBGNViz: a tool for
visualization and complexity management of SBGN process description maps", PLoS ONE, 10(6),
![Figure 2 Sample screenshot illustrating how genes may be inspected for details [5]](https://thumb-us.123doks.com/thumbv2/123dok_us/10055409.2498277/5.918.177.756.110.632/figure-sample-screenshot-illustrating-genes-inspected-details.webp)