Graduate Theses, Dissertations, and Problem Reports 2018
Detection of Buried Non-Metallic (Plastic and FRP Composite)
Detection of Buried Non-Metallic (Plastic and FRP Composite)
Pipes Using GPR and IRT
Pipes Using GPR and IRT
Jonas KaviWest Virginia University, [email protected]
Follow this and additional works at: https://researchrepository.wvu.edu/etd
Part of the Civil Engineering Commons, Other Engineering Commons, and the Structural Materials Commons
Recommended Citation Recommended Citation
Kavi, Jonas, "Detection of Buried Non-Metallic (Plastic and FRP Composite) Pipes Using GPR and IRT" (2018). Graduate Theses, Dissertations, and Problem Reports. 3724.
https://researchrepository.wvu.edu/etd/3724
This Dissertation is protected by copyright and/or related rights. It has been brought to you by the The Research Repository @ WVU with permission from the rights-holder(s). You are free to use this Dissertation in any way that is permitted by the copyright and related rights legislation that applies to your use. For other uses you must obtain permission from the rights-holder(s) directly, unless additional rights are indicated by a Creative Commons license in the record and/ or on the work itself. This Dissertation has been accepted for inclusion in WVU Graduate Theses, Dissertations, and Problem Reports collection by an authorized administrator of The Research Repository @ WVU. For more information, please contact [email protected].
D
ETECTION OFB
URIEDN
ON-M
ETALLIC(P
LASTIC ANDFRP
C
OMPOSITE)
P
IPESU
SINGGPR
ANDIRT
Jonas Kavi
Dissertation submitted to the
Benjamin M. Statler College of Engineering and Mineral Resources at West Virginia University
in partial fulfillment of the requirements for the degree of
Doctor of Philosophy in
Civil Engineering
Udaya B. Halabe, Ph.D., P.E., Chair Hota V. S. GangaRao, Ph.D., P.E. Hema J. Siriwardane, Ph.D., P.E.
Radhey Sharma, Ph.D. Benjamin Dawson-Andoh, Ph.D.
Department of Civil and Environmental Engineering
Morgantown, West Virginia 2018
Keywords: Corrosion, Excavation Damage, Ground Penetrating Radar, GPR, Infrared Thermography, IRT, Pipelines, Oil and Gas, Fiber Reinforced Polymer, FRP, CFRP, GFRP,
Composites
A
BSTRACTD
ETECTION OFB
URIEDN
ON-M
ETALLIC(P
LASTIC ANDFRP
C
OMPOSITE)
P
IPESU
SINGGPR
ANDIRT
Jonas Kavi
Pipelines are crucial in transporting petroleum products, natural gas, and water from production facilities to consumers under high pressure and long service life. In addition to being the primary means of transporting water from treatment facilities to consumers, pipelines also account for the transportation of more than half of the 100 quadrillions Btu of energy commodities consumed in the United States annually. The important role played by energy pipelines in the US economy and standard of living of citizens requires that these assets be safely maintained and appropriately expanded to meet growing demand. Pipelines remain the safest means of transporting natural gas and petroleum products, nonetheless, the pipeline infrastructure in the US is facing major challenges, especially, corrosion of steel/metallic pipes and excavation damage of onshore pipelines (leading to oil spills, explosions, and deaths). Problems associated with corrosion of metallic pipelines can be avoided by using non-corrosive materials such as PVC (Polyvinyl Chloride) or other plastics for water, sewer, or low pressure gas lines and Glass Fiber Reinforced Polymer composite (GFRP) for transporting high-pressure oil and natural gas. But buried non-metallic pipelines such as GFRP and PVC material are not easily detectable using the conventional techniques employed by construction crews to detect buried metallic pipes, which can lead to increased excavation damage during building/construction and rehabilitation works.
This research investigated alternative strategies for making buried non-metallic pipes (CFRP, GFRP, and PVC) easily locatable using Ground Penetrating Radar (GPR). Pipe diameters up to 12" and buried with up to 4 ft. of soil cover were investigated. The findings of this study will help address the detection problem of non-metallic pipelines and speed the adoption of composite pipes by the petroleum and natural gas industry. The research also investigated the possibility of locating buried pipes transporting hot fluids using Infrared Thermography (IRT).
Results from the study have shown that, using carbon fabric and aluminum foil/tape overlay on non-metallic pipes (GFRP or PVC for this study) before burying significantly increases the reflected GPR signal amplitude, thereby making it easier to locate such pipelines using GPR. The reflected GPR signal amplitude for pipe sections with carbon fabric or aluminum foil overlays was
found to have increased by a factor of up to 4.52 times, and 2.02 times on average across all the pipe sections tested, from the baseline (unwrapped) pipe sections. The research also highlights the importance of using the correct antenna frequency for detecting buried pipes in wet soil conditions. Wet soils with high electrical conductivity and dielectric constants have higher radar signal attenuations that significantly affect the penetration depth and returned signal amplitudes from buried objects. A 200 MHz frequency antenna was found in this study to be ideal for locating the buried pipes in all soil moisture conditions. The 200 MHz antenna was able to detect buried pipes up to the maximum 4 ft. depth of soil cover that was studied experimentally. Numerical estimation using the same soil from the experiment shows that this antenna can penetrate up to a depth of at least 5.5 ft. in very wet clay soils with volumetric water content of 0.473.
After evaluating the attenuation characteristics of different radar antennae, it was found that material/ohmic attenuation is constant across a range of antenna frequencies; the increase in GPR signal attenuation associated with higher antenna frequencies was found to be a result of scattering attenuation from subsurface inhomogeneity/clutter. Scattering attenuation is however usually ignored in literature, resulting in erroneous estimation of radar signal attenuation.
Finally, laboratory study proved that, heat from a buried pipeline transporting hot fluid can propagate through the soil to the surface and be detected using IRT. Additionally, a 6" diameter steam pipe with a 6" minimum insulation and buried with 2.5 – 3 ft. of soil cover was easily detected in varying soil moisture conditions during different seasons throughout the year using IRT in the field environment. The successful application of IRT in detecting this pipe proves the potential for using this technique in locating buried pipes transporting hot fluids such as steam or petroleum products from production wells or refinery plants.
iv
A
CKNOWLEDGEMENTSI would like to express my sincere gratitude to my academic and research advisor, Dr. Udaya B. Halabe, for his guidance, support, and encouragement throughout my graduate studies. His extensive knowledge in the area of Nondestructive Evaluation of Civil Engineering infrastructure has been a great help for me during the M.S. and Ph.D. degree programs. I am thankful for the opportunity to work under Dr. Halabe, an experienced and knowledgeable faculty, and one of the best advisors in the department.
I would also like to thank Dr. Hota V. S. GangaRao, Dr. Hema J. Siriwardane, Dr. Radhey Sharma, and Dr. Benjamin Dawson-Andoh for serving as members on my Advisory and Examining Committee (AEC) and providing constructive feedback on my work. I am also grateful to Dr. Radhey Sharma for encouraging me to apply for the Chancellor’s Scholarship; Dr. Hota V. S. GangaRao for making his extensive knowledge in fiber composite materials and manufacturing accessible during this study; Dr. Siriwardane for allowing me to use the heating oven available in the Geotechnical laboratory for determining soil moisture content; and Dr. Benjamin Dawson-Andoh for his valuable advice on making the most out of graduate school and preparing for life after graduation.
I would like to express my appreciation to WVU-CFC Technician, Mr. Jerry Nestor, for helping me during the sample preparation and experimental setup stage of this research. I am also grateful to fellow graduate students, for their immense help during this journey; I am especially appreciative to Andrew Wheeler, Ruben Joshi, Praveen Majjigapu, Amir Houshmandyar, Piyush Soti, and Shabnam Khanal for providing assistance during this research.
Funding for this study was provided through the Competitive Academic Agreement Program from the Pipeline and Hazardous Materials Safety Administration (PHMSA) of US Department of Transportation (USDOT) under contract numbers DTPH5615HCAP09 and DTPH5616HCAP02. Support for the study was also provided by Creative Pultrusions, Inc. (CP) in providing the composite pipe materials for the study. I would like to thank USDOT-PHMSA and CP for providing the resources and the opportunity for me to work on this study. I would also like to thank West Virginia University Division of Diversity, Equity and Inclusion; the Department of Civil and Environmental Engineering; and NACE International/Appalachian Underground Corrosion Short Course (AUCSC) for awarding me the Chancellor’s Scholarship; Dianne D. Anderson Graduate Fellowship; and the AUCSC Scholarship respectively that enabled me to focus exclusively on my studies and research.
Finally, I am very grateful for my family and friends; their endless support, guidance and encouragement throughout this study made it a worthwhile journey.
v
T
ABLE OFC
ONTENTS Abstract…….. ... ii Acknowledgements ... iv Table of Contents ...v List of Figures ...xList of Tables. ... xviii
Nomenclature ... xix
Chapter 1: Introduction.. ...1
1.1 Background/Overview ... 1
1.2 Research Problem and Focus ... 5
1.3 Fiber Reinforced Polymer (FRP) Materials and why GFRP... 5
1.4 Research Objectives and Scope... 6
1.5 Research Significance ... 7
1.6 Research Collaboration ... 8
1.7 Organization ... 8
Chapter 2: State of the Pipeline Infrastructure ...10
2.1 Introduction ... 10
2.2 PHMSA Pipeline Incidents Causes ... 10
2.2.1 Corrosion... 11
2.2.2 Excavation Damage ... 13
2.2.3 Material/Weld/Equipment Failure ... 16
2.2.4 PHMSA Pipeline Incident Summary ... 18
vi
2.4 Conclusions ... 26
Chapter 3: Recent Advances in Non-Metallic Pipeline Detection ...27
3.1 Introduction ... 27
3.2 Buried Object Detection Techniques ... 27
3.2.1 Dowsing ... 27
3.2.2 Geomagnetic Surveying ... 28
3.2.3 Electromagnetic Induction (EMI) ... 29
3.2.4 Electrical/Surface Resistivity ... 29
3.2.5 Tracer Wires... 32
3.2.6 Infrared Thermography (IRT) ... 32
3.2.7 Ground Penetrating Radar (GPR) ... 33
3.2.8 Advantages and Limitations, and why GPR ... 34
3.3 Use of GPR in Buried Non-Metallic Object Detection ... 35
3.4 Challenges in Detecting Non-Metallic Objects ... 36
3.5 Conclusions ... 37
Chapter 4: Ground Penetrating Radar (GPR) Theory ...38
4.1 Introduction ... 38
4.2 Propagation Velocity ... 39
4.3 Signal Amplitude... 42
4.4 Loss Factor and Skin Depth ... 44
4.5 Transmission and Reflection ... 45
4.6 Dielectric Characteristics of Common Soil Materials ... 47
4.6.1 Dielectric Models ... 47
4.6.2 Inverse Models ... 52
vii
Chapter 5: GPR Equipment, Sensors, and Data Processing ...54
5.1 Introduction ... 54
5.2 GPR Equipment... 54
5.3 Soil Moisture and Electrical Conductivity Sensor ... 56
5.4 GPR Data Processing Techniques ... 57
5.4.1 Background Removal... 57
5.4.2 Peaks Extraction... 57
5.4.3 Horizontal Scaling ... 58
5.4.4 Amplitude Extraction ... 58
5.5 Conclusions ... 58
Chapter 6: Experimental Set Up for GPR Testing ...59
6.1 Introduction ... 59 6.2 Research Procedure ... 59 6.3 Pipe Preparation ... 60 6.3.1 PVC Pipes ... 60 6.3.2 GFRP Pipes ... 62 6.3.3 CFRP Pipes ... 64
6.3.4 Creating Dielectric Contrast Between Non-Metallic Pipes and Surrounding Soil . 65 6.4 Pipe Burying ... 68
6.5 Conclusions ... 75
Chapter 7: GPR Test Results and Data Analysis ...76
7.1 Introduction ... 76
7.2 GPR Test Results ... 76
7.2.1 900 MHz Antenna Data ... 77
viii
7.2.3 Dataset II ... 93
7.2.4 Dataset III... 100
7.2.5 Performance of Surface Configurations... 107
7.3 Determination of Depth ... 111
7.3.1 Depth Estimation Using Soil Dielectric Constant ... 111
7.3.2 Depth Estimation Using GPR Hyperbolic Fitting ... 112
7.3.3 Depth Estimation Using Common Mid-Point (CMP) Method ... 114
7.4 Conclusions ... 116
Chapter 8: Numerical Computations ...118
8.1 Introduction ... 118
8.2 Soil Dielectric Modelling ... 118
8.3 Inverse Dielectric Modelling ... 123
8.4 Signal Amplitude and Attenuation ... 127
8.5 Antenna Performance and Penetration Depth ... 133
8.6 Wave Velocity and Wavelength ... 137
8.7 Conclusions ... 138
Chapter 9: Infrared Thermography Testing and Results ...139
9.1 Introduction ... 139
9.2 IRT Test Equipment (Camera and Thermocouples) ... 139
9.3 Experimental Set-Up for IRT Testing ... 140
9.4 IRT Test Results ... 142
9.4.1 Pipe Operating /Heating Cycle ... 142
9.4.2 Pipe Cooling Cycle ... 148
9.5 Testing of Field Pipes ... 150
ix
Chapter 10: Conclusions and Recommendations ...158
10.1 Research Summary ... 158
10.2 Conclusions ... 159
10.3 Recommendations for Field Implementation and Future Study ... 162
10.3.1 Recommendations for Field Implementation ... 162
10.3.2 Recommendations for Future Study ... 163
References….. ...164
Appendix A: PHMSA Incident Definition and Criteria History ...174
Appendix B: Supplementary GPR Data ...176
B.1 Details of Pipes Identified in the 36 ft. Long Trench Using 400 MHz Antenna ... 177
B.2 Detailed Radar Profile for Features Marked in Figure 7-29(b) for Dataset II ... 180
B.3 Transverse GPR Scans over 36 ft. Long Trench Using 200 MHz Antenna ... 183
B.4 Transverse GPR Scans over 36 ft. Long Trench Using 400 MHz Antenna ... 185
x
L
IST OFF
IGURESFigure 1-1: (a) 2014 U.S. Primary energy consumption by source (EIA n.d.) and (b) crude oil and
petroleum product by transportation by mode in 2009 (USDOT 2017) ... 2
Figure 1-2: U.S. refinery receipts of crude oil by method of transportation (EIA n.d.) ... 2
Figure 1-3: U.S. Primary energy consumption by source (EIA n.d.) ... 3
Figure 1-4: Primary energy consumption by type, 1980-2040 (EIA 2015) ... 4
Figure 2-1: 20 year reported incident cause breakdown (1996-2015) ... 11
Figure 2-2: External surface of the failed pipeline section (PHMSA 2016e and 2016f) ... 12
Figure 2-3: Spilled crude oil from the rupture being cleaned (Nicholson 2015) ... 12
Figure 2-4: Corrosion products deposited on the pipe surface (PHMSA 2016f) ... 13
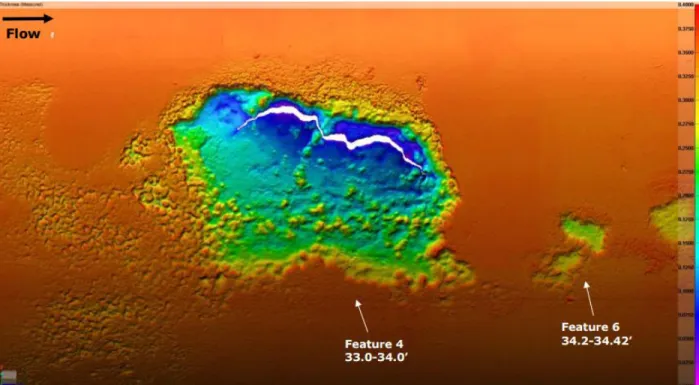
Figure 2-5: Laser scanning rendering of the failure location showing the remaining wall thickness (PHMSA 2016f) ... 13
Figure 2-6: Excavation damage explosion (DOT 2011) ... 15
Figure 2-7: Natural gas pipeline explosion from excavation damage (NTSB 2013) ... 16
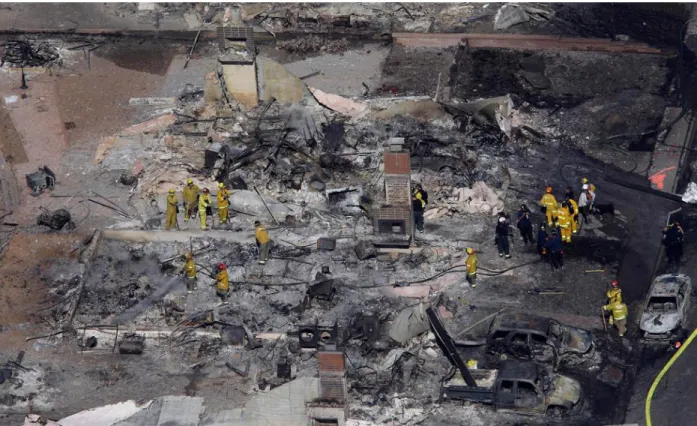
Figure 2-8: Aftermath of natural gas pipeline explosion in San Bruno, CA (SacBee 2010) ... 17
Figure 2-9: Details of the aftermath of natural gas pipeline explosion in San Bruno, CA ... 17
Figure 2-10: Category summary of PHMSA pipeline incidents ... 18
Figure 2-11: Number of reported incidents for each category by year ... 19
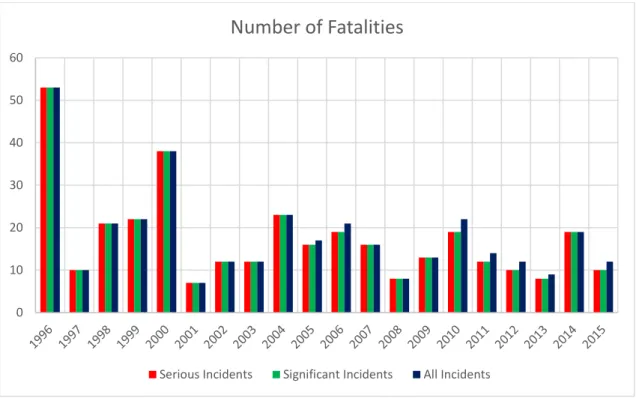
Figure 2-12: Number of fatalities reported for each category by year ... 20
Figure 2-13: Number of injuries reported for each category by year ... 20
Figure 2-14: Total cost reported for each category by year ... 21
xi
Figure 2-16: Casualties associated with different causes of pipeline failure ... 22
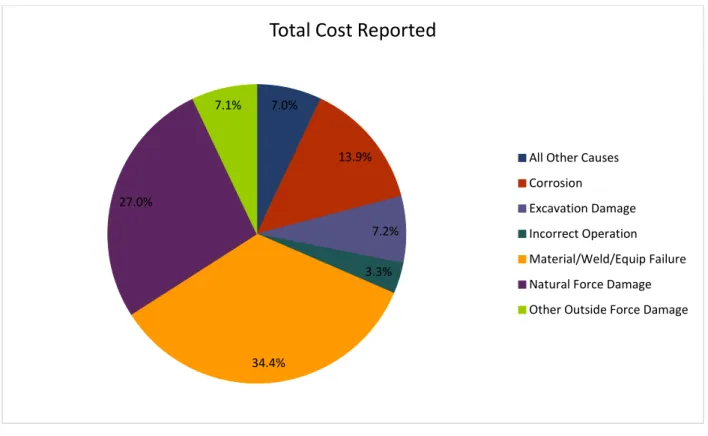
Figure 2-17: Total cost reported for each failure category over the last 20 years ... 23
Figure 2-18: Total cost reported for each failure category by year ... 23
Figure 2-19: Total barrels of hazardous liquid spilled per failure category ... 24
Figure 2-20: Net barrels of hazardous liquid lost per failure category... 24
Figure 2-21: Break rates of different pipe materials (Folkman 2018) ... 26
Figure 3-1: Electrical resistivity result for an underground mine (Sheets 2002) ... 30
Figure 3-2: GPR printout showing hyperbolic features from steel drums ... 35
Figure 3-3: GPR data from agricultural drainage pipes (Allred et al. 2004) ... 36
Figure 4-1: Propagation path of electromagnetic wave from transmitter to receiver... 38
Figure 4-2: Conditions under which the loss tangent << 1 ... 45
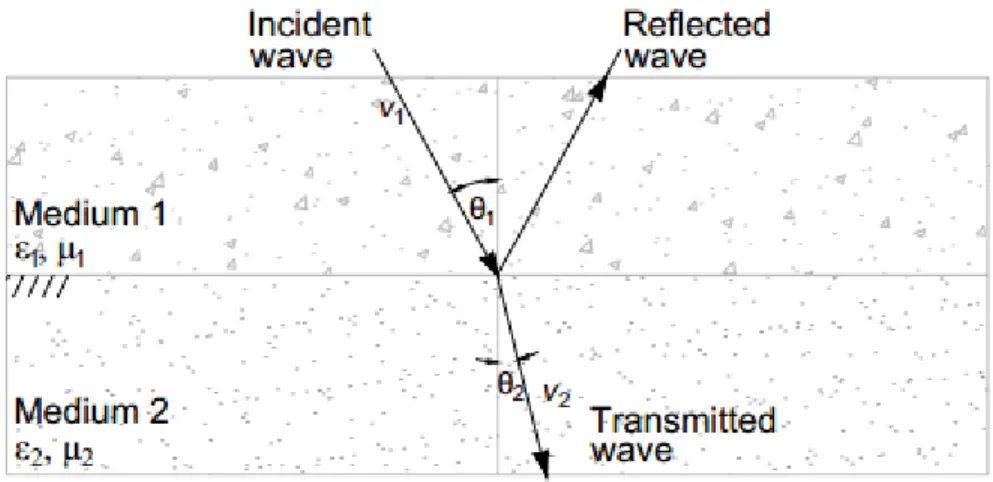
Figure 4-3: Reflection and transmission of incident electromagnetic wave at an interface ... 46
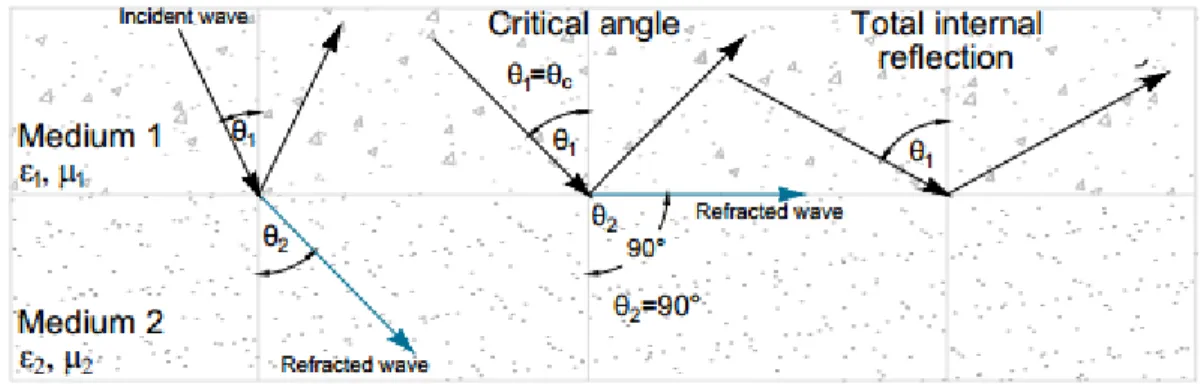
Figure 4-4: Refraction of incident electromagnetic wave at the interface between two media .. 47
Figure 4-5: Organic soil model by Roth et al. showing original and corrected fitted lines ... 50
Figure 5-1: SIR-20 GPR system and antennae used for testing ... 55
Figure 5-2: 200 MHz GPR antenna with survey wheel ... 55
Figure 5-3: Sensor for measuring soil moisture, conductivity, and dielectric ... 56
Figure 6-1: The 14' long 12" diameter PVC pipe being cut ... 61
Figure 6-2: The 12" diameter PVC pipe (a) after cutting, and (b) after capping ... 61
Figure 6-3: The 3" diameter PVC pipes ... 62
xii
Figure 6-5: Manufacturing a 3" diameter GFRP pipe... 64
Figure 6-6: 12" diameter CFRP pipe ... 65
Figure 6-7: The 3" diameter CFRP pipes ... 65
Figure 6-8: Pipe configurations: (a) 6" diameter PVC with carbon fabric rings, (b) 12" diameter PVC with carbon fabric strip, (c) 12" diameter GFRP with aluminum rings, and (d) 12" diameter GFRP with aluminum strip ... 67
Figure 6-9: 12" diameter GFRP pipe with carbon nanoparticle overlay ... 68
Figure 6-10: The site for pipe burying and monitoring (source: Google Maps) ... 69
Figure 6-11: The located site on WVU campus for pipe burying, with utility lines marked... 70
Figure 6-12: Pipe layout for GPR testing ... 71
Figure 6-13: Pipe layout for GPR testing (short trench) ... 72
Figure 6-14: (a) Arrangement of pipes in the trench, (b) soil moisture and resistivity sensor ... 72
Figure 6-15: (a) Soil sensors with data wires running through conduits to protect the wires, (b) 3" diameter pipes and sensors in the 27" deep trench ... 73
Figure 6-16: Pipe samples being buried ... 74
Figure 6-17: (a) The site being seeded, (b) the field restored to initial condition ... 74
Figure 7-1: Longitudinal scan over 3" diameter pipes at 2 ft. depth using 900 MHz antenna ... 77
Figure 7-2: Dataset I - Longitudinal scans over the pipe trenches using 200 MHz antenna ... 78
Figure 7-3: Longitudinal scan over the 3 ft. deep trench for Dataset I using 200 MHz antenna 79
Figure 7-4: Longitudinal scan over the 4 ft. deep trench for Dataset I using 200 MHz antenna 79
Figure 7-5: Longitudinal scan over the 2 ft. deep trench for Dataset I using 200 MHz antenna 80
xiii
Figure 7-7: Longitudinal scan over the 2 ft. deep trench for Dataset I using 400 MHz antenna 81
Figure 7-8: Longitudinal GPR scan (left) and A-Scan (right) over Unwrapped 12" GFRP pipe 83
Figure 7-9: Longitudinal GPR scan (left) and A-Scan (right) over 12" CFRP Ring GFRP pipe 83
Figure 7-10: Longitudinal GPR scan (left) and A-Scan (right) over 12" CFRP Strip GFRP pipe
... 84
Figure 7-11: Longitudinal GPR scan (left) and A-Scan (right) over 12" Unwrapped PVC pipe 84
Figure 7-12: Longitudinal GPR scan (left) and A-Scan (right) over 12" Al. Foil Ring PVC pipe
... 85
Figure 7-13: Longitudinal GPR scan (left) and A-Scan (right) over 12" Al. Foil Strip PVC pipe
... 85
Figure 7-14: Longitudinal GPR scan (left) and A-Scan (right) over 6" Unwrapped PVC pipe .. 86
Figure 7-15: Longitudinal GPR scan (left) and A-Scan (right) over 6" Al. Foil Ring PVC pipe 86
Figure 7-16: Longitudinal GPR scan (left) and A-Scan (right) over 6" Al. Foil Strip PVC pipe 87
Figure 7-17: Longitudinal GPR scan (left) and A-Scan (right) over 6" CFRP Ring PVC pipe .. 87
Figure 7-18: Longitudinal GPR scan (left) and A-Scan (right) over 6" CFRP Strip PVC pipe .. 88
Figure 7-19: Longitudinal GPR scan (left) and A-Scan (right) over 12" CFRP Strip GFRP pipe
... 90
Figure 7-20: Longitudinal GPR scan (left) and A-Scan (right) over Unwrapped 12" GFRP pipe
... 90
Figure 7-21: Longitudinal GPR scan (left) and A-Scan (right) over C. Nano p. 12" GFRP pipe 91
Figure 7-22: Longitudinal GPR scan (left) and A-Scan (right) over Al. Foil Strip 12" PVC pipe
xiv
Figure 7-23: Longitudinal GPR scan (left) and A-Scan (right) over Unwrapped 10" GFRP pipe
... 92
Figure 7-24: Longitudinal GPR scan (left) and A-Scan (right) over 12" Steel pipe ... 92
Figure 7-25: Dataset II - Longitudinal scans over the pipe trenches using 200 MHz antenna ... 95
Figure 7-26: Longitudinal scans over 3" diameter pipes at 2 ft. deep using 200 MHz antenna . 96 Figure 7-27: Longitudinal scan over 3" diameter pipes at 2 ft. deep using 400 MHz antenna ... 97
Figure 7-28: Longitudinal scans over 12" and 10" diameter pipes at 2 ft. deep using 400 MHz antenna ... 98
Figure 7-29: Reflection details marked on 12" and 10" diameter pipes with 2 ft. of soil cover .. 99
Figure 7-30: Dataset III - Longitudinal scans over the pipe trenches using 200 MHz antenna 101 Figure 7-31: Transverse scans over the pipes in 65 ft. long trenches using 200 MHz antenna for Dataset III ... 105
Figure 7-32: Transverse scans over the pipes in 36 ft. long trench using 200 MHz antenna for Dataset III ... 106
Figure 7-33: Comparison of returned radar signal amplitude from different pipe configurations ... 109
Figure 7-34: Comparison of returned radar signal amplitude from GFRP pipe configurations ... 110
Figure 7-35: Comparison of returned radar signal amplitude from PVC pipe configurations . 110 Figure 7-36: Circular reflector and associated hyperbolic feature ... 112
Figure 7-37: Velocity estimation using hyperbolic feature in GPR data (pipe 6"@3') ... 113
Figure 7-38: Common Mid-Point (CMP) technique ... 114
xv
Figure 7-40: The simplified Common Mid-Point (CMP) technique ... 115
Figure 8-1: Experimental dielectric constant versus VWC ... 121
Figure 8-2: Comparison between dielectric models and experimental data ... 121
Figure 8-3: Comparison between the three dielectric models and experimental data ... 123
Figure 8-4: Experimental VWC versus dielectric constant ... 124
Figure 8-5: Comparison between inverse dielectric models and experimental data ... 124
Figure 8-6: Comparison between the three inverse dielectric models and experimental data.. 126
Figure 8-7: Comparison between experimental data/model and secondary data and models .. 127
Figure 8-8: Variation of material attenuation coefficient with antenna frequency ... 129
Figure 8-9: Variation of material attenuation coefficient with lower antenna frequencies ... 129
Figure 8-10: Variation of components of attenuation with antenna frequency ... 132
Figure 8-11: Decay of signal amplitude with travel distance ... 133
Figure 8-12: Variation of attenuation coefficient for different soil types ... 134
Figure 8-13: Variation of skin depth with antenna frequency for different soil types ... 135
Figure 8-14: Estimated penetration depths for antennae in different soil types ... 136
Figure 9-1: FLIR InfraCAM SD camera and type-T thermocouple... 139
Figure 9-2: (a) Automated thermocouple reader and (b) Thermo Recorder ... 141
Figure 9-3: Insulated wooden box used for IRT testing ... 141
Figure 9-4: CFRP pipe for IRT testing (top), sketch showing thermocouple locations (bottom) ... 141
xvi
Figure 9-6: Infrared thermography data at the soil surface at various stages of testing ... 144
Figure 9-7: Variation of soil surface (TSC, IRT) and room (Amb) temperatures with time ... 145
Figure 9-8: Soil surface temperature difference with time ... 145
Figure 9-9: Difference between soil surface temperature and room temperature with depth ... 148
Figure 9-10: Variation of soil surface (TSC, IRT) and room (Amb) temperatures during cooling ... 149
Figure 9-11: Soil surface temperature difference with time during cooling... 149
Figure 9-12: Location of field IRT test pipe ... 150
Figure 9-13: Field IRT test pipe installation details (CJD 2015) ... 151
Figure 9-14: Comparison of IRT and visible image results ... 153
Figure 9-15: Infrared thermography data at the soil surface in different seasons ... 154
Figure 9-16: IRT data at the soil surface taken from close range in different seasons ... 155
Figure 9-17: Temperature distribution across each IRT data in Figure 9-16 ... 156
Figure B-1: Longitudinal scan over 12" CFRP Strip GFRP pipe: raw data (top), data with background noise removed (middle), and reflection peaks extracted from the data (bottom) ... 177
Figure B-2: Longitudinal scan over 12" Unwrapped GFRP pipe: raw data (top), data with background noise removed (middle), and reflection peaks extracted from the data (bottom) ... 178
Figure B-3: Longitudinal scan over 12" Al. Foil Strip PVC pipe: raw data (top), data with background noise removed (middle), and reflection peaks extracted from the data (bottom) ... 179
Figure B-4: Features A and A1 ... 180
Figure B-5: Features B and B1 ... 180
xvii
Figure B-7: Feature D ... 181
Figure B-8: Feature E ... 182
Figure B-9: Feature F ... 182
Figure B-10: Transverse scan over some of the pipes in 36 ft. long trench using 200 MHz GPR
antenna for Dataset I ... 183
Figure B-11: Transverse scan over some of the pipes in 36 ft. long trench using 200 MHz GPR
antenna for Dataset II ... 184
Figure B-12: Transverse scan over some of the pipes in 36 ft. long trench using 400 MHz GPR
antenna for Dataset II (raw data) ... 185
Figure B-13: Transverse scan over some of the pipes in 36 ft. long trench using 400 MHz GPR
antenna for Dataset II (data with background noise removed) ... 186
Figure C-1: Variation of test temperature with time of heating and cooling ... 188
Figure C-2: Top and bottom temperature difference of the pipe during heating and cooling .. 189
Figure C-3: Inlet and outlet temperature difference of the pipe during heating and cooling ... 190
xviii
L
IST OFT
ABLESTable 2-1: Corrosion, excavation damage and material failure contribution to pipe incidents .. 25
Table 3-1 Drillers’ descriptions of borings along resistivity survey line (Sheets 2002) ... 31
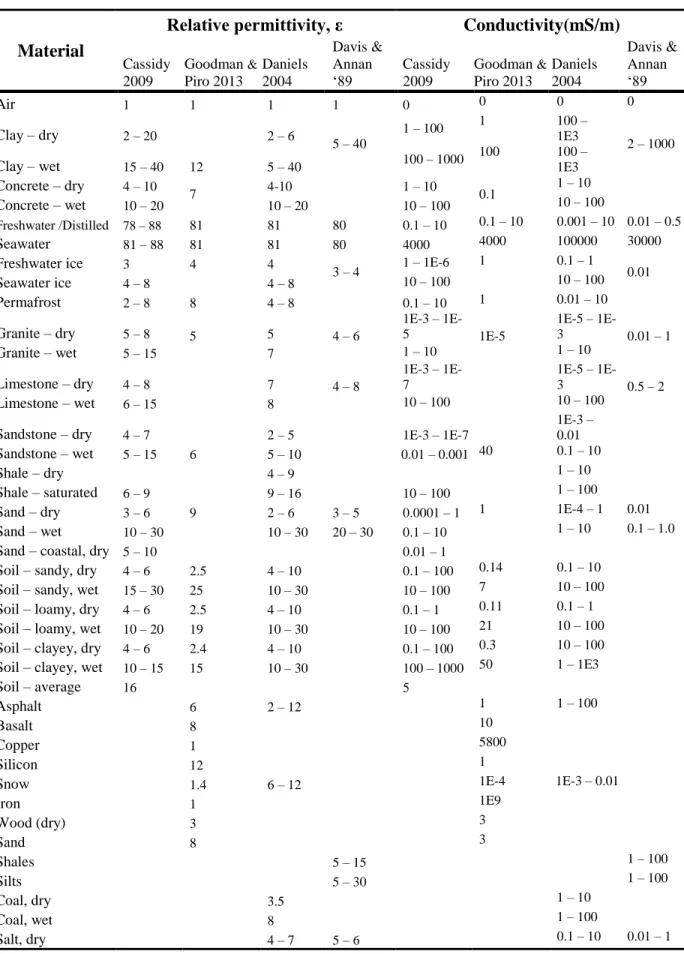
Table 4-1: Relative dielectric constants and conductivity of common subsurface materials ... 48
Table 5-1: GPR antenna specifications ... 56
Table 5-2: GS3 sensor specifications ... 57
Table 6-1: Material and section properties of CFRP and GFRP pipes/fabrics ... 63
Table 6-2: Summary of pipe samples and configurations ... 75
Table 7-1: Average soil dielectric properties during data collection ... 76
Table 7-2: Description of features marked in Figure 7-29 ... 99
Table 7-3: Target depth estimated using hyperbolic fitting ... 113
Table 8-1: Measured soil dielectric properties ... 120
Table 8-2: Dielectric models derived from experimental data ... 122
Table 8-3: Inverse dielectric models derived from experimental data ... 126
Table 8-4: Material attenuation values for the GPR datasets ... 128
Table 8-5: Material properties for scattering attenuation computation ... 130
Table 8-6: Components of total signal attenuation ... 130
Table 8-7: Remaining signal amplitude after two way travel to 4 ft. depth ... 133
Table 8-8: Phase coefficient and wavelength of the antennae used for GPR test ... 138
Table 9-1: Estimated variation of soil surface temperature with depth ... 147
xix
N
OMENCLATUREA number of labels, terms, and acronyms are frequently used in this document for brevity. These terms and acronyms may be ambiguous, or they may not be familiar to all readers. The definitions of terms and acronyms given below apply throughout this document.
AC: Alternating Current AC: Asbestos Cement
AEC: Advisory and Examining Committee Amb: Ambient/room temperature
ASCE: American Society of Civil Engineers
BI: Bottom Inlet temperature (inlet temperature measured at the bottom of the pipe) BO: Bottom Outlet temperature (outlet temperature measured at the bottom of the pipe)
CFRP: Carbon Fiber Reinforced Polymer
CI: Cast Iron
CIA: Central Intelligence Agency CMP: Common Mid-Point
CP: Condensate Pumped pipeline or Creative Pultrusions Inc.
CRIM: Complex Refractive Index Model
CSC: Concrete Steel Cylinder DC: Direct Current
DDB: Dortmund Data Bank DI: Ductile Iron
DOT: US Department of Transportation EIA: US Energy Information Administration EM: Electromagnetic
EMIS: Electromagnetic Induction Spectroscopy
ERT: Electrical Resistivity Tomography ESB: Engineering Sciences Building
FHWA: Federal Highway Administration
FRP: Fiber Reinforced Polymer
xx GPR: Ground Penetrating Radar
GSSI: Geophysical Survey Systems, Inc. HPS: High Pressure Steam
IRT: Infrared Thermography MRB: Mineral Resources Building
NACE: NACE International
NaCl: Sodium Chloride
NTSB: National Transportation Safety Board PRT: Personal Rapid Transit
PST: Pipeline Safety Trust PVC: Polyvinyl Chloride
R-Value: Relative insulating value (unit of ft2·°F·h/BTU) SCH: Schedule
SDR: Standard Dimension Ratio
TC: Temperature measured at the top of the pipe, midway between the inlet and the outlet TI: Top Inlet temperature (inlet temperature measured at the top of the pipe)
TO: Top Outlet temperature (outlet temperature measured at the top of the pipe) TSC: Temperature at top of the soil over mid portion of the pipe
USDOT: US Department of Transportation
USDOT-PHMSA/ PHMSA: Pipeline and Hazardous Materials Safety Administration
UAV: Unmanned Aerial Vehicle VWC: Volumetric Water Content WT: Water Temperature
1
C
HAPTER1
I
NTRODUCTION1.1 BACKGROUND/OVERVIEW
The pipeline industry in the United States (U.S.) is an important component of the nation’s economy, and essential in the standard of living of its citizens. Energy pipelines (pipelines used in transporting fuel/energy products) also play an important role in ensuring the security of the nation. The pipeline infrastructure is the primary means of transporting water, sewage, natural gas, petroleum products, and the majority of hazardous liquids from production basins, points of generation, and the ports to areas of consumption, storage, or disposal.
Best available data in 2015 indicates that, energy pipelines in the United States alone accounted for about 65% of the world’s energy pipeline network (CIA n.d.). The role played by pipelines in the United States cannot be overestimated; almost all natural gas in the United States and a greater portion of crude oil and petroleum products are transported by pipelines.
According to data available from the U.S. Energy Information Administration (EIA), the US consumes about 100 quadrillions Btu of energy annually. Natural gas accounts for 28% of the energy commodities consumed in the United States while petroleum products account for 35% (Figure 1-1a). Thus natural gas and petroleum products account for about 63% of the total energy consumption in the United States. Natural gas is almost entirely transported by pipelines while over 70% of crude oil and petroleum products are transported by pipelines (Figure 1-1b). It can therefore be concluded that, 53% of all energy commodities consumed in the United States are transported by pipelines. In addition, the percentage of crude oil/petroleum products transported by pipelines in the United States has been increasing since 2005, while the percentage transported by other modes of petroleum transport have decreased over the same period as shown in Figure 1-2 (EIA n.d., USDOT 2017).
Natural gas consumption in the U.S. has been on the ascendancy since 2005, while coal and petroleum product consumption has been decreasing over the same period, with total energy consumption remaining almost constant (Figure 1-3). The U.S. Energy Information
2
Administration’s projection of primary energy consumption by fuel type predicts the percentage of natural gas consumption to increase over the coming years (Figure 1-4). Energy pipelines are therefore going to play an increasingly important role in the U.S. energy commodity sector
(a) (b)
Figure 1-1: (a) 2014 U.S. Primary energy consumption by source (EIA n.d.) and (b) crude oil
and petroleum product by transportation by mode in 2009 (USDOT 2017)
Figure 1-2: U.S. refinery receipts of crude oil by method of transportation (EIA n.d.)
0 1,000,000 2,000,000 3,000,000 4,000,000 5,000,000 6,000,000 7,000,000 1980 1985 1990 1995 2000 2005 2010 2015 R e fi n e ry R e ce ip ts o f Cr u d e Oi l b y M e th o d o f Tr an sp o rtat io n (Th o u san d B ar re ls) Year
U.S. Refinery Receipts of Crude Oil by Method of Transportation
Total Crude Oil Pipeline Tanker Barge Tank Cars (Rails) Trucks Pipelines 70.2% Water Carriers 23.1% Motor Carriers 4.2% Railroads 2.6%
Crude Oil and Petroleum Product by Transportation Mode Coal 18.3% Gas 27.9% Petroleum 35.5% Nuclear 8.5% Hydro 2.5% Geotherm 0.2% Solar 0.4% Wind 1.8% Biomas4.9% U.S. Energy Commodity Consumption
3
Figure 1-3: U.S. Primary energy consumption by source (EIA n.d.)
0 10 20 30 40 50 60 70 80 90 100 1945 1950 1955 1960 1965 1970 1975 1980 1985 1990 1995 2000 2005 2010 Pr imary e n er gy c o n su mption ( Qu ad ri lli o n B tu ) Year
U. S. Primary Energy Consumption by Source
Coal Natural Gas Petroleum Nuclear
Hydroelectric Geothermal Solar Wind
4
Figure 1-4: Primary energy consumption by type, 1980-2040 (EIA 2015)
The importance of pipelines (particularly energy pipelines) “to the U.S. economy, [security,] and our standard of living requires that these assets be safely maintained and appropriately expanded to sustain demand.” (PHMSA 2015).
Pipelines remain the safest means of transporting natural gas, crude oil, and petroleum products, nonetheless, the pipeline industry is having major challenges; including corrosion of steel/metallic pipes (leading to oil spills, explosions, and deaths), excavation damage (damage to existing pipelines during excavation work), and pipeline material/weld/equipment failure as discussed in Chapter 2 of this document. These pipeline incidents often result in catastrophic failures, with associated fatalities, injuries, property loss, and environmental contamination. The Pipeline and Hazardous Materials Safety Administration (PHMSA), under U.S. Department of Transportation (USDOT), has identified corrosion as the leading cause of failure in metallic pipelines, and excavation damage as the leading cause of on shore pipeline incidents (PHMSA 2015).
5 1.2 RESEARCH PROBLEM AND FOCUS
The focus of this research is to work on a solution that can prevent excavation damage and pipe material failure for non-corrosive (non-metallic) pipes by making them detectable in-situ.
The problems associated with corrosion of steel/metallic pipelines, and to some extent pipe material failure, can be addressed by using non-corrosive materials such as the commonly available and widely used PVC (Polyvinyl Chloride) or other plastics for water, sewer, or low pressure gas lines and advanced composite materials such as Glass Fiber Reinforced Polymer (GFRP) for transporting high-pressure oil and natural gas products. However, buried PVC and GFRP materials are not easily detectable using the available ground sensory technologies, which can lead to increased excavation damage of pipelines during building/construction and rehabilitation works. Tracer wires are employed in some applications to make non-metallic pipelines locatable, but these wires can break over time and render the pipeline difficult to locate. The inability to easily locate buried GFRP and other non-metallic pipes has limited the adoption of such pipe materials in the oil and gas industry. Making these pipe materials detectable when buried will therefore help accelerate their adoption, and hence provide solutions to the corrosion related pipeline failure incidents as well.
1.3 FIBER REINFORCED POLYMER (FRP)MATERIALS AND WHY GFRP
Fiber Reinforced Polymer (FRP) composite has emerged as alternative material in many industries due to its better engineering properties that are desirable to manufacturers and infrastructure developers. FRPs generally have high specific strength, high specific modulus, low specific weight, high resistance to corrosion, high fatigue strength, and low coefficient of thermal expansion compared to conventional materials like steel. FRPs (particularly Carbon Fiber Reinforced Polymers – CFRP and Glass Fiber Reinforced Polymers – GPRP) are increasingly being used in infrastructure development applications – both for new constructions and rehabilitation of aging infrastructure (Kavi 2015, GangaRao et al. 2007, Mallick 2007) – with tremendous benefits. There is therefore a great potential for fiber composite material application in the pipeline transportation industry (Rawls 2015). GFRP is less expensive compared to CFRP, hence GFRP is used more in infrastructure development application.
6 1.4 RESEARCH OBJECTIVES AND SCOPE
To help address some of the major challenges associated with transportation by pipelines, this research is focused on investigating alternative strategies for making buried non-metallic pipelines easily detectable using available ground sensory technologies – Ground Penetrating Radar (GPR) and Infrared Thermography (IRT). The primary objectives of this research are as follows:
1. Develop, investigate, and compare alternative strategies for locating buried pipelines created with Fiber Reinforced Polymer (FRP) materials – particularly Carbon and Glass fibers (CFRP and GFRP).
2. Investigate the potential and feasibility for using CFRP fabric, carbon nanoparticle, or aluminum overlay to increase the detectability of GFRP and PVC (plastic) pipes with Ground Penetrating Radar (GPR).
3. Investigate and compare the detectability of the above pipes using GPR with antennas of different frequencies.
4. Investigate the possibility of detecting buried pipe transporting hot liquid, using Infrared Thermography (IRT).
5. Evaluate the above strategies for making non-metallic pipelines detectable using ground sensory technologies, and recommend the most appropriate configuration to be used in the pipeline industry in order to increase the detectability of buried non-metallic pipes in the field.
The above research objectives were achieved by:
1. Producing sample CFRP pipes by wrapping carbon fabric around cardboard tubes.
2. Using CFRP fabric, carbon nanoparticle, or aluminum overlay for GFRP and PVC (plastic) pipes to increase detectability by GPR. This setup includes the following pipe configurations:
i. Use CFRP fabric overlay in the form of strips or rings on GFRP and PVC pipes. ii. Use aluminum foil/tape overlay in the form of strips or rings on GFRP and PVC pipes. iii. Use multiple pipe diameters for both pipe materials (GFRP and PVC).
7
3. Burying variations of the above pipes (including different pipe materials, diameters, pipe surface configurations, and different depth of soil cover over the buried pipes) for GPR investigation.
4. Using GPR with different antenna frequencies to investigate and compare the detectability of the buried pipes.
5. Burying a CFRP pipe in a wooden box filled with soil and pumping hot water through it over a 10 day period, while the soil surface temperature variation is recorded using Infrared Thermography (IRT) and thermocouples.
6. Finally, results obtained from the above strategies were compared and the most promising configuration and test setting/parameters for making non-metallic pipelines detectable in the field using ground sensory technologies has been recommended for possible future implementation in the pipeline industry.
1.5 RESEARCH SIGNIFICANCE
Advanced non-metallic composite pipe materials such as Glass Fiber Reinforced Polymer (GFRP) have desirable engineering and mechanical properties that can help address some of the challenges encountered in the pipeline transportation industry. However, limitations such as difficulty in locating buried GFRP pipes are preventing the adoption of such materials in the pipeline industry. This research has the potential of having a significant impact on the pipeline industry. First, it will prevent corrosion related pipeline failures by aiding the adoption of alternative non-corrosive material for pipeline fabrication. In the case of GFRP pipes with carbon fabric, carbon nanoparticle, or aluminum foil overlays, this will provide an advanced material with better engineering and desirable properties such as low density, high specific strength and high specific modulus. Additionally, these alternative and advanced materials will be detectable in buried state using GPR and/or IRT, thereby preventing excavation damage of pipelines. Finally, the advanced materials with better engineering properties will significantly reduce the pipeline failure incidents caused by material damage.
Since corrosion, excavation damage, and material failure are the major causes of all pipeline incidents reported to PHMSA (see Section 2-2), this research – and its subsequent implementation by industry stakeholders – will significantly reduce pipeline failures, and minimize the associated
8
negative impact of such failures. This research focusing on detection of buried non-metallic pipes will therefore play a crucial role in making the pipeline transportation infrastructure sound, durable, environmentally friendlier, safer, and more cost effective while minimizing leakage over its service life.
1.6 RESEARCH COLLABORATION
This research involves collaboration with other institutions, including the funding and feedback on industry needs from U.S. Department of Transportation – Pipeline and Hazardous Materials Safety Administration (USDOT-PHMSA), and supply of composite pipes from a composite manufacturer (Creative Pultrusions, Inc.) to enhance the implementation of the proposed research. This collaboration also includes public debriefing of the research findings to industry stakeholders which can help in future implementation of the findings of this research project in the pipeline industry.
1.7 ORGANIZATION
A brief overview of the organization of this dissertation is as follows:
Chapter 1
o This chapter gives the background and outlines the objectives of this research.
Chapter 2
o This chapter provides a review of the current state of the pipeline infrastructure in the US. It provides summary of major challenges facing the pipeline industry, as well as some of the major pipeline incidents in recent times. Pipeline incident issues such as cause of failure, cost, injuries, fatalities, and environmental impact are discussed.
Chapter 3
o This chapter reviews the most commonly used buried object detection techniques, and also discusses recent advances in buried non-metallic pipeline detection. Particularly, the use of ground penetrating radar, its advantages and limitations are discussed.
Chapter 4
o The theory of ground penetrating radar and the specific concepts and parameters that apply to the current study are presented in this chapter.
9
Chapter 5
o Ground penetrating radar equipment, sensors, and data processing techniques used in this study are presented/discussed in this chapter
Chapter 6
o This chapter presents the experimental set up for GPR testing. Materials used for the research, sample preparation steps, and the various test samples are discussed in detail.
Chapter 7
o Ground penetrating radar testing of the buried pipe samples, test data, data processing, detailed result interpretation are provided in this chapter.
Chapter 8
o Numerical models that help estimate soil dielectric properties from the volumetric water content or dielectric constant are presented. Also, computations that help explain the performance and penetration depths of different GPR antennae used in the study is presented in this chapter.
Chapter 9
o This chapter investigates the potential for detecting buried pipelines transporting hot fluids by using infrared thermography. Infrared thermography test set up, tests, results, and data interpretation are presented in this chapter.
Chapter 10
o A summary of the scope of work conducted to fulfill the proposed research objectives, and the key findings are highlighted in this chapter. Finally, the chapter provides recommendations for field implementation of the research results as well as recommendations for future work in this area.
10
C
HAPTER2
S
TATE OF THEP
IPELINEI
NFRASTRUCTURE2.1 INTRODUCTION
While pipelines remain the safest means of transporting hazardous materials, there still exists significant room for improvement. In addition, increasing demand for these materials in homes and industries coupled with increasing production output require that the necessary transportation infrastructure be expanded and appropriately maintained to serve the need (Vealey 2016, PHMSA 2015). This chapter reviews some of the recent pipeline incidents that call for more efforts and resources to be put in making the pipeline infrastructure safer than it has been.
2.2 PHMSAPIPELINE INCIDENTS CAUSES
Over the past 20 years (1996-2015), there have been a total of 11,192 pipeline incidents reported to the PHMSA1. Out of this total, 5,663 fall under significant2 incidents, while 862 fall under the serious3 incidents category. PHMSA broadly groups pipeline incidents under seven (7) main categories (corrosion, excavation damage, incorrect operation, material/weld/equipment failure, natural force damage, other outside force damage, and all other causes) based on the reported cause of the incident. These failure causes are further broken down into different sub-categories, with material/weld/equipment failure having the highest number of sub-categories.
Corrosion, excavation damage and material/weld/equipment failure are the three main leading causes of pipeline incidents in the United States, contributing to 66% of all energy pipeline failures (Figure 2-1). The following sub-sections look at these three causes of pipeline failure.
1 Data for all the charts/plots and tables in this chapter are obtained from the PHMSA Pipeline Incident 20 Year
Trends, unless otherwise referenced. Links to these data are provided in the reference section as PHMSA 2016a, PHMSA 2016b, PHMSA 2016c, and PHMSA 2016d.
2 PHMSA defines Serious Incidents as those including a fatality or injury requiring in-patient hospitalization. 3 PHMSA defines Significant Incident as those including any of the following conditions: (1) Fatality or injury
requiring in-patient hospitalization; (2) $50,000 or more in total costs, measured in 1984 dollars; (3) Liquid releases resulting in an unintentional fire or explosion (PHMSA 2016a). Details of PHMSA incident definitions are in Appendix A.
11
Figure 2-1: 20 year reported incident cause breakdown (1996-2015)
2.2.1 Corrosion
Corrosion is one of the leading causes of failures in oil, gas, and hazardous liquid transportation pipelines (both onshore and offshore) in the United States. It is also a threat to oil and gas gathering systems, as well as water and sewage transportation/distribution pipelines and systems.
NACE International (NACE) and the U.S. Federal Highway Administration (FHWA) currently estimate the total direct cost associated with corrosion in the U.S. to be $276 billion (in 1998 dollars). Corrosion of gas and liquid transmission pipelines represents $7 billion of this total. Gas distribution accounts for $5 billion, while drinking water and sewage systems represents $36 billion. This results in a total direct corrosion cost of $48 billion associated with transportation pipelines. If indirect costs associated with corrosion are added, the above amount doubles to $96 billion per year – in 1998 dollars (Koch et al. 2002, Baker 2008).
Corrosion of pipelines has directly resulted in major pipeline incidents/failures in recent history, resulting in fatalities and injuries to industry personnel and the general public, as well as financial losses. These pipeline failures also result in environmental contamination, with significant impact on terrestrial and aquatic life.
11.6% 18.2% 16.1% 7.9% 31.7% 6.5% 8.1%
All Reported Incidents
All Other Causes Corrosion
Excavation Damage Incorrect Operation Material/Weld/Equip Failure Natural Force Damage Other Outside Force Damage
12
On May 19 2015, a 24-inch diameter pipeline operated by Plains Pipeline, LP ruptured in Santa Barbara County, California. This incident, which is as a result of external corrosion of a pipeline section (Figure 2-2), resulted in the release of about 2,934 barrels of heavy crude oil that contaminated the surrounding areas and beaches. An estimated 500 barrels of crude oil entered the Pacific Ocean. (Figure 2-3). A total cost of $143 million was reported for the incident (PHMSA 2016e and 2016f). Figures 2-4 and 2-5 show corrosion products deposited on the pipe surface and laser scan rendering of the failure surface respectively.
(b) The failed pipe with surrounding
insulation and coating
(b) The failed with surrounding insulation and coating removed
Figure 2-2: External surface of the failed pipeline section (PHMSA 2016e and 2016f)
(b) Clean-up at the rupture site (b) Clean-up at a contaminated beach
13
Figure 2-4: Corrosion products deposited on the pipe surface (PHMSA 2016f)
Figure 2-5: Laser scanning rendering of the failure location showing the remaining wall
thickness (PHMSA 2016f)
2.2.2 Excavation Damage
According to the U.S. Department of Transportation’s Pipeline and Hazardous Materials Safety Administration (PHMSA), “One of the greatest challenges to safe pipeline operations is accidental damage to the pipe or its coating that is caused by someone inadvertently digging into a buried pipeline.” (PHMSA 2014a) Data available from PHMSA indicates that, excavation damage has
14
accounted for over 20% of all significant natural gas and hazardous liquid pipeline incidents over the past 20 years. About one-third (33%) of all serious pipeline incidents were caused by excavation damage over the same time period. On gas distribution systems, excavation damage is the leading cause of failure; it accounted for more than 36% of all significant pipeline incidents and more than 34% of all serious pipeline incidents, this is substantially greater than any other cause of pipeline failure. Excavation damage also accounted for over 32% of all serious incidents in both gas transmission and hazardous liquid pipelines since 1996, making it the number one cause of failure on those pipeline systems. Of all causes of pipeline failure, fatalities and injuries are most likely to occur with excavation damage (see Figure 2-16 in Section 2.2.4). Thus excavation damage is a major cause (second leading cause) in significant pipeline incidents and the leading cause of serious pipeline incidents, resulting in many deaths and injuries, as well as substantial property damage.
In addition to fatalities, injuries, and property damage, pipeline incidents caused by excavation damage also result in significant costs, environmental damages/contaminations, and unintentional fire or explosions (PHMSA 2017, PST 2015). Excavation damage mostly results in immediate pipeline failure due to line hits with excavation equipment; however, there have been failures that resulted from mechanical damage inflicted on the pipeline from previous excavation damage (Baker 2009). In the delayed failure mode, damage to pipeline coating can allow accelerated corrosion to occur; a combination of the resulting corrosion and the physical damage to the pipe material from any accompanying dents or scrapes can result in increased potential for future failure. “Unreported mechanical damage can have serious consequences” (Baker 2009), as was the case of the Edison, New Jersey, and Bellingham, Washington natural gas and gasoline explosions respectively (Baker 2009). According to the Pipeline Safety Trust (PST), “The threat from excavation damage is larger then [sic] the PHMSA data implies” (PST 2015).
Excavation/mechanical damage of pipelines can be caused by any of the typical forms of excavation including digging, grading, trenching, boring, etc. These activities are usually undertaken during highway maintenance, general construction, and many farming activities, as well as new home construction and routine homeowner activities (PHMSA 2014a). For this reason, PHMSA, pipeline industry stakeholders, regulators and safety advocates/organizations encourage anyone planning an excavation work to make the required “One-Call” (call 811) before digging.
15
This enables pipeline/utility owners and operators to locate and mark all buried facilities (including pipelines) around the site before the excavation activity to prevent accidents related to excavation damage. Figures 2-6 and 2-7 show some of the recent pipeline incidents that resulted from excavation damage in Thomson, GA and Cleburne, TX respectively in 2010.
16
(a) Natural gas burning from 36" diameter pipeline (b) Ruptured section of the pipeline
Figure 2-7: Natural gas pipeline explosion from excavation damage (NTSB 2013)
2.2.3 Material/Weld/Equipment Failure
Pipeline incidents attributed to material, weld, or equipment failure tend to be broad, with many sub-categories of cause of failure. Some of these sub-categories are attributed to defective material manufacturing and/or fabrication process, inadequate construction and installation methods and technologies used. Majorities of pipeline incidents in this category are as a result of fitting/equipment failure and joints/welds failure.
Of all failures in the PHMSA pipeline incident database, failures caused by material/weld/ equipment failure are the most common. Failures under this category have the highest total reported cost of all pipeline incidents between 1996 and 2015 (the cost is particularly influenced by the San Bruno explosion in 2010, which resulted in over $558 million in reported cost). The devastating impact of the San Bruno natural gas pipeline incident is illustrated by Figures 2-8 and 2-9.
17
Figure 2-8: Aftermath of natural gas pipeline explosion in San Bruno, CA (SacBee 2010)
(a) A massive fire in San Bruno, CA (b) Picture of a burned car in front of several (SacBee 2010) destroyed houses (NTSB 2011)
18
2.2.4 PHMSA Pipeline Incident Summary
An analysis of the pipeline incidents reported to the PHMSA between 1996 and 2015 indicates that, out of the total 11,192 incidents, 51% (5,663) fell under significant incidents while only 8% (862) fell under serious incidents (Figure 2-10). However, serious incidents (and hence significant incidents) accounted for almost all of the fatalities and injuries reported – 96% and 98% respectively. When it comes to the total reported cost associated with these incidents, significant incidents accounted for 97% even though it was only about half of the number of reported incidents, while serious incidents contributed a smaller share of 11% as shown in Figure 2-10. Figures 2-11 through 2-14 show details of these parameters according to the year of report. In 2002, PHMSA changed the definition for a reportable hazardous liquid incident from “Loss of 50 or more barrels (8 or more cubic meters) of hazardous liquid or carbon dioxide” to “Release of 5 gallons (19 liters) or more of hazardous liquid or carbon dioxide” (PHMSA 2014b). This resulted in sharp increase in “All Incidents” shown in Figure 2-11. This change however did not affect the significant and serious incidents reported. It is further observed from Figures 2-12 and 2-13 that, serious incidents (and hence significant incidents) accounted for 100% of fatalities and injuries in most years, while significant incidents accounted for almost all of the reported cost (Figure 2-14).
Figure 2-10: Category summary of PHMSA pipeline incidents
0 10 20 30 40 50 60 70 80 90 100
No. of Incidents No. of Fatalities No. of Injuries Total Reported Cost 8 96 98 11 51 96 98 97 100 100 100 100 Perc en ta ge o f To ta l Re p o rted In ciden ts (% ) Incident Parameter
PHMSA Incident Summary
19
(a) Line plot of reported incidents
(b) Bar plot of reported incidents
Figure 2-11: Number of reported incidents for each category by year
0 100 200 300 400 500 600 700 800 1995 1997 1999 2001 2003 2005 2007 2009 2011 2013 2015
Number of Incidents
Serious Incidents Significant Incidents All Incidents
0 100 200 300 400 500 600 700 800
Number of Incidents
20
Figure 2-12: Number of fatalities reported for each category by year
Figure 2-13: Number of injuries reported for each category by year
0 10 20 30 40 50 60
Number of Fatalities
Serious Incidents Significant Incidents All Incidents
0 20 40 60 80 100 120 140
Number of Injuries
21
Figure 2-14: Total cost reported for each category by year
As has already been shown in Figure 2-1 and reproduced here (in Figures 2-15) for easy reference, and in Figure 2-16 below, the reported pipeline incidents are mostly dominated by corrosion, excavation damage, and material/weld/equipment failure: while excavation damage is the leading cause of injuries and fatalities in pipeline incidents.
Figure 2-15: Percentage of pipeline incidents caused by different categories
$200,000,000 $400,000,000 $600,000,000 $800,000,000 $1,000,000,000 $1,200,000,000 $1,400,000,000 $1,600,000,000
Total Cost Reported
Serious Incidents Significant Incidents All Incidents
11.6% 18.2% 16.1% 7.9% 31.7% 6.5% 8.1%
All Reported Incidents
All Other Causes Corrosion
Excavation Damage Incorrect Operation Material/Weld/Equip Failure Natural Force Damage Other Outside Force Damage
22
Figure 2-16: Casualties associated with different causes of pipeline failure
Pipeline incidents caused by material/weld/equipment failures are the most expensive, accounting for 34.4% of total reported cost over the past 20 years (Figure 2-17). This is closely followed by natural force damage, which accounted for 27.0% of the total reported cost. As shown in Figure 2-18, these two leading categories were greatly influenced by the pipeline incidents in 2005 and 2010 for natural force damage and material/weld/equipment failures respectively. The high cost reported for material/weld/equipment failure in 2010 was predominantly caused by two major incidents - the Pacific Gas and Electric Company natural gas transmission pipeline explosion in San Bruno, California (NTSB 2011); and the Enbridge Incorporated hazardous liquid pipeline rupture in Marshall, Michigan (NTSB 2012). These two incidents resulted in 84% of the total reported cost for 2010, and 21% of the 20 year total cost. On the other hand, the cost reported for natural force damage in 2005 was from a series of pipeline failures caused by heavy rains/floods, high winds, and earth movements – mostly in the outer continental shelf – which made up 81% of total reported cost for 2005 and 15% of the 20 year total cost shown in Figure 2-17. Corrosion of pipelines also contributed significantly to the total cost, accounting for 13.9% over the same 20 year period. 50 100 150 200 250 300 350 400 450 Fatalities Injuries 25% 91 21% 295 6% 22 5% 71 38% 138 32% 447 5% 18 11% 150 6% 20 10% 142 6% 20 8% 116 14% 51 11% 157 N u m b er o f Casua ltie s
Fatalities and Injuries Associated with Pipeline Failure Causes
All Other Causes Corrosion Excavation Damage Incorrect Operation Material/Weld/Equip Failure Natural Force Damage Other Outside Force Damage
23
Figure 2-17: Total cost reported for each failure category over the last 20 years
Figure 2-18: Total cost reported for each failure category by year
7.0% 13.9% 7.2% 3.3% 34.4% 27.0% 7.1%
Total Cost Reported
All Other Causes Corrosion
Excavation Damage Incorrect Operation Material/Weld/Equip Failure Natural Force Damage Other Outside Force Damage
$200,000,000 $400,000,000 $600,000,000 $800,000,000 $1,000,000,000 $1,200,000,000 $1,400,000,000 $1,600,000,000
Total Cost Reported
All Other Causes Corrosion Excavation Damage Incorrect Operation Material/Weld/Equip Failure Natural Force Damage Other Outside Force Damage
24
Similarly, corrosion, excavation damage and material/weld/equipment failure accounted for the top three highest percentages of total barrels of hazardous liquid4 spilled and net barrels lost (Figures 2-19 and 2-20).
Figure 2-19: Total barrels of hazardous liquid spilled per failure category
Figure 2-20: Net barrels of hazardous liquid lost per failure category
4 “Barrel data appears only for Hazardous Liquid incidents. Net Barrels Lost is the difference between Total Barrels
Released and Barrels Recovered” (PHMSA 2016b, 2016c, 2016d).
11.9% 20.5% 19.6% 5.9% 29.3% 7.9% 4.8%
Barrels Spilled
All Other Causes Corrosion
Excavation Damage Incorrect Operation Material/Weld/Equip Failure Natural Force Damage Other Outside Force Damage
8.5% 15.9% 25.0% 3.9% 32.6% 7.5% 6.6%
Net Barrels Lost
All Other Causes Corrosion
Excavation Damage Incorrect Operation Material/Weld/Equip Failure Natural Force Damage Other Outside Force Damage
25
Since this study seeks to make significant impact in preventing pipeline incidents caused by corrosion, excavation damage and pipe material failure (these have also been identified as the top three leading causes of pipeline failure), a summary of how the above categories affect the overall pipeline industry in terms of failure losses is given in Table 2-1.
Table 2-1: Corrosion, excavation damage and material failure contribution to pipe incidents
Cause of Failure No. of
Incidents Fatalities Injuries Cost
Barrels Spilled Barrels Lost Corrosion 18.2 % 6.1 % 5.2 % 13.9 % 20.5 % 15.9 % Excavation Damage 16.1 % 38.2 % 32.4 % 7.2 % 19.6 % 25.0 % Material/Weld/Equip Failure 31.7 % 5.5 % 10.3 % 34.4 % 29.3 % 32.6 % Total 66.0 % 49.8 % 47.9 % 55.5 % 69.4 % 73.5 %
2.3 WATER AND SEWAGE PIPELINES
Though water and sewage pipeline incidents do not frequently result in immediate fatalities and injuries as hazardous or energy pipelines, these incidents have serious consequences on the lives of people. Some of the recent water and sewage pipeline incidents resulted from corrosion of metallic pipelines and aging infrastructure. This leads to water main breaks resulting in loss of treated water and/or contamination of water delivered to consumers. The America Society of Civil Engineers graded the aging water infrastructure a D, with an estimated 240,000 water main breaks per year and loss of about “six billion gallons of treated drinking water” (ASCE 2017) each day. A study on water main breaks found corrosion to be a major cause of these breaks. In the same study, PVC pipes were found to have the lowest break rate of all pipe materials evaluated (Folkman 2018). Figure 2-21 shows comparison of failure rate of the different pipe materials. Making buried PVC pipes easily locatable and increasing their adoption rate in the water and sewage infrastructure will help reduce water main breaks.
26
Figure 2-21: Break rates of different pipe materials (Folkman 2018)
2.4 CONCLUSIONS
This chapter reviewed the current state of the pipeline infrastructure in the US. The challenges discussed and the necessity for a sound infrastructure to serve pipeline transportation needs require significant investment into infrastructure development, monitoring and maintenance. The remainder of this dissertation will explore ways to aid in this process by making advanced materials for building resilient pipelines locatable in-situ.
27
C
HAPTER3
R
ECENTA
DVANCES INN
ON-M
ETALLICP
IPELINED
ETECTION3.1 INTRODUCTION
Subsurface object/feature detection has been a subject of interest in many fields of study for several centuries now. From the use of dowsing rods in the early ~1400s (Hansen 1982) for locating underground water, to the utilization of more advanced techniques such as ground penetrating radar, x-ray, and acoustic/seismic systems for detecting pavement thickness and moisture variations in a medium among many others in current applications, subsurface profiling has come a long way; both in the scope of the technologies employed and the fields/areas of application. T