Article
0103 - 5053 $6.00+0.00
*e-mail: [email protected]
Comparison of Two Methods to Quantify 2,6-Dichlorophenol from Tick
Amblyomma
cajennense
by GC/MS-SIM
Kennedy K. Gachoka,a Deomar P. Costa,b Carla C. B. Louly,a Lorena L. Ferreira,a
Lígia M. F. Borges,c Lourival C. Fariab and Pedro H. Ferri*,b
aEscola de Veterinária and bInstituto de Química,Universidade Federal de Goiás, CP 131, 74001-970 Goiânia-GO, Brazil
cInstituto de Patologia Tropical e Saúde Pública, Universidade Federal de Goiás, Rua 235, Setor Universitário, 74605-050 Goiânia-GO, Brazil
Amblyommacajennense (Acari: Ixodidae) é um carrapato de grande importância sócio-econômica no subcontinente Sul-Americano. Apesar disso, pouco se conhece acerca de sua ecologia química, cuja informação é crucial para o seu controle. Nesse estudo, 2,6-diclorofenol
(2,6-DCP), o feromônio sexual de A. cajennense foi quantificado por cromatografia gasosa
acoplada a espectrometria de massas no modo de análise por monitoramento seletivo de íons (CG/EM-MSI) a partir de fêmeas alimentadas em coelhos durante 6 dias. O extrato do feromônio sexual foi obtido pela exposição ao ultrassom de fêmeas virgens em hexano em duas amostras independentes. Nenhum pré-tratamento da amostra foi necessário. Os métodos de adição padrão (SA) e de curva de calibração com 5-bromo-4-hidróxi-3-metóxibenzaldeído (5-BrV) como padrão interno (IS) foram utilizados para a quantificação. O conteúdo de 2,6-DCP não apresentou diferença significativa entre os extratos e/ou métodos utilizados. Os resultados mostraram que as faixas de
concentração de 2,6-DCP por fêmea foram de 2,03-2,27 ng mL-1 e de 2,06-2,24 ng mL-1 para os
métodos SA e IS, respectivamente. Os métodos mostraram ser específicos, sensíveis e fidedignos na determinação de 2,6-DCP em carrapatos.
Amblyommacajennense (Acari: Ixodidae) is a tick of socioeconomic importance in the South American sub-continent. Nevertheless, little is known pertaining to its chemical ecology, information deemed crucial to its management. In this study, the tick sex pheromone
2,6-dichlorophenol (2,6-DCP) was quantified from A. cajennense fed on rabbits for 6 days by use
of gas chromatography–mass spectrometry in the selected ion monitoring mode (GC/MS-SIM). The sex pheromone extract was obtained by the exposure of attractive females to hexane and ultrasound probe in two independent samples. Clean-up was not necessary. Standard addition method (SA) and calibration curve with 5-bromine-4-hydroxy-3-methoxybenzaldehyde (5-BrV) as an internal standard (IS) were employed in the quantification. 2,6-DCP contents did not show significant differences between extracts and/or methods. Results showed that the concentration
range of sex pheromone per female were 2.03-2.27 ng mL-1 and 2.06-2.24 ng mL-1 for SA and
IS methods, respectively. The methods provide a specific, sensitive and reliable technique for determining 2,6-DCP levels in ticks.
Keywords:Amblyommacajennense, tick sex pheromone, 2,6-dichlorophenol, GC/MS-SIM, internal standard, standard addition
Introduction
Amblyomma cajennense Fabricius (Acari: Ixodidae) is a three-host tick of great socioeconomic importance.1
Its distribution is limited to the tropics and subtropics of
South and Central America, Mexico, and southern USA.2
Though mainly a parasite of equines, A. cajennense attacks humans and a diverse range of other animals, both wild and domesticated. It is also a vector of the etiologic agent for Rocky Mountain spotted fever, Rickettsia rickettsii, in humans and animals living in the region.3 This tick
previously unimportant, with recent reports of its spread from the Brazilian Cerrado and Pantanal biomes to tropical Atlantic forest areas.4
Unlike the majority of Amblyomma species, pheromone mediation of the reproductive behavior of A. cajennense
has been reason for discussion owing to the existence of relatively few studies. However, recent studies have contested a previous consideration that females of this species do not produce a sex pheromone as consequence of positive isolation and identification of the chlorinated phenol, 2,6-dichlorophenol (2,6-DCP).5,6 2,6-DCP is a
highly volatile component that stimulates the detachment of metastriate males from the host to begin searching for emitting females.7 In some species, it acts solely as an
attractant sex pheromone with steryl esters serving as the cue for final recognition and mounting of female ticks by males,8,9 whereas in others it also doubles up as the
mounting sex pheromone.6,10 Thus this component may be
used for multiple purposes in the control of A. cajennense, such as confounding males or mimicking females for sexual interruption.11,12
Sex pheromone research has progressed steadily towards the point where quantification of component release rates or amounts from both natural and synthetic sources is essential. Pheromone quantification is required not only during implementation of control programs, such as the formulation of disruptants, but also during the initial isolation and identification process, as it may influence behavioral responses observed in laboratory bioassays. The hypothesis was that the higher orientation responses of A. cajennense to septa impregnated with 2,6-DCP in comparison to females probably occurred because the concentrations tested were many times higher than those released by females.6 In this study we quantified
2,6-DCP from A. cajennense using gas chromatography-mass spectrometry-selected ion monitoring method (GC/MS-SIM). For this purpose, internal standard and standard addition methods were used for the measurement of 2,6-DCP in the hexane extract of attractive females from two tick populations.
Experimental
Ticks and pheromone extraction
Engorged adult female A. cajennense ticks were collected from naturally infested horses and incubated (T = 27 °C and RH > 80%) until ecdysis. From this stage onwards a laboratory colony was reared and maintained for use in the study. As regards pheromone extraction, one-month old adults were fed on rabbits (Oryctolagus cuniculus) for
six days. In addition, to ensure a clean pheromone extract, the ticks were washed a day prior to rabbits’ infestation by being briefly dipped in water and gently swabbed with tissue paper to remove the dirt stuck on their cuticles. These were then used for pheromone extraction. To reduce uncontrolled factors affecting ticks’ life cycle, the extract was obtained from two independent tick populations.
Pheromone was extracted according to the method of Borges et al.10 Briefly, this involved immersing 100
confirmed attractive females in 4 mL of hexane ultra-residue grade (Baker; Phillipsburg, NJ, USA) and exposing them to ultrasound probe for 15 min. Extracts were filtered on a 0.45 μm Millipore Millex HV filter (Bedford, MA, USA); the solvent was evaporated under a nitrogen gas stream and adjusted to 1 mL with ethyl acetate,then kept in dark bottles at -20 °C until analyses. Two pheromone extracts (I and II) represented each tick population.
Chemical analyses
Analyses were carried out on a GC/MS Shimadzu (Kyoto, Japan) QP5050A instrument equipped with a data processing system employing the following conditions: a Shimadzu CBP-5 (Kyoto, Japan) fused silica capillary column with 30 m long × 0.25 mm i.d. × 0.25 μm film thickness composed of 5% phenylmethylpolysiloxane connected to a quadrupole mass detector operating in the SIM mode by EI ionization (70 eV) with a scan rate of 1.0 scan s−1; carrier gas: He (1.0 mL min−1), column
pressure, 56.7 kPa; injector and detector temperatures of 250 °C and a split ratio of 1:5. The injection volume was 0.5 μL and the oven temperature was raised from 80 °C to 280 °C at 20 °C min−1, with a total time of 10 min.
Three ions were recorded for monitoring each compound:
m/z 162 [M]+, 164 [M + 2]+ and 166 [M + 4]+ for 2,6-DCP
and ions m/z 230 [M]+, 231 [M + 1]+ = [M + 2 – H]+ and
232 [M+ 2]+ ions for the internal standard (IS),
5-bromine-4-hydroxy-3-methoxybenzaldehyde (5-BrV).
Quantification procedure
The GC/MS-SIM tick pheromone quantification procedure was used to quantify pheromone extracts.13 This
involved two methods for the construction of calibration curves: internal standard and standard addition.
For the preparation of standard, the stock solutions (10 mg mL-1) of 2,6-DCP and
5-bromine-4-hydroxy-3-methoxybenzaldehyde (5-BrV) were prepared in ethyl acetate and stored in dark bottles at −20 °C. Under such conditions they remained stable for at least two weeks. Standard solutions used to construct the calibration curves
and to spike the extracts were prepared daily by diluting stock solutions with ethyl acetate. All chemicals were analytical-reagent grade purchased from Sigma (St. Louis, MO, USA) and solvents were ultra-residue grade from Baker (Phillipsburg, NJ, USA). Water was obtained by a Milli-Q BioCell system from Millipore (Bedford, MA, USA).
The calibration curve for the internal standard method was built with six different concentrations (5, 8, 10, 30, 50 and 100 ng mL−1 in 2,6-DCP). Aliquots from the IS stock
solution (500 μL) were added to each standard solution. Standard solutions were diluted to a final volume of 10 mL with ethyl acetate. Aliquots of each extract (1 mL) were spiked with 500 μL of the IS stock solution, diluted to a final volume of 10 mL with ethyl acetate, and then analyzed by GC/MS-SIM. All injections were made in triplicate.
In the standard addition, the analytical calibration curve was built through successive additions of known volumes (0, 5, 10, 20 and 30 μL) of the stock solution of 2,6-DCP (0.5 μg mL−1) in 50 μL of the ethyl acetate solution
(10 mL) of A. cajennense extracts. In the quantification step, the final volume was adjusted to 100 μL and then analyzed by GC/MS-SIM. All injections were made in triplicate.
Statistical analyses
A variety of statistics was used in association with residues to ensure the reliability of all regression models,
i.e. Grubbs and Dixon’s tests for outliers and Cochran’s
C test for equality of variance in the calibration range.14
Quantification method and extract origin effects on 2,6-DCP contents were established by two-way ANOVA (extracts and methods as factors) using SAS GLM analyses (Statistical Analysis System, SAS Institute Inc., Cary, NC, 1996). All data was checked for homoscedasticity with the use of Hartley’s test. Whenever a difference was established a post-hoc Tukey test was performed. Results are shown as mean values and are joined by the standard deviation.
P-values less than 0.05 were regarded as significant. The results of Grubbs and Dixon’s tests and Cochran’s C test
in the calibration curves as well as two-way ANOVA are shown in a supplementary information file.
Results and Discussion
This study represents the first attempt to quantify an A. cajennense pheromone. Owing to the increased complexity of pheromone samples and to the small amounts of components of interest found in them, highly sensitive methods are required to detect and identify these substances. To achieve this goal, the equipment was thoroughly calibrated and thus the compounds in the column were
clearly separated, enabling an accurate quantification of very small amounts of 2,6-DCP in the extract. Clean-ups were not required before the determination by GC/MS-SIM.
Method optimization
The use of gas chromatography-mass spectrometry-selected ion monitoring analyses (SIM method) has been widely applied to the measurement of trace amounts of substances in biological materials because of its high sensitivity and selectivity, which are related to the correct choice of monitored ion fragments. The areas under peaks are directly proportional to component concentrations and thus serve as an analytical parameter. Peaks with the highest intensity for 2,6-DCP were [M]+ (m/z = 162, 100%),
[M + 2]+ (m/z = 164, 95%), and [M + 4]+ (m/z = 166,
35%), whereas the most intense peaks for internal standard (5-BrV) were [M]+ (m/z = 230, 100%), [M + 1]+ = [M +
2 - H]+ (m/z = 231, 97%), and [M+ 2]+ (m/z = 232, 98%).
Therefore these ions were monitored in the SIM mode. Under the imposed conditions, baseline separation of the two compounds was obtained with retention times of 5.04 min for the sex pheromone (2,6-DCP) and 7.09 min for the 5-BrV in a chromatographic run of 10 min.
Analytical curves
In the internal standard method, analytical calibration curves over a concentration range from 0.5 to 500 ng mL−1
in 2,6-DCP and 0.5 μg mL−1 in 5-BrV had linear responses
with correlation coefficients (r2) higher than 0.99 and fit
to a calibration curve such as A/A0 = a + b(C/C0), where A and C are the integrated peak area and concentration of 2,6-DCP, respectively; A0 and C0 are the corresponding quantities for IS; b is the slope of the calibration line and a is its intercept. The analytical parameters defined a linear relationship obtained between the area ratio of ions m/z
162, 164, 166 to ions m/z 230, 231, 232 of the IS and the concentration of 2,6-DCP.
In the standard addition method, the linear range was established by adding known volumes (0, 5, 10, 20, and 30 μL) of the stock solution of 2,6-DCP (0.5 μg mL−1)
in volumetric flasks of 10 mL containing a synthetic sample (50 μL) of known concentration (8 ng mL−1). The
concentrations were ascertained by extrapolation of the calibration curves. The x-intercept represented the original amount of 2,6-DCP. Detection and quantification limits for both methods were calculated from analyses of 17 replicates of blank sample. The standard deviation (SD) of those analyses was divided by the angular coefficient of the linear equation model and multiplied by three (LD)
and ten (LQ) times. Table 1 shows calibration parameters for both methods.
Precision and accuracy
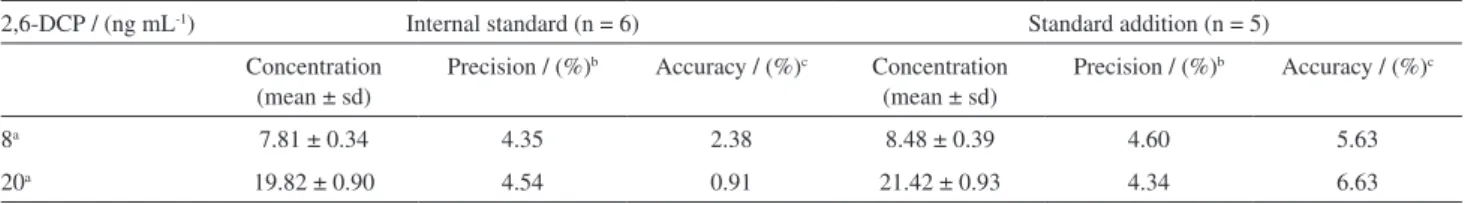
Table 2 shows the precision and accuracy for the proposed methods assessed by values of coefficient of variation (CV) and relative error (RE). Recovery data for the IS method was estimated by six replicates of two standard solutions of known concentrations (8 and 20 ng mL−1 in
2,6-DCP). The results obtained for 2,6-DCP recoveries ranged from 93.38 to 103.60%. For the standard addition method the recovery was obtained by five replicates of a synthetic sample of known concentration (8 and 20 ng mL−1 in 2,6-DCP) spiked with 2,6-DCP at five levels
of fortification; the value was 106.55%.
2,6-DCP quantification
Internal standard was employed for several reasons. It cancels all variation in quantification caused by instrument instability and it allows for greater certainty in the assignment of retention times and increased sensitivity. To check its accuracy, the 2,6-DCP concentration of spiked samples was calculated by the standard addition method. Two-way analysis of variance (two-way ANOVA) was performed to investigate the method’s (and the extract’s) effects. If the null hypothesis is accepted with a significant
level over 5%, then it is inferred that methods are accurate because of the similarity of the results for 2,6-DCP contents, which are not significantly different. In addition, the absence of a matrix effect is confirmed.
For quantifying the pheromone in the extracts we chose the concentration range from 5 to 150 ng mL−1, since it
included quantities reported for other tick species.13,15,16
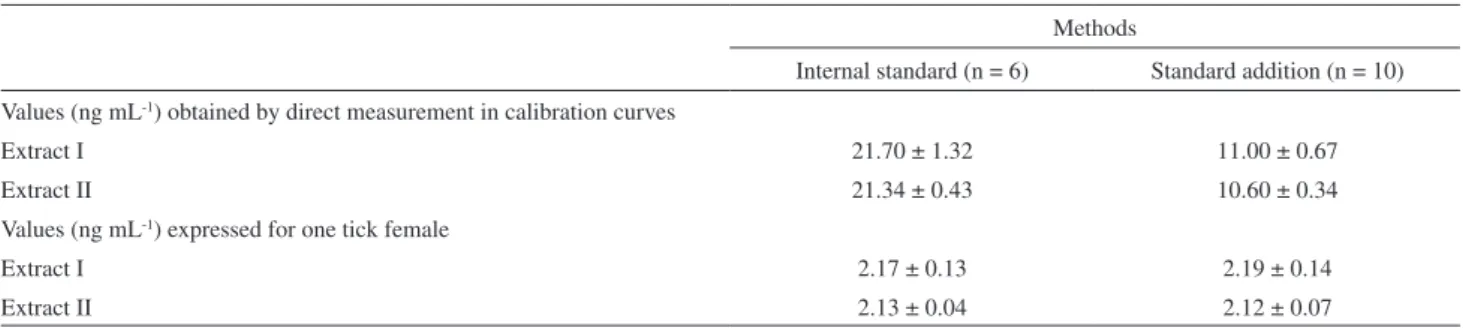
Values obtained by the direct measurement of 2,6-DCP in calibration curves ranged between 10.19 and 10.89 ng mL-1 for internal standard and between
10.26 and 11.68 ng mL-1 for the standard addition
method. Pheromone quantities in females ranged from 2.03 to 2.32 ng mL-1 each. Two-way ANOVA (Table S7,
supplementary information) showed that no significant differences in 2,6-DCP amounts were found according to tick population (extracts I and II: degrees of freedom, df = 3, 28; F-value = 2.33; p < 0.138) and quantification method (IS and AS: df = 3, 28; F-value = 0.001; p < 0.950), as well as in the interaction between the two factors (extract×method: df = 3, 28; F-value = 0.160; p < 0.691).
The fact that the two methods which analyzed two different samples yielded no significant differences for 2,6-DCP quantities highlights the consistency of the whole process, from inoculation and extraction to quantification. Furthermore, they are reliable for the quantification of 2,6-DCP in the range of the established concentration. In addition, these results revealed the absence of tick life cycle and matrix interferences.
Table 1. Analytical characteristics of calibration curves of 2,6-DCP in GC/MS-SIM methods
Parameters Methods
Internal standard Standard addition
Regression equation A/A0 = a + b(C/C0) A = a + bC
Slope (b) 0.0079 ± 0.0001a 214.693 ± 1.524b Intercept (a) 0.0608 ± 0.0046a 2462.808 ± 128.614b Correlation coefficient (r2) 0.9994 0.9998 Calibration range / (ng mL-1) 0.5-500 0-150 Quantification limit / (ng mL-1) 3.9 4.7 Detection limit / (ng mL-1) 1.2 1.4
aAverage of six determinations, sd (n = 6). bAverage of five determinations, sd (n = 5).
Table 2. Precision and accuracy of 2,6-DCP in GC/MS-SIM methods
2,6-DCP / (ng mL-1) Internal standard (n = 6) Standard addition (n = 5) Concentration
(mean ± sd)
Precision / (%)b Accuracy / (%)c Concentration (mean ± sd)
Precision / (%)b Accuracy / (%)c
8a 7.81 ± 0.34 4.35 2.38 8.48 ± 0.39 4.60 5.63
20a 19.82 ± 0.90 4.54 0.91 21.42 ± 0.93 4.34 6.63
The mean value of 2.15 ng mL-1 per female was within
the range of 2-3 ng per female Rhipicephalussanguineus
Latrielle and of 2.0 ng per tick after six days of feeding in R. appediculatus Neumann.15,16 However, it was several
times higher than the 0.31 ng mL-1 per female value,
found by the same methods when quantifying 2,6-DCP in
Dermacentor nitens Neumann.13 These variations mainly
serve to define the range of expected 2,6-DCP quantities, as it is not possible to make direct comparisons of pheromone quantities obtained by different methods from tick species of various hosts, life cycles and habitats, even when such quantities are apparently similar.
The identification of 2,6-DCP dates back to the 1970s, with the first reports registered for Amblyomma americanum Linnaeus.17 So far the compound has been
reported in18 species of Ixodidae from seven genera.6,10,18-20
However, confirmatory reports of 2,6-DCP’s role as a sex-attraction pheromone are fewer and conclusive in only eight species, including A. cajennense.6,10,21-23 In R. microplus, cell
responses to 2,6-DCP were not followed by any evidence of behavioral reaction.18 Whereas most reports allude to
2,6-DCP in feeding females, other studies have showed phenol from unfed females,16 unfed males, and larvae in
R. appendiculatus and R. microplus.18 Nevertheless, it is
in females of the Ixodidae species following the onset of feeding that the role of 2,6-DCP has been elucidated.
A. cajennense males have oriented themselves toward the females and the septa impregnated with 2,6-DCP, apparently recognizing them as copula partners with a degree of mounting and ventral positioning in both cases,6
even though quantities impregnated on the rubber septa were many times higher than those determined in females in this work. Thus, 2,6-DCP quantification may contribute to the role of 2,6-DCP in the courtship behavior of A. cajennense.
Conclusions
In this paper, the quantification of 2,6-DCP in extracts of A. cajennense females was achieved by GC/MS-SIM
with standard addition and internal standard as calibration methods. All calibration curves had a correlation coefficient greater than 0.99 over the 2,6-DCP concentration range of 0.5-500 ng mL-1. The methods are quick, accurate, and
highly efficient, and may be used for the qualitative or quantitative determination of 2,6-DCP in ticks.
Supplementary Information
Supplementary data are available free of charge at http://jbcs.sbq.org.br, as a PDF file.
Acknowledgments
The authors are indebted to CNPq, Academy of Sciences for the Developing World-TWAS, PADCT III, and FUNAPE/UFG for financial support, as well as to CNPq/ TWAS for granting a fellowship to Kennedy K. Gachoka.
References
1. Guglielmone, A. A.; Mangold, A. J.; Aguirre, D. H.; Aido, A. B.; Vet. Parasitol.1990, 35, 93.
2. Campos, P. M.; Labruna, M. B.; Clin. Vet. 1998, 12, 19; Guglielmone, A. A.; Beati, L.; Barros-Battesti, D. M.; Labruna, M. B.; Nava, S.; Venzal, J. M.; Mangold, A. J.; Szabó, M. P. J.; Martins, J. R.; Gonzales-Acunã, D.; Estrada-Penã, A.; Exp. Appl. Acarol.2006, 40, 83.
3. Dias, E.; Martins, A. V.; Am. J. Trop. Med. 1939, 19, 103; Lemos, E. R. S.; Machado, R. D.; Pires, F. D. A.; Machado, S. L.; Costa, L. M. C.; Mem. Inst. OswaldoCruz1997, 92, 477; Horta, M.; Labruna, M. B.; Sangioni, L. A.; Vianna, M. C. B.; Gennari, S. M.; Galvão, M. A. M.; Mafra, C. L.; Vidotto, O.; Schumaker, T. T. S.; Walker, D. H.; Am. J. Trop. Med. Hyg. 2004, 71, 93; Guedes, E.; Leite, R. C.; Prata, M. C. A.; Pacheco, R. C. P.; Walker, D. H.; Labruna, M. B.; Mem. Inst. Oswaldo Cruz2005,
100, 841.
4. Labruna, M. B.; Jorge, R. S. P.; Sana, D. A.; Anah, T. A. J.; Kashivakura, C. K.; Furtado, M. M.; Ferro, C.; Perez, A. S.; Silveira, L.; Santos Junior, T. S.; Marques, S. R.; Morato, R.
Table 3. 2,6-DCP concentration (average and standard deviations) assessed by GC/MS-SIM in extract samples Methods
Internal standard (n = 6) Standard addition (n = 10) Values (ng mL-1) obtained by direct measurement in calibration curves
Extract I 21.70 ± 1.32 11.00 ± 0.67
Extract II 21.34 ± 0.43 10.60 ± 0.34
Values (ng mL-1) expressed for one tick female
Extract I 2.17 ± 0.13 2.19 ± 0.14
G.; Nava, A.; Adania, C. H.; Texeira, R. H. F.; Gomes, A. A. B.; Conforti, V. A.; Azevedo, F. C. C.; Prada, C. S.; Silva, J. C. R.; Batista, A. F.; Marvulo, M. F. V.; Morato, R. L. G.; Alho, C. J. R.; Pinter, A.; Ferreira, P. M.; Ferreira, F.; Barros-Battesti, D. M.; Exp. Appl. Acarol.2005, 40, 149.
5. Rechav, Y.; Goldberg, M.; Fielden, L. J.; J. Med. Entomol.1997,
34, 234.
6. Louly, C. C. B.; Silveira, D. N.; Soares, S. F.; Ferri, P. H.; Melo, A. C. C.; Borges, L. M. F.; Mem. Inst. Oswaldo Cruz2008, 103, 60.
7. Sonenshine, D. E.; Biology of Ticks, vol. 1; Oxford University Press: Oxford, 1991.
8. Hamilton, J. G. C.; Sonenshine, D. E.; Lusby, W. R.; J. Insect Physiol.1989, 11, 873.
9. Hamilton, J. G. C.; Sonenshine, D. E.; J. Chem. Ecol.1988, 14, 401; Sobbhy, H.; Aggour, M. G.; Sonenshine, D. E.; Burridge, M. J.; Exp. Appl. Acarol.1994, 18, 265.
10. Borges, L. M. F.; Eiras, A. E.; Ferri, P. H.; Lobo, A. C. C.; Exp. Appl. Acarol.2002, 27, 223.
11. Sonenshine, D. E.; Taylor, D.; Corrigan, G.; Exp. Appl. Acarol. 1985, 1, 23.
12. Borges, L. M. F.; Ferreira, L. A. M.; Silva, L. S.; Oliveira, R. A.; Mussi, S. V.; Faria, K. A.; Melo, L. S.; Abud, L. J.; Costa, G. V.; Soares, S. F.; Vet. Parasitol.2007, 147, 155.
13. Rodrigues, C. M.; Borges, L. M. F.; Ferri, P. H.; Faria, L. C.;
Talanta 2004, 62, 637.
14. Miller, J. N.; Miller, J. C.; Statistics and Chemometrics for Analytical Chemistry, 4th ed.; Prentice Hall: New York, 2001.
15. Chow, Y. S.; Wang, C. B.; Lin,L. C.; Ann. Entomol. Soc. Am. 1975, 68, 485.
16. Mcdowell, P. G.; Waladde, S. M.; J. Chem. Ecol. 1986, 12, 69. 17. Berger, R. S.; Dukes, J. C.; Chow, Y. S.; J. Med. Entomol. 1971,
8, 84; Berger, R. S.; Science1972, 177, 704.
18. Bruyne, M.; Guerin, P. M.; J. Insect Physiol.1994, 40, 143. 19. Liu, J. Z.; Jiang, Z. J.; Yang, Y. P.; Sun, R. Y.; Acta Parasitol.
Med. Entomol. Sin.1998, 5, 253.
20. Sonenshine, D. E.; Annu. Rev. Entomol.2006, 51, 557. 21. Sonenshine, D. E.; Silverstein, R. M.; Plummer, E.; West, J. R.;
Mccullough, T.; J. Chem. Ecol. 1976, 2, 201.
22. Kellum, D.; Berger, R. S.; J. Med. Entomol. 1977, 20, 701. 23. Silverstein, R.; West, J. R.; Khalil, G. M.; Sonenshine, D. E.;
J. Chem. Ecol. 1983, 9, 1543.
Submitted: August 26, 2009 Published online: May 11, 2010