Network Anomaly Detection through
Traffic Measurement
Yuming Jiang, Zhihua Jin, Atef Abdelk efi, Magnus Ask, Helge Skrautvol
Abstract
With the growth of the Internet, an increase in network anomalies is inevitable. The anomalies may be due to equipment failures, network mis-configurations, or attacks. The attacks can range from simple port scans to sophisticated DDoS attacks. To detect anomalies through traffic measurement, a number of approaches have been proposed. These approaches can be generally put into three categories, namely visualization based, behavior based, and traffic volume based approaches. This article provides an introduction to these categories of approaches, each with focus on a specific approach in the category.
Introduction
The Internet is becoming larger in size and faster in speed. With the support of technology development, the Internet extends wider and penetrates deeper into our lives. As a result, the amount of its traffics grows explosively, and the variety of the network services increases rapidly as well. Such enormous amount and complex composition of traffic poses a great challenge to network management. In addition, with the growth of the Internet, an increase in network anomalies has become inevitable. The anomalies may be due to equipment failures, network mis-configurations, or attacks. In networking, an event that deviates from the normal network behavior is considered as a network anomaly. The attacks can range from simple port scans to sophisticated DDoS (distributed denial-of-service) attacks. These further increase the difficulty of network management.
In order to manage a network, the traffic going through it has to be well understood. To do so, the network traffic has to be measured and analyzed. For traffic measurement, there are two ways in general. One is to capture only the network properties of the traffic without the payload, by which the main traffic flow information is recorded. The other is to capture all information of the traffic including the payload, basically the whole packets of the traffic of interest. Apparently, the latter can provide more information than the former for analysis. However, in practice, while the packet based methods may be implemented in end systems say for security protection, it is hard or indeed unrealistic to have them implemented in the network, due to legal issues and huge costs in maintaining and analyzing the tremendous amount of measurement data. As a matter of fact, even for the flow based methods, the resulting amount of traffic measurement data can still be huge. In this article, the focus is on flow-based traffic measurement. Specifically, NetFlow traffic measurement is considered.
For network anomaly detection through traffic measurement, many approaches have been proposed in the literature, which can be put into three categories. One is visualization based approaches, another is behavior based approaches, and the third is traffic volume based approaches. The purpose of this article is to provide an overview of these three categories of approaches. For each category, a representative approach is introduced. The content of this article is partially based on, and the figures are taken from [1][2][3]. The structure of this article is as follows. Traffic measurement basics, particularly NetFlow traffic measurement, and network anomaly basics are first introduced in the next section. Then, the three categories of approaches are introduced
together with a representative approach for each category. Discussion and summary are provided in the last section.
Traffic Measurement and Network Anomaly Basics
NetFlow Traffic Measurement
NetFlow is a method and protocol, initially developed by Cisco and having evolved to become an IETF standard called IP Flow Information Export (IPFIX), which captures IP packets passing by an observation point in a network during a certain time interval, and stores information on a flow basis. All packets belonging to a particular flow have a set of common properties that will interchangeably called attributes or features in this article. The values of some chosen packet attributes are used to distinguish a flow from the others, while other attribute values are aggregated to reflect the characteristics of a flow.
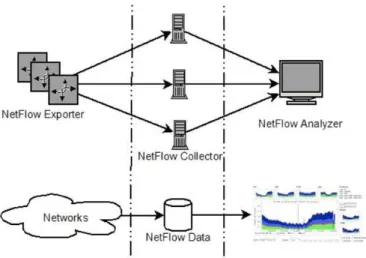
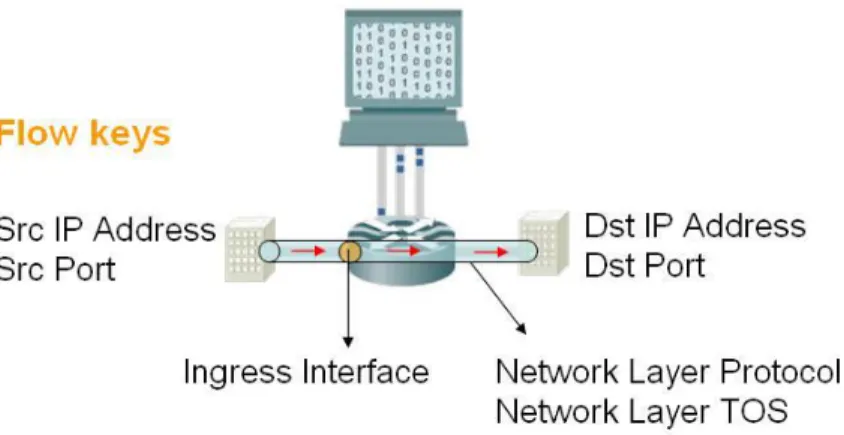
Figure 1 shows the architecture of NetFlow, which consists of three logical components, namely NetFlow Exporter, Collector and Analyzer. A NetFlow exporter is a NetFlow-technology-enabled router deployed at a certain observation point in the network. It captures bypassing packets, classifies them into flow records in its local cache, and exports the finished flow records to NetFlow collectors. A NetFlow collector is a server equipped with a NetFlow collection software that provides a daemon service listening on the network. Whenever the flow records exported by the exporter arrive at the collector, the daemon program receives the records and stores them onto the hard disk. A NetFlow analyzer is usually a server with NetFlow analysis software installed. Such software converts the binary raw flow data into human readable format. The software also provides analysis functionalities typically with human-computer interface that allows the human user to make use of the data. Figure 1 shows the relationship between each component and their functionalities. With NetFlow, when a new packet arrives, the Exporter router first determines whether it belongs to any of the current flow entries in the system. Typically, seven features are used to uniquely identify a flow as depicted in Figure 2, which are the source address and port number, ingress interface, destination address and port number, network layer protocol and type of service (TOS). If the new packet does not belong to any existing flow, a new flow entry containing the values of the chosen properties of the packet is created. If the packet belongs to an existing flow entry, the router updates the measurement data for this flow. The measurement data include the accumulated traffic amount in number of packets and in number of bytes of this flow. Note that, the payload of the packet is not recorded in NetFlow data.
In addition to packet and byte counting, NetFlow has two time counters for each flow entry. One records the time interval between the current packet and the previous packet, and the other records the total duration of the flow. Once reaching a pre-defined threshold, the flow entry is marked as finished, even though the actual transmission within the flow is still active.
While a NetFlow record can contain a wide variety of information about the traffic in a given flow, it
commonly includes the abovementioned seven features, number of bytes and packets observed in the
flow, and timestamps for the flow start and finish time, in milliseconds.
Network Anomalies
A network anomaly is often a sudden and short lived deviation from the normal operation of the network. While some anomalies are simply caused by accidents related to network equipment or link failures, the others are caused by malicious intrusions. In this article, we focus on the latter category of network anomalies which has several types. To facilitate the discussion, we first review the concept of botnet.
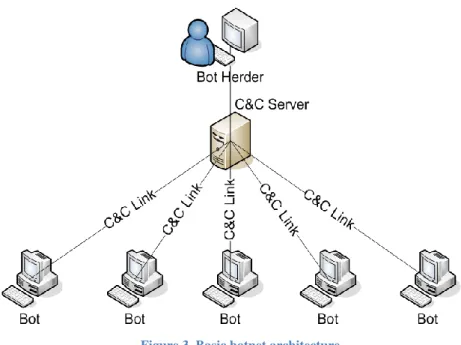
A botnet is a network comprised of compromised computers called bots, which are controlled by other computers in the network. Those controlling computers, which are called command and control (C&C) servers or simply controllers, use certain network communication links to send commands to the bots. The corresponding communication links are called C&C links. The controllers are in direct contact with the bots. Due to this, they may expose themselves too much and easily get caught. Thus normally, the controllers are also compromised computers instead of the real bot herder. Figure 3 shows a basic botnet architecture, where the number of controllers can be more than one and even organized in several layers in order to hide the bot herder better. Characterized as stealthy, organized and profit-driven, botnets are capable of performing various malicious tasks from sending spam to operating large phishing systems. Botnets as a collection of the organized compromised computers in the networks may perform almost all typical kinds of malicious activities.
Like any criminal organization, malicious tasks performed by botnets typically have four stages:
reconnaissance, propagation, communication, and finally attack. Each stage involves certain
malicious activities, such as scanning for reconnaissance, spam relay and malware distribution for
propagation, C&C link for communication, and finally causing DoS for attack. In the following, we
review several such anomalies.
Scanning: Scanning is the activity that scanners, i.e. computers connected to the network, try to find potential vulnerable computers that could be further exploited on the network. Usually the number of scanners is much smaller than the number of victims for cost-efficiency reasons, and the time duration of scanning is short. In general there are two basic types of scanning. One targets IP address and the other targets port number in TCP or UDP headers. IP address based scannings, also known as IP sweeps, attempt to find vulnerable computers within a network block. Such scans often result in traffic flows with very few different source IP addresses but a lot of different destination IP addresses within the network block. Port scans, i.e. port number based scannings, attempt to find vulnerable services, or TCP/UDP ports, opened on targeted computers. They leave main traces in the traffic flows characterized by very few different source IP addresses but many different destination port numbers. In addition, other properties of the flows are usually the same or very similar. Port sweeps are similar to IP sweeps or port scans. While all will scan multiple hosts or targeted IP addresses, a port sweep only scans for a specific listening TCP/UDP port.
DoS / DDoS: DoS attack is the activity that attackers, which are also computers connected to the network, try to exhaust computer resources or network bandwidth of a targeted victim system, in order to prevent it from providing services to legitimate users. The resulting effect of DoS attack mainly depends on its impact on the target and its similarity to legitimate traffics. In other words, it generally cumulates as many attackers as possible to send a large enough amount of legitimate service requests to the targets per time unit in order to exhaust their capacities. Effective DoS attacks usually lead to traffic flows with a lot of different source IP addresses but only very few different destination IP addresses. For this reason, they are called Distributed DoS (DDoS) attacks. In addition, like scanning, other properties of the flows are usually the same or very similar.
Flash Crowds:
Flash crowd is very similar to DDoS. It is characterized by an unusually high amount of traffic from a set of IPs. Contrary to DDoS, however, a flash crowd is not a result of malicious activity. With the rise of social network sites and websites where users can share interesting hyperlinks with each other,there are situations where people from all over the world access a particular site during the same time interval. This effect can cause websites to load very slowly or even go down entirely. Flash crowd differs from DDoS in the amount of different IPs observed in the anomaly. While a botnetused for DDoS attacks can be of a very large size, they are normally eclipsed by sheer amount of IPs present in a flash crowd.
C&C Link: C&C links are not such harmful threats by themselves unless they are exploited to organize the bots to perform malicious activities. Via the C&C links, hundreds of thousands of bots form a powerful army under the control of bot herders. Without such C&C links, the bots can do little. In addition, the C&C link is the key to trace back to both the controllers and the bots, which is the first step to clean up the infected computers in order to diminish the scale of botnets and mitigate the effect of their attacks. Therefore, C&C links are considered the weakest part of botnets. Most of the time, a C&C link is used for the following tasks. First, the bots need it to update their malware in order to perform specific malicious activities. Second, the controllers need it for sending keep-alive signals to keep in touch with their bots. Third, the controllers need it to send specific commands to their bots in order to launch destined malicious activities. The first two tasks imply some periodic traffic pattern, by which, C&C links may be detected.
Visualization Based Approaches
In general, human beings have very special perception capabilities which are way beyond the performance of any of the state-of-the-art artificial intelligence (AI) algorithms in discovering patterns. On the other hand, the major advantage of computers over human beings is its high speed in executing pre-defined computational tasks. Combining the discovery capability of human beings and the fast computing capability of computers, we can have a problem solving system. The system is comprised of the computer and the human user. In network anomaly detection, the computer generates visual images of the NetFlow measurement data for the human user to discover malicious activities hidden in the data. In each analysis cycle the human user gives feedbacks to the computer in order to get more desirable visual images that lead to a step forward towards the objective.
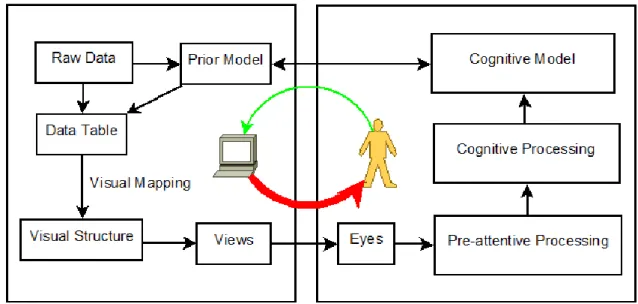
Figure 4. Reference model of visualization
Figure 4 depicts the processing flow of computer and the perceptual flow of human being, illustrating a reference model of the visualization. Starting from the raw data, the computer first dumps the raw data to the data table where each row may represent a data record, and each column represent a property of the data record. Any data that can be converted to such form of data table is called table data, so does the NetFlow data in our case. The data table can also be acquired indirectly by applying a pre-processing on the raw data. For
example, linear transformations such as fast Fourier transform (FFT), dimension reduction methods such as principal component analysis (PCA), clustering algorithms such as multidimensional scaling (MDS), or other semantic procedures that convert the raw data into data tables may be used. Then, the records in the data table are mapped visually to some visual structures such as points, lines, areas, etc., and finally rendered to views displayed in the output device such as a monitor. The perceptual flow of human beings in the right box can be divided into two parts: the vision input by the sight of eyes, and the mental perceptual processing of the brain. Apparently, since the eyes are the only interface to take in the views, the faithfulness of the conversion from the real world view to a mental view becomes critical. After the first step, the human brain takes over further perception according to the reference model of visualization. If the views are carefully designed, the performance can be optimized. In the literature, a number of visualization systems for network anomaly detection exist.
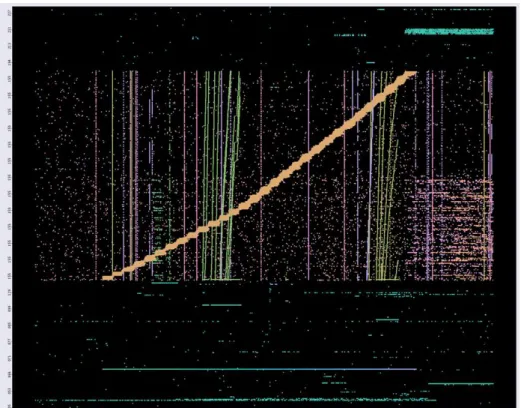
As an example of the visualization based approach, Figure 5 shows the temporal pattern of destination IP addresses in a measurement dataset, which is illustrated by a scatter plot, where the y-axis represents destination IP addresses (das), while the x-axis represents the start times (ts) of new flows during the measurement windows. The scatter plot is further rainbow-brushed by source IP address (sas), and flows coming from different source IP addresses are brushed with different colors.
A preliminary observation from Figure 5 is that the data points in general form lines in the plot. Horizontal lines suggest that many flows go to a single IP address, which is a common characteristic of a server. Vertical lines indicate that during a very short period of time many flows go to many IP addresses, which is one important characteristic of scanning traffic and worth more examination. In addition, as can be easily observed, the data points forming each vertical line are of the same color, which suggests that a single host or a small group of hosts are sending flows towards many other hosts at the same time. After confirming that the flows forming the vertical lines come from very few hosts, another basic characteristic left is the similarity of their payloads. Indeed, instead of rainbow brushing by sas, rainbow brushing by bpp (bytes per packet) has also been conducted, which shows the consistent color of the data points forming each vertical line, suggesting very identical payload in each such flow. According to the nature of scanning, aided by these visualization helps, we can say that those vertical lines are IP-sweep scannings. In addition, because thick diagonal line lasts for a longer time period, it can be identified as an IP based creepy-crawly scanning.
Behavior Based Approaches
Analyzing packet header fields is another approach for network anomaly detection. Most anomalies, despite their diversity, induce a change in the distributions across traffic features. For example, a scan implies a dispersed distribution for destination addresses as shown in Figure 5, and a skewed distribution for the destination ports which is concentrated on the port being scanned. In essence, this technique exploits the fact that anomalies can be treated as events that disturb the distribution of traffic features.
Figure 5. Scatter plot - das vs ts with rainbow brushing by bpp
Table 1 lists the traffic feature distributions that are typically affected by a certain type of anomaly. The behavior based analysis has two key benefits. One is the detection of anomalies that might be hidden in traffic volume. Another is that the impact on traffic feature distributions reveals information about the structure of the anomaly.
Table 1. Traffic feature distributions affected
Anomaly Definition Traffic feature distributions affected
Flash Crowd Unusual burst of traffic to single destination, from a set of sources
Destination address Destination port DDoD Large amount of traffic to one destination from
lots of sources
Destination address Source address Port Scan Probes to many destination ports on a small set
of destination addresses
Destination address Destination port Port Sweep Scanning for open ports to find vulnerable
hosts in a network block
Destination address Destination port
Several behavior based approaches exist, which exploit the behavioral differences between benign and anomalous traffic. Some of them analyze connection states, while others analyze behavioral features within a packet/flow. Different techniques are often proposed and developed in order to detect different types of anomalies. A commonly used idea is that, within each measurement window or time bin, some statistical measures on the traffic feature distributions are analyzed. Based on the analysis and the nature of a certain type of anomaly, detection decision is then made.
Particularly, scan detection has been in the simple form of detecting a number of events within a defined time interval. If this number is greater or lower than a certain pre-defined threshold, it is considered that an
anomaly is detected, and the type of the anomaly is found based on the nature of this type of anomaly. For example, in detecting scans, the connection attempt pattern of each source is analyzed. An intuition is that a scan accesses a wide range of destination IP addresses or ports compared to normal behavior. If either the ratio between the number of destination IP addresses and the number of destination ports, or the ratio between the number of destination ports and the number of destination IP addresses, results in a value greatly larger than one, then the source is considered as a scanner.
In general, however, it is known that a traffic feature distribution can be high-dimensional. Due to this, classical time series techniques are sometimes difficult to use when directly applied to such distributions. To deal with this challenge, it has been proposed to use the concept of entropy.
Entropy is a measure of uncertainty. It is a powerful mathematical tool that can give a compact representation of the traffic feature distribution. Specifically, let X denote a random variable representing the distribution of values of a specific traffic feature. Each X can take n outcomes {xi : i = 1,…,n}. The entropy of this random
variable is defined as the following, where p(xi) denotes the probability of xi:
log
To quantitatively compare entropy values across time, the normalized entropy is used, which is defined as:
For each of the traffic features used in the analysis, the probabilities, p(xi), i=1, …, n, are estimated by the
number of each outcome divided by the total number n of outcomes in an observed measurement window. Let us take destination IP address as the traffic feature as an example. Then, within a certain measurement time bin, the total number of distinct destination addresses observed in the time bin is found, which is n. In addition, for each distinct destination address xi, its probability p(xi) is estimated by:
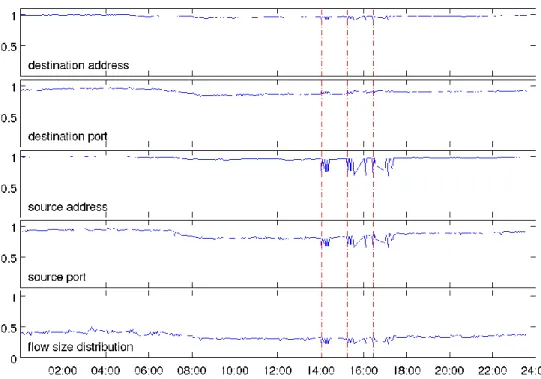
To exemplify the use of the entropy based technique, Figure 6 illustrates entropy curves of five selected traffic features, which are destination address, destination port, source address, source port, and flow size distribution, during a period where simulated scans were injected to a measured network. The y-axis corresponds to the entropy of each traffic feature distribution and the x-axis to the moment in time . The dotted lines in the xy-plane correspond to the times when the port scans were injected.
Figure 6 shows that the scans are visually clear from the entropy curves. However, when looking at the impact on the different traffic feature distributions, one can see clear differences. The port scans have a greater impact on the source address entropy and source port entropy than the other three features’. While this may seem to be in contrast to what is listed in Table 1, it is indeed due to the configuration of the injected port scan. The software used in simulating scans only scans the first thousand ports, which does not introduce a significant concentration or dispersion of the most used ports. This is the reason why the destination port entropy remains stable for a longer time. In addition, the simulated port scan only introduced about 250 destination addresses to the network. This is insignificant in comparison to the total number of destination addresses that can be observed from the measured network. In consequence, the destination address distribution did not get affected in the same degree as the source address and source port distributions did.
Figure 6. Entropy (normalized) curves during a period with injected port scans
An implication of Figure 6 is that, while Table 1 provides an overview of different types of anomalies and their affected traffic features, using information from the table needs care as discussed above. Particularly, the nature of a port scan needs to be carefully analyzed. As visualized in Figure 6, the indication of a port scan can be seen in the entropy values for source address and source port, not destination port and destination address as suggested by the literature e.g. Table 1.
Volume Based Approaches
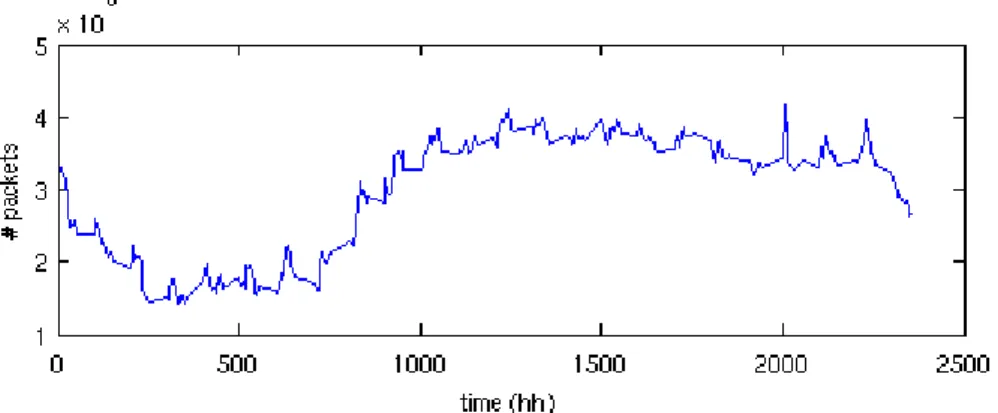
A traffic volume metric essentially relates to the number of flows, the number of packets, or the number of bytes that are sent across the measurement point in the network. The volume metric normally can be easily extracted from the (NetFlow) measurement data. Such extraction is performed depending on the wanted level of aggregation. Normally, three aggregation levels are considered. One is the router level, where the total numbers of flows / packets / bytes that pass by the router. Another is the link level, where such numbers are extracted for a link. The third is flow level, where each flow is identified by the chosen features as shown in Figure 2. With NetFlow, flow level packet and byte volume metrics are immediately found from NetFlow records, if the chosen features are the same as used in NetFlow configuration. Volume based techniques allow to see the basic traffic behavior in the network. As an example, Figure 7 illustrates (or visualizes) how the number of packets, measured in a time interval with fixed length, changes over time. An abrupt change (i.e. either an increase or decrease in volume) in one of these metrics might lead to the conclusion that a volume anomaly occurred.
A volume metric can be used as a parameter in a statistical detection system that derives a model from normal network behavior and detects deviations from the normal profile. Statistical techniques have been applied to detect volume based anomalies. Among these, the Principal Component Analysis (PCA) is a representative one. This is due to three reasons compared to other methods. First, the meaning of PCA is relatively intuitive. It tries to find an orientation in the high-dimensional space along which the data should be projected,. Second, the algorithm for PCA is systematic and could be very efficiently carried out by a computer. It is considered
one of the fastest multidimensional reduction methods. Third, PCA has been used for over a century since its invention in 1901 by Karl Pearson. As one of the most popularly used exploratory data analysis methods, it is proven reliable to find the principal components of the data under three main assumptions. First, the data is linear composition of certain basis. Second, the data has Gaussian properties in which statistical characteristics such as mean and covariance are important to depict the data. Third, large variances have important dynamics.
Figure 7. An example of packet count over time
A foundation of PCA is that it seeks the best rank-k estimate E of a data matrix X by solving:
,
where ∥ ∥2denotes the ℓ2-norm. It is worth highlighting that here, the rank k has to be known a priori.
However, this requirement can hardly be met in real network environments. In addition, the problem is a least square problem. It is well-known that, while the least square gives optimal results in the presence of Gaussian noise (e.g., low and medium intensity attacks), it has been proven that it’s very sensitive to the outliers (known as high intensity attacks). This is mainly due to the fact that it is an ℓ2-norm fitting problem, leading to
the low-rank subspace poisoning phenomenon. This phenomenon depicts the deviation of the principal components from the true distribution of the data toward even a low fraction of outliers. As a consequence, shifted principal components lead to a perturbation in the low-rank subspace, resulting in inaccurate detection and high false positive rates. Another finding concerning the PCA sensitivity is that it comes from the inability of PCA to detect temporal correlations. Based on this finding, an extension of PCA to Kalman-Loeve expansion (KLE) has been proposed.
In order to make the detection robust to the poisoning phenomenon and without a priori requirement for the calibration setting, another approach, called principal component pursuit (PCP), has been considered. A key idea behind PCP is that the real traffic data, X, includes an unknown fraction of normal traffic, N, while the remaining fraction is corrupted by different types of anomalies, A. Since normal traffic is known to be low rank and anomalies to be temporally localized or sparse in time, an anomaly detector aims to decompose the observed traffic data into these two components and essentially to solve:
su ject to rank
This optimization problem is however NP-hard. Based on recent advances in convex optimization theory, it has been proven that the nuclear norm, i.e, the sum of singular values, exactly recovers the low rank component, while the ℓ1 norm, i.e, the sum of absolute values, exactly recovers the sparse component with a
remarkable robustness to the outliers in comparison to the ℓ2 norm. Accordingly, the above optimization
problem can be solved using the Principal Component Pursuit defined as:
su ject to
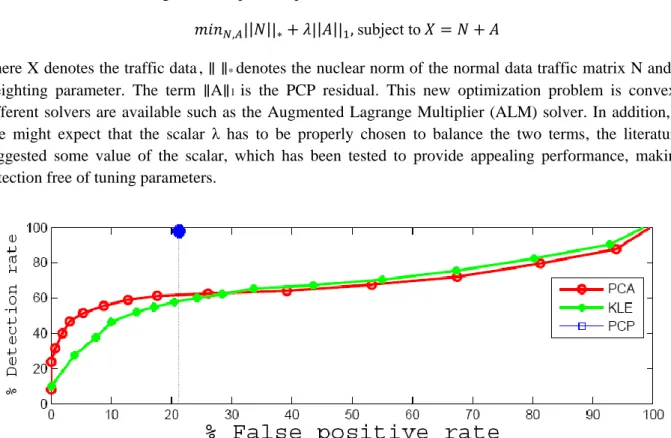
where X denotes the traffic data, ∥∥* denotes the nuclear norm of the normal data traffic matrix N and λ is a
weighting parameter. The term ∥A∥1 is the PCP residual. This new optimization problem is convex, and
different solvers are available such as the Augmented Lagrange Multiplier (ALM) solver. In addition, while one might expect that the scalar λ has to be properly chosen to balance the two terms, the literature has suggested some value of the scalar, which has been tested to provide appealing performance, making the detection free of tuning parameters.
Figure 8. Receiver operating characteristic (ROC) curves of PCA, KLE and PCP
To demonstrate the performance of PCA and KLE versus PCP-based anomaly detection, Figure 8 is presented. It is clear from the figure that PCP has better performance. Particularly PCP experiences a stable performance of 100 % detection rate at a false alarm rate of 21%, compared to 61% detection rate for PCA and 55% for KLE at the same false positive rate, from the considered measurement dataset.
Discussion and Summary
Extensive research has been conducted in the past few years to find effective and well functioning anomaly detection approaches. These approaches can be generally put into three categories, namely visualization based, behavior based, and traffic volume based approaches. In this article, these categories have been briefly discussed, each with a specific approach introduced.
A distinguishing property of visualization ased approaches is that they ena le us to directly “see” a normal network activities in the network. The discussion in this article indicates that with suitable visualization techniques, it is possible to distinguish network anomalies from massive background traffics by using visual patterns to which the human visual perception system is sensitive and can thus process efficiently. In addition, visualization has indeed also been (implicitly) used in the other two categories of approaches, e.g. in Figures 6-8. Conversely, the analytical techniques used in behavior or volume based approaches may be adopted in visualization based approaches for pre-attentive processing, so that the detected anomalies are easily recognized by human perception. A drawback of visualization based approaches is the high requirement on the domain knowledge, e.g. network anomalies, their behaviors, their impact on the measurement data and the interpretation of a visualized view of results, in addition to a deep understanding of the visualization techniques and their use.
Behavior based approaches are typically built upon analyzing traffic feature distributions. One of the main reasons for making use of entropy is its ability to give a compact representation of the distributional changes, capturing a distributional change in a single value. An entropy time series enables to see the changes over time. In addition, by investigating such entropy time series for related traffic features, the type of detected anomaly may be further decided. While the entropy based approach has been shown to be a good option for anomaly detection, its applicability is highly affected how much of the total traffic is due to network anomalies. In fact, the entropy curves in Figure 6 were produced with a very high thinning factor for the normal traffic, that is, significant part of the normal traffic was excluded in the entropy calculation [2]. This implies that for backbone networks where the traffic is huge and the anomaly traffic ratio is relatively low, then careful investigation is needed to apply the entropy based approach.
The most direct volume based approaches, which are solely based on packet / byte / flow count as in Figure 7, have been shown successful in isolating traffic changes. Usually, this requires that the amount of anomaly traffic is significant. However, there are many network scenarios where a large number of anomalies only generate small amounts of traffic compared to the total traffic volume in the network. In addition, if the ratio of anomaly traffic decreases below some threshold, such direct volume based approaches will no longer be effective, the same as for the entropy based approach discussed above. To this end, PCA has been introduced to anomaly detection through traffic measurement. The PCA approach not only provides dimension reduction but also works well for the scenarios where significant traffic volume is less seen. In addition, to further cope with the sensitivity challenge inherent in PCA, the PCP approach has been introduced to network anomaly detection. Recent results show appealing performance of PCP in reaching the goal. Note that PCA and its variations are typically based on matrix analysis where traffic records over time are arranged in such a way that some implicit traffic volume patterns can be subtracted, forming the principal components or subspace to decouple the traffic into normal and abnormal parts. This implies that PCA or PCP analysis is not done for each measurement time bin as opposed to most behavior based or the direct volume based approaches. Consequently, on-line real time application of PCA and PCP approaches for anomaly detection is not straightforward.
In summary, the three discussed categories of network anomaly detection approaches have their advantages and disadvantages. For different purposes, e.g. on-line or off-line analysis, different approaches may be preferred. In addition, combining some of the approaches can give additional benefit to anomaly detection.
References
[1] Zhihua Jin. Visualization of Network Traffic to Detect Malicious Network Activity. Master thesis. Department of Telematics, NTNU. July 2008. (Supervised by Yuming Jiang)
[2] Magnus Ask, and Helge Skrautvol. “Internet Attack Simulation: Empirical Evaluation of the Entropy Boundaries for Network Anomaly Detection”. Project Report, Department of Telematics, NTNU. January, 2011. (Supervised by Yuming Jiang and Atef Abdelkefi)
[3] Atef Abdelkefi, Yuming Jiang, Wei Wang, Arne Aslebo, and Olav Kvittem. “Robust Traffic Anomaly Detection with Principal Component Pursuit”. ACM CoNEXT Student Workshop, Nov 2010.