5326
Feature Extraction In Retinal Images Using
Automated Methods
P. R. Wankhede, K. B. Khanchandani
Abstract— Accurate information of retinal features such as blood vessels, optic disc, and macula helps ophthalmologists for early detection of ocular diseases like diabetic retinopathy and diabetic maculopathy. In this paper, we presented computer aided automated methods for feature extraction in retinal images. Proposed automated methods consist of pre-processing, blood vessels extraction, optic disc segmentation and macula region segmentation. Initially, pre-processing is performed using shade correction and top-hat transformation for enhancement of dark anatomical structures such as blood vessels and macula/fovea region. A novel graph cut method is used to extract blood vessels. Then template based matching and morphological operations are used for detection and extraction of optic disc. Finally, post processing is used for detection of macula in retinal images. Publically available datasets are used for evaluation of proposed automated methods. Experimental results are compared with state-of-art results. Performance analysis of automated methods show that accurate extraction is done by proposed methods. The proposed automated methods will help in finding lesion features and early diagnosis of retinal diseases.
Index Terms— Computer aided diagnosis, blood vessels segmentation, optic disc detection, diabetic retinopathy, graph cut analysis, template matching, Feature extraction.
—————————— ——————————
1 I
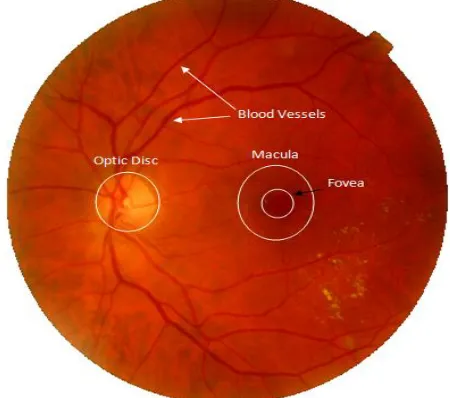
NTRODUCTION Diabetic retinopathy (DR) is a frequent microvascular complication of diabetes mellitus. DR is rare in children in their teenage years. In study 0Error! Reference source not found. observed that DR may develop in almost 85% of patients with diabetes for more than 25 years whereas Diabetic maculopathy is present in 15% of patients with diabetes for more than 15 years. When diabetes detected in patients one third of them are diagnosed with mild retinopathy and diabetic maculopathy can occur in nearly 25% of patients. DR can develop in 80% patients with type II diabetes after 15 to 20 years [2]. Screening is an effective way for early detection of ocular diseases. Automated ophthalmic screening programs can save national health care budget by few hundred millions of dollar. In US, automated screening programs can save 400 million USD per year [3]. In developing countries like India, this huge amount of budget savings will have significant impact on national economy and development of country [4]. Digital screening of DR results in generation of large number of retinal images to be manually analyzed by an ophthalmologist. Sometime these images are unevenly or non-uniformly illuminated. This often leads to observer fatigue and increase in the time taken for diagnosis. In automatic eye screening programs, the localization and segmentation of anatomical landmarks (Fig.1) such as blood vessels, OD, fovea and macula in retinal images help to detect the presence of diseases [5]. Blood vessels usually have small curvatures and look like anti-parallel pairs. Since the vessels have lower reflectance compared to the other retinal surfaces, they appear darker relative to the background [6]. The blood vessels information can be used in grading severity of disease or as a part of the process of automated diagnosis of diseases like age related macular degeneration and glaucoma [7] and diabetic retinopathy [8]. Blood vessels act as a landmark forlocalizing other features of retinal images as optic disc [9], [10][11] and the fovea [12]. The blood vessels also used for benchmark for feature point selection for retinal image registration.
Fig 1 Retinal image with anatomical features such as blood vessels, optic disc, macula and fovea
The OD in a healthy retinal image usually appears as a bright yellowish and elliptical object marked by dark surface vessels. In the presence of diseases in OD, neovascularization occurs from DR or cup size change due to glaucoma. Automated detection of optic disc (OD) is important for early detection of glaucoma. Disc size, neuro-retinal rim and cup area features are used for the assessment of glaucoma [13]. OD consist of cup and vessel origin (VO). The VO position is an important reference point for detecting the macula, and thereby grading macular pathologies such as diabetic maculopathy, macular edema and macular ischemia [14]. Also, automated OD detection plays an important role in developing automated “diagnosis expert systems” for diabetic retinopathy (DR), as its segmentation is a key component to correctly identify other bright features in the images such as the bright lesions (hard exudates or cotton-wool spots). Besides the position of the OD, the VO seed point is another important feature of a fundus image that is needed for vessel tracking methods to
————————————————
P. R. Wankhede is working as Asst. Prof. in Electronics and Telecomm. Engg. Department, SSGM College of Engineering, Shegaon, Maharashtra - 444203 India. E-mail: [email protected]
5327
detect vessel features like vessel tortuosity and vessel branching patterns [15].
Fig 2: Optic Disc on retinal image with various important features such as vessel origin and cup
The macula is a depression in the center of macular region. The area of macula appears darker in a color retinal image. It is located temporal to the optic disc and has no presence of blood vessels in its center. The deepest are of macula is called as fovea which is responsible for discriminating sharp details such as reading and writing. Lesion features like exudates present in macular region indicate a development of disease called maculopathy; this may lead to vision loss [16]. The presence of exudates near to macular region decides the severity of diabetic maculopathy Therefore, it is essential to detect and mark the macular region in a retinal image for automated detection of bright features [17]. Various methods have been proposed in literature for detection and segmentation of blood vessels, optic disc and macula with fovea region in retinal images using computer aided automated approach. In this paper, automated methods are proposed for feature extraction from retinal images with more accuracy and less time as compared to results presented in literature. Section 2 details the methodology used for the segmentation of various anatomical features. Section 3 provides experimental results and performance analysis with the state-of-art methods results. Finally, section 4 discusses conclusion of the proposed research work.
2 M
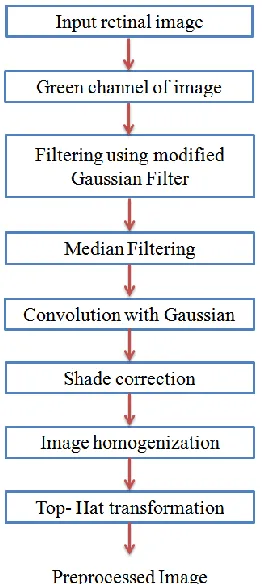
ETHODOLOGYThe proposed approach for automatic feature extraction from retinal image is shown in figure 3. Initially, we applied mean filter, convolution by Gaussian kernel, shade correction and top-hat transformation as preprocessing steps for enhancement of blood vessels in green channel of retinal image. Green channel provides best contrast between blood vessels pixels and background pixels. It significantly enhance retinal image while suppress the noise and non-vessel structures keeping vessel information. Modified Gaussian filter is used to suppress the central light reflection in blood vessels. Then vascular structure is extracted using a novel graph cut method for automatic segmentation of blood vessels. The pre-processed retinal image is used for optic disc detection. Histogram based template matching method is used to accurately detect and segment optic disc in retinal images. The information of blood vessels and optic disc center is used
for macula region detection and segmentation.
Fig. 3: proposed automated approach for feature extraction from retinal images
2.1 Pre-processing
The preprocessing steps in retinal image processing should remove non-uniform illumination and contrast of dark and bright features be enhanced. The method proposed in [18] is used to develop proposed pre-processing steps as shown in Figure 4. To remove central reflection considering intensity profile of vessel, a modified Gaussian function [19] is designed as shown in Figure 5. New Gaussian filter in (1) is used to describe vessel profile considering central light reflection from x (left to right) direction. Values of1and2are selected as 6-10 pixels and 2-4 pixels based on images used from different datasets. This modified Gaussian filter is applied on green plane of retinal image.
2 1 2 1
2 2 2 2
( )
2
1 1
( )
2
2 2
,
( )
x m
e x m
e
A
I
x
P x Q
f x
A
I
P
x Q
5328 Fig 4:Pre-processing to reduce non-uniform illumination
and contrast enhancement
Then, a mean filter is applied to smooth occasional salt-and-pepper noise. Further noise smoothing is performed by convolving the resultant image with a Gaussian kernel
( , )
NS ORG
I conv I h of dimensions m × n = 9 × 9, mean μ = 0 and variance σ = 1.8 which generates smoothed imageINS. The Gaussian kernel is defined as:
2 2
2
( )
2
( , )
m n
g
h m n
e
(2) where the two dimensional Gaussian kernel h is defined as:
1 1( , )
( , )
( , )
gn m
g
i j
h m n
h m n
h m n
(3)
Secondly, a background imageIB, is produced by applying a
69x69 mean filter. Then, the difference D between INS and IB
is calculated for every pixel
D = I − I (4) Finally, a shade-corrected image I is obtained by transforming linear intensity values into integers covering the whole range of possible gray-levels 0-255. The shade-corrected image I reduces background intensity variations and enhances contrast in relation to the original green channel image. Image homogenization is used to transform intensity of pixels towards middle of histogram. Then finally top-hat transformation [20] is used to enhance the contrast of retinal image.
The top-hat transformation is given by
I = I − γ(I ) (5)
where 𝐼 is the homogenized image and I complement of homogenized image while γ denotes the opening operation using disk of eight pixels. Thus, while bright retinal structures are removed (i.e., optic disc, possible presence of exudates or reflection artifacts), the darker structures remaining after the opening operation become enhanced (i.e., blood vessels, fovea, possible presence of microaneurysms or hemorrhages)
Fig. 5: Modified Gaussian filter for removing central light reflection of blood vessels from retinal images
TABLE1
NEW GAUSSIAN FUNCTION VARIABLES
Variable Description
A1 Height of the Gaussian
m1 Peak position of Gaussian
σ1 Gaussian width
A2 Height of central reflection
m2 Peak position of central reflection
σ2 Gaussian width distribution of central reflection
I1 Intensity of nearest retinal background
I2 Minimum intensity in profile
Q Left minimum position on intensity profile
P Right minimum position on intensity profile 2.2 Blood Vessel Extraction
A graph cut formalism [21] is well suited for segmentation of blood vessels from retinal images. A graphG(v,
)is defined as a set of nodes (pixels) vand a set of undirected edges
that connect these neighboring nodes of set of pixels P and N called as “foreground” terminal (source S) and a“background” terminal (sink T), are included in a graph.
Let define the discontinuity between neighbouring pixels p and q, an ad-hoc function B{p,q}can be used.
2
( ) 1
exp
{ , } 2 ( , )
2
Ip Iq B p q
dist p q
(6)
The first term in (6) show that, B{p,q} will result more for discontinuities between pixels of similar intensities, |Ip-Iq|< σ
and its value is small if pixels have very different intensities |Ip
-Iq | > σ. The second term shows, B{p,q} has large value when distance between p and q is less. Therefore, it results in distribution of pixels other than object and background, σ, among neighboring pixels of an image.
If we consider a binary vector A=(A1,…,Ap,…,A|P|), where Ap
5329
“background” means binary vector A represents the
segmentation. A cost function E(A) can be defined to impose constraints on boundary and region properties of A is:
E(A) =λ • R(A)+B(A) (7) where R A( ) Rp(Ap)
p P
(8)
( ) { , } ( , ) ,
B A Bp q A Ap q
p q N
(9) where,
(Ap,Aq)=1 forAp Aqotherwise its value is 0.The constant coefficientspecifies relative importance of the regional properties term R(A) versus the boundary properties term B(A) of segmentation A. R(A) assigns intensity of pixel p to object region Rp(OBJ) or background region Rp(BKJ) i.e. it fits the intensity p into known intensity histogram of object and background.To distribute object and background graph, it must be cut properly and to find the optimum segmentation of image, weights can be assigned to edges in
with predefined weights.
(a) (b)
(c) (d)
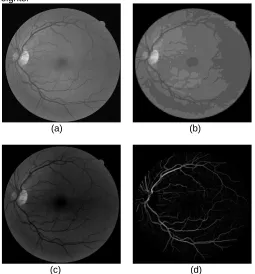
Fig 6: Preprocessing results (a) Green channel of retinal image (b) Shade-corrected image (d) Homogenized image (f) Vessel enhanced image
(a) (b)
(c)
Fig. 7: Segmentation of blood vessels using graph cut method (a) Input retinal image from DRIVE database[22], (b) First observer ground truth, and (c) Segmentation using graph cut method
2.3 Optic disc detection and segmentation
The size of OD in a retinal image depends on field of view (FOV) used by the camera and resolution of images. Each dataset is having unique camera with fixed FOV and resolution, hence their region of interest for OD is having same area. We proposed an approach for calculation of OD diameter in pixels and therefore the OD ROI. This OD ROI can be used as template for matching purpose in further processing. OD Template ROI can be selected using:
1. Calculate image footprint IFPusing (10),
FOV FP
FOV
A I
N (10) where, AFOVis the imaging area of the specific FOV and
FOV
N is number of pixels in the FOV.
2. Calculate the OD radius in pixelsROD,
2 / 2
/ FP OD
OD OD
FP D
A I
R
I (11)
where,AFOV= 124.8 mm2, 2
( / 2)
OD OD
A D , andDOD
=1.85mm
(the diameter of average human optic nerve head)
3. Calculate of OD ROI ROIODof rectangle size using,
( 2 * ) ( 2 * )
OD OD OD
ROI L R L R (12)
where, L is value of extra pixels beyond the perimeter of the OD to include exact OD area.
The size of retinal image in DRIVE is 768×584 pixels. We can estimate the OD radius using (11) as 55. To include exact OD region, select L=25 which estimates the size of OD template rectangle of size 80×80. Similarly, OD templates for various datasets can be calculated.
TABLEII
RECTANGLE SIZE FOR THE SELECTION OF ODROI
Database Image Size OD ROI
(Rectangle Size)
DRIVE [22] 768×584 80×80
STARE [23] 605×700 140×140
DIARTDB0 [24] 1500×1152 190×190
DIARTDB1 [25] 1500×1152 190×190
5330 MESSIDOR Part III [26] 2304×1536 250×250
The RGB planes of OD region were separated and their histogram calculated and stored as a template. Average of multiple templates is used as final OD template for template matching. Cross-correlation is performed between the OD template and retinal image. The weighted sum function presented in [27] is used to find the similarity of histograms as shown below:
C i j( , ) a CR b CG c CB (13)
where C i j( , )is the center of the template, C CR, Gand CB
are Correlation Similarity Index (CSI) defined as:
2
1
(1
1
( )
= i i i i
i i
i i
T I
C
T I
T I
(14)where iR G, andBcolor planes.TiandIiare color plane histograms of the template and retinal image respectively.
Similarity indexCiis 1 for similar histogram between moving template and retinal image otherwise its value is less than 1. Whereasa b, and care the weights assigned to the similarity index CR, CG and CB respectively. The contribution of Green plane, Blue plane and Red plane in contrast is highest, medium and lowest respectively. We selected the best values of a1, b0.5andc0.25for accurate OD detection.
(a) (b) (c)
Fig. 8: Optic disc location detection (a) sample optic disc template from DRIVE database (b)(c) optic disc correctly detected on retinal image.
Once the OD center is detected, rectangle patch containing OD is used for OD segmentation. As blood vessels emerge from the optic disc, they intervene in the process of OD segmentation. A red plane of OD patch gives more contrast at OD level. A morphological closing operation with disk shaped structuring element of size 10-15 pixels is used on red plane of OD patch to smooth the blood vessels. Closing operation discard dark structures like blood vessels of width 10-15 pixels and keep line between OD region and background region. Then Otsu’s thresholding [20] is used to convert image into binary image. The thresholding level controls boundary shape of OD. Through experimentations we have chosen thresholding level of 0.92 value.
(a) (b) (c)
Fig 9: OD segmentation (a) Input OD patch segmented from OD detection (b) Eroded image with disk structuring element of size 15x15(c) OD segmented after thresholding.
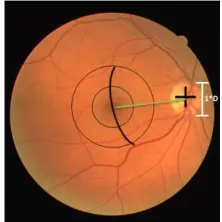
2.4 Macula region detection
A macula is dark region in retinal images and easily observed from some distance to optic disc. The presence of bright and/or dark lesion features near to macula makes it difficult to locate macular region. But macula is located in retinal image at some fixed distance and position to the optic disc. Once the center of optic disc is detected then using constant distance and angle parameters macula can be detected. Then searching of darkest area within fixed distance from optic disc, macula can be detected.
Fig. 10: Macula distance and angle from optic disc center
We have found that if the images having more pathological lesion features like hard exudates or hemorrhages on macula region then proposed method fails to detect macula.
Fig. 11: Macula region detection from center of optic disc
3 E
XPERIMENTALR
ESULTS 3.1 Datasets5331
below.
TABLEIII
COMPARISON OF PUBLICALLY AVAILABLE DATASETS USED FOR
EVALUATION OF PROPOSED AUTOMATED METHODS
Database Camera used FOV No. of Images
Image
Format Image Size
DRIVE Canon CR5 CCD
camera 45 40 JPEG 768×584
STARE Topcon TRV-50
camera 35 400 PPM 605×700
DIARETDB0 digital fundus
camera 50 130 PNG 1500x1152
DIARETDB1 digital fundus
camera 50 89 PNG 1500×1152
MESSIDOR
Topcon TRC NW6 non-mydriatic
camera
45 1200 TIFF
1440×960, 2240×1488, and 2304×1536
3.2 Pre-processing Results
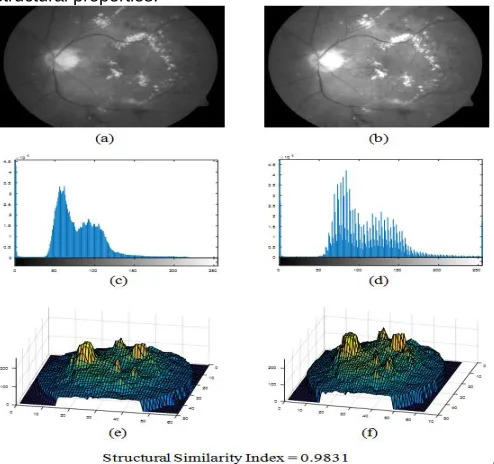
The performance of pre-processing evaluated based on visual observations, histogram distribution and image quality after preprocessing. To measure the image quality Structural Similarity Index Measure (SSIM) is used. SSIM is quality assessment index based on luminance, contrast and structural properties of processed image when compared with reference or input image. From the pre-processing, it is expected that the structural properties of normal or abnormal features of retinal image should not change. So if SSIM index is close to “one” means structural properties of features are not changed but if SSIM index is close to “zero” means huge change in structural properties of features which may lead to misidentification of features by segmentation algorithms. Sample result of preprocessing is shown in fig. 12. It shows use of pre-processing on green channel of retinal image. Comparison is provided to check the visual observations, histogram distribution of original image and enhanced image. Surf plots shows bright and dark structures significantly enhanced in processed image. The SSIM between original image and processed image is found to be 0.9831 which is almost “one”. This shows that the structural properties of original image are not changed. The results show that our proposed pre-processing method is able to enhance retinal images efficiently keeping same structural properties.
Fig. 12: Comparison of structural properties of green channel with preprocessed image from DIARETDB database (a) Green channel (b) image processed with normalization and contrast enhancement (c)–(d) histogram of input image and pre-processed image respectively (e)–(f) Surf plot showing changes in bright
and dark pixels
3.3 Blood vessels extraction
The performance of retinal vessel segmentation algorithms can be evaluated from three performance measures sensitivity, specificity and accuracy. These performance measures provide information about how well is the automated segmentation algorithm with respect to ground truth segmentation results of dataset images. The performance of the proposed method in terms of performance measures is evaluated on 20 test and 20 training images of DRIVE database and 20 test images of STARE database. These images are from subjects with diabetes, both with and without retinopathy. The performance comparison with ground truth results is shown in Table IV. The proposed graph cut method achieved 96.26% and 95.64% accuracy on DRIVE and STARE database respectively. The specificity measures are also comparable with performance of the second human observer. The proposed method is able to detect background pixels well and do not consider them as vessel pixels. The sensitivity achieved by our proposed method goes high as 74% due to less segmentation of thin blood vessels whose dark reflectance is less as compared to background of retinal image. The execution time of proposed method is 3.32 seconds and 4.23 seconds on DRIVE and STARE dataset images.
TABLEIV
PERFORMANCE RESULTS OF PROPOSED METHOD FOR BLOOD
VESSELS EXTRACTION
Database Segmentation
Method Sensitivity Specificity Accuracy
DRIVE
2nd human
observer 0.7761 0.9725 0.9473 Carmen Lupas et
al [8] 0.6728 0.9874 0.9597 Aquino et al [18] 0.7061 0.9801 0.9452 Soares J.V. B. et al
[29] 0.7330 0.9780 0.9466
Proposed method 0.7261 0.9806 0.9626
STARE
2nd human
observer 0.9024 0.9304 0.9356 Soares J. V. B. et
al [29] 0.7200 0.9750 0.9480 Perfetti et. al. [30] 0.9030 0.9390 0.9650
Proposed method 0.7064 0.9796 0.9564
3.3 Optic disc detection and segmentation
5332
successful detection. In many cases detected OD center is slightly deviate from exact center of OD, to include such cases as successful detection, 10% error neglected. Our proposed method is more prominent to detect OD center and OD region, if OD is clearly visible within the FOV of retinal image. The proposed method is able to achieve both success rate and accuracy of 100% for OD detection in normal retinal images for all publicly available databases. The proposed method correctly detected the OD in 38 images of DRIVE, 280 images of STARE, 120 images of DIARETDB0, 79 images of DIARETDB1 1063 images of MESSIDOR, 43 images of E-optha Ex, and 143 images of E-E-optha MA, achieving success rate of 95%, 70%, 92.3%, 88.79%, 88.53%, 91.5% and 96.62% respectively.
TABLEV
IMAGE BASED SUCCESS RATE OF PROPOSED METHOD FOR OD
DETECTION
Database Successful Cases
Failure Cases
Success Rate
Execution Time (s)
DRIVE 38 02 95.00% 16.3
STARE 280 120 70.00% 20.6
DIARETDB0 120 10 92.30% 24.4
DIARETDB1 79 10 88.76% 24.4
MESSIDOR 1184 16 98.67% 43.0
E-optha EX 43 04 91.49% 36.2
E-optha MA 143 05 96.62% 35.8
The proposed method is even able to detect OD in pathological retinal images. There are cases where proposed approach is not able to detect OD. The missing of OD is due to advance stage of diabetic retinopathy and myelinated nerve fibers adjacent to the OD, which was much brighter. Many images in STARE database are badly illuminated and complex in nature so performance of proposed method degraded. Execution time of proposed method for OD detection depends on size of retinal images. In most of earlier methods an image resizing is used, due to this their execution time is less. As we are using complete image as it is, the time taken by our proposed method is comparable and found to be 29 seconds in average. Table V shows success rate of OD detection in different databases and execution time for proposed method.
4 C
ONCLUSIONIn this paper, we have presented automated methods for blood vessels segmentation, OD region segmentation, and macular region segmentation. Graph cut method is used for blood vessels segmentation. The complete retinal image is divided into nodes and edges while minimization function is used to find best vessel map. The results show that the presented method is efficiently detecting blood vessels. A template matching algorithm based on histogram of rectangular region of interest template is used for detection of optic disc region in retinal images. A set of optic disc templates are used to create histogram based template. After segmentation of optic disc region, morphological techniques are used for optic disc segmentation. Center of optic disc aids to find macular region in retinal images. The features extracted using automated methods can assist in detection of abnormalities in retinal images, diagnosis of glaucoma related ocular diseases and in severity grading systems.
A
CKNOWLEDGMENTThe authors wish to thank Research Center, SSGM College of Engineering, Shegaon for providing infrastructure for development and testing proposed methods. We would like also thanks to Badhe Eye Care Hospital for evaluating results of proposed methods.
R
EFERENCES[1] American Diabetes Association, “Diagnosis and classification ofdiabetesmellitus”, Diabetes Care, Vol. 32 Supplement, pp S62-S67, Jan 2009. doi:10.2337/dc10-S062
[2] Sarah Wild, Richard Sicree, et.al. “Global prevalence of diabetes: estimates for the year 2000 and projections for 2030”, Diabetes Care, Vol. 27, No. 5, pp 1047–1053, May 2004, doi:10.2337/diacare.27.5.1047
[3] Centers for Disease Control and Prevention, “The economic impact of adult visual disorders in the united states”, [Online] Available:http://www.cdc.gov/visionhealth/publications/economic_i mpact.htm
[4] Ramasamy K., Raman R., Tandon M., “Current state of care fordiabeticretinopathy in india”, Current Diabetes Report, Vol.13, pp 460-468, 2013. doi:10.1007/s11892-013-0388-6
[5] I. Akram and A. Rubinstein, ‘‘Common retinal signs. An overview”,Optometry Today, Jan. 28, 2005. [Online] Available:https://www.aop.org.uk/
[6] Subhasis Chaudhuri, Shankar Chatterjee, Norman Katz, Mark Nelson, Michael Goldbaum, “Detection of blood vessels in retinal images using two-dimensional matched filters”, IEEE Transactions
on Medical Imaging, Vol. 8 No. 3, Sept 1989,
doi:10.1109/42.34715
[7] M. Foracchia, E. Grisan, and A. Ruggeri, “Detection of optic disc in retinal images by means of a geometrical model of vesselstructure,” IEEE Transactions on Medical Imaging, vol. 23, no. 10, pp. 1189–1195, Oct. 2004, doi:10.1109/TMI.2004.829331 [8] Carmen Alina Lupas¸ Domenico Tegolo, and Emanuele Trucco,
“FABC: Retinal vessel segmentation using AdaBoost”, IEEE Transactions on Information Technology in Biomedicine, vol. 14, no. 5, pp.1267-1274, Sep 2010, doi:10.1109/TITB.2010.2052282 [9] A. A. H. A. R. Youssif, A. Z. Ghalwash, and A. R. Ghoneim,
“Opticdisc detection from normalized digital fundus images by meansofavessels’ direction matched filter,” IEEE Transactions on Medical Imaging, vol. 27, no.1, pp. 11–18, Jan. 2008, doi:10.1109/TMI.2007.900326
[10] A. Aquino, M. E. Gegúndez-Arias, and D. Marín, “Detecting theopticdisc boundary in digital fundus images using morphological, edge detection and feature extraction techniques,”
IEEE Transactions on Medical Imaging, vol. 29, no. 11, pp. 1860– 1869, Nov. 2010, doi:10.1109/TMI.2010.2053042
[11] H. Li and O. Chutatape, “Automated feature extraction in color retinalimages by a model based approach,” IEEE Transactions on Biomedical Engineering, vol. 51, no. 2, pp. 246–254, Feb. 2004, doi:10.1109/TBME.2003.820400
[12] María García, Clara I. Sánchez, María I. López, Ana Díez, Roberto Hornero, “Automatic Detection of Red Lesions in Retinal Images Using a Multilayer Perceptron Neural Network”,
30th Annual International IEEE EMBS Conf, Canada, pp 5425-5428, Aug 2008, doi:10.1109/IEMBS.2008.4650441
[13] Joshi G. D., Sivaswamy J., and Krishnadas S. R., “Optic disk andcupsegmentation from monocular color retinal images for glaucoma assessment,” IEEE Transactions on Medical Imaging, Vol. 30, No. 6, pp. 1192–1205, Jun. 2011, doi:10.1109/TMI.2011.2106509
5333
Medicine, Vol. 32, No. 1, pp. 19–25, March 2007, doi: 10.1080/14639230601095865
[15] Aquino A., Gegundez-Arias M., and Marin D., “Detecting the optic disc boundary in digital fundus images using morphological, edge detection, and feature extraction techniques,” IEEE Transactions on Medical Imaging, Vol. 29, No. 11, pp. 1860–1869, Nov 2010, doi:10.1109/TMI.2010.2053042
[16] Hammes H. P., K. D. Lemmen, B. Bertram, “Diabetic RetinopathyandMaculopathy,” Experimental and Clinical Endocrinology & Diabetes, Vol. 122, pp 387–390, 2014, doi:10.1055/s-0034-1366292
[17] Deepak K.S., Sivaswamy J., “Automatic assessment of macular edema from color retinal images”, IEEE Transactions on Medical
Imaging, Vol. 31, No. 3 pp 766 –776, 2012,
doi:10.1109/TMI.2011.2178856
[18] Aquino A., Marin D., Gegundez-Ariaz M. E., and Bravo J. M., “Anewsupervised Method for blood vessel segmentation in retinal images by using gray level and moment invariants-based features”, IEEE Transactions on Medical Imaging, Vol. 30, No. 1, pp 146-158, Jan 2011, doi:10.1109/TMI.2010.2064333
[19] Li H., Hsu W., Lee M. L., and Wong T. Y., “Automatic Grading of Retinal Vessel Caliber”, IEEE Transactions on Biomedical Engineering, Vol. 52, No. 7, pp 1352-1355, July 2005, doi:10.1109/TBME.2005.847402
[20] Edward R. Dougherty, An introduction to morphological image processing, SPIE Optical Engineering Press, 1992
[21] Boykov Y. and Funka-Lea G., “Graph cuts and efficient N-D imagesegmentation”, International Journal of Computer Vision, Vol. 70, No. 2, pp.109-131, 2006, doi:10.1007/s11263-006-7934-5 [22] Staal J.J., Abramoff M.D., Niemeijer M., Viergever M.A., Ginneken
B. van, “Ridge based vessel segmentation in color images of the retina”, IEEE Transactions on Medical Imaging, Vol. 23, pp. 501-509, 2004, doi:10.1109/TMI.2004.825627
[23] Hoover, A. D., Kouznetsova V. L., and Goldbaum M., “Locating blood vessels in retinal images by piecewise threshold probing of a matched filter response”, IEEE Transactions on Medical Imaging, Vol. 19, 2000. doi:10.1109/42.845178
[24] Kauppi, T., Kalesnykiene, V., Kamarainen, J.-K., Lensu, L., Sorri, I., Uusitalo, H., Kälviäinen, H., Pietilä, J., “DIARETDB0: Evaluation Database and Methodology for Diabetic Retinopathy Algorithms”, Technical report, 2006
[25] T. Kauppi, V. Kalesnykiene, J.-K. Kmrinen, L. Lensu, I. Sorri, A. Raninen, R. Voutilainen, H. Uusitalo, H. Klviinen, and J. Pietil, “Diaretdb1 diabetic retinopathy database and evaluation protocol,”
Proc. of the 11th Conf. on Medical Image Understanding and Analysis, pp. 61–65, 2007. ISBN1901725332
[26] Decencière et al., “Feedback on a publicly distributed database: the MESSIDOR database”, Image Analysis & Stereology, Vol. 33, No. 3, pp 231- 234, Aug 2014, doi:10.5566/ias.1155
[27] Amin Dehghani, Hamid Abrishami Moghaddam and Mohammad-Shahram Moin, “Optic disc localization in retinal imagesusinghistogram matching,” EURASIP Journal on Image
and Video Processing, 2012:19, pp. 1 to 11, 2012,
doi:10.1186/1687-5281-2012-19
[28] Decencière E, et al. “TeleOphta: Machine learning and image processing methods for tele-ophthalmology”. IRBM, 2013
[29] Soares J. V. B., Leandro J. J. G., Cesar R. M, H. F. Jelinek., and Cree M. J., “Retinal vessel segmentation using the 2-D Gabor wavelet and supervised classification”, IEEE Transactions on Medical Imaging, Vol. 25, No. 9, pp. 1214–1222, 2006, doi:10.1109/TMI.2006.879967
[30] R. Perfetti, E. Ricci, D. Casali, and G. Costantini, “Cellular neural networks with virtual template expansion for retinal vessel segmentation,” IEEE Transactions on Circuits and Systems II:
Express Briefs, vol. 54, no. 2, pp. 141–145, 2007,