ANALYSIS OF GENE EXPRESSION IN NORMAL
AND NEOPLASTIC KERATINOCYTES
RYAN O’SHAUGHNESSY
UNIVERSITY COLLEGE LONDON
AND
IMPERIAL CANCER RESEARCH FUND
Thesis presented for the degree of
Doctor of Philosophy
In the University of London
September 2000
Internal Supervisor: Dr Fiona M Watt
ProQuest Number: U643597
All rights reserved
INFORMATION TO ALL USERS
The quality of this reproduction is dependent upon the quality of the copy submitted.
In the unlikely event that the author did not send a complete manuscript and there are missing pages, these will be noted. Also, if material had to be removed,
a note will indicate the deletion.
uest.
ProQuest U643597
Published by ProQuest LLC(2016). Copyright of the Dissertation is held by the Author.
All rights reserved.
This work is protected against unauthorized copying under Title 17, United States Code. Microform Edition © ProQuest LLC.
ProQuest LLC
789 East Eisenhower Parkway P.O. Box 1346
Abstract
The epidermis is a constantly renewing tissue. Cells in the basal layer of the epidermis
terminally differentiate and are shed as dead squames. The cells responsible for
controlling this constant renewal are known as stem cells. Alterations of these stem cells
can lead to neoplasms such as basal cell carcinoma. I used differential hybridisation, a
technique that allows the analysis of changes in expression of a large number of genes
simultaneously, to find differences in gene expression between basal cell carcinoma
tissue and normal skin. Two genes, MRP-14 and 8, were found to be upregulated in basal
cell carcinoma. Consistent with the link between expression of these genes and
hyperplasia, the epidermis over the basal cell carcinoma expressed high levels of these
genes.
Improvements I made in the differential hybridisation method allowed elucidation of the
differences between stem cells and cells with lower proliferative potential in vitro.
Careful analysis revealed no changes in gene expression greater then two fold. One gene,
the epidermal fatty acid binding protein, E-FABP, showed higher levels in transit cells.
Antibody studies revealed E-FABP expression is reduced in the regions of the epidermis
thought to house the stem cells.
Finally the expression of a potential marker of stem cells, the melanoma specific
chondroitin proteoglycan, MCSP, was examined in vitro and in vivo. Antibody studies
revealed expression of the protein only above the dermal papillae of cross sections of
epidermis. Fluorescence activated cell sorting revealed a population of basal
kératinocytes that are both MS CP positive and express high levels of the (31 integrin, a
Table of Contents
Title 1
Abstract 2
Table of Contents 3
List of Figures 8
List of Tables 10
Abbreviations 11
Dedication 15
Acknowledgements 16
Publications 17
Chapter 1 Introduction
1.1 Overview 18
1.2 Differential Gene Expression analyses 18
1.2.1 A Brief History of Arrays 19
1.2.2 Performing an Array Hybridisation 21
1.2.3 Analysis of Differential Hybridisation Data 25
1.2.4 Confirmation of Differential Gene Expression 27
1.2.5 Other Methods of Determining Differential Gene Expression 27
1.2.6 Towards Functional Genomics - The Future of Array Hybridisation 30
1.3 The Epidermis 31
1.3.1 The Basal Layer, Basement Membrane and Integrins 33
1.3.2 The Spinous Layer 34
1.3.3 The Granular Layer 34
1.3.4 The Comified Layer 34
1.4 Two Cancers of the Epidermis: BCC and SCC 35
1.4.1 Basal Cell Carcinoma 35
1.4.2 Genetic Predispositions to BCC 37
1.4.3 Squamous Cell Carcinoma 39
1.5 Keratinocyte Stem Cells 42
1.5.3 Other Integrins as Stem Cell Markers 45
1.5.4 Other Potential Markers of Stem Cells 46
1.5.5 Stem Cell Patterning 48
1.5.6 Whole Mount Staining of Human Epidermis 49
1.5.7 Control of Stem Cell Fate 49
1.6 Aims 55
Chapter 2 Materials and Methods
2.1 Molecular Biology 56
2.1.1 Materials and Solutions 56
2.1.2 Agarose Gel Electrophoresis 59
2.1.3 Vectors, Plasmid Preparation and Restriction digestion 59
2.1.4 Subcloning Techniques 59
2.1.5 Transformation of Plasmid DNA 60
2.1.6 Sequencing 60
2.1.7 Southern Blotting and Hybridisation 60
2.1.8 Northern Blotting and Hybridisation 62
2.1.9 RT-PCR 63
2.1.10 In Situ Hybridisation 64
2.2 Differential Hybridisation 65
2.2.1 Arrayed cDNA Library Filters 65
2.2.2 Hybridisation of Arrayed Keratinocyte Filters 65
2.2.3 Hybridisation of Arrayed Unigene Filters 66
2.3 Cell Culture 67
2.3.1 Materials and Solutions 67
2.3.2 General Culture Conditions 69
2.3.3 Freezing and Thawing of Cell Stocks 69
2.3.4 Culture of J2-3T3 and J2-puro 70
2.3.7 Clonogenicity Assays 72
2.4 Immunostaining 74
2.4.1 Materials and Solutions 74
2.4.2 Antibodies 75
2.4.3 Immunofluorescence Staining of Frozen Sections 76
2.4.4 Immunohistochemical Staining of Paraffin Sections 77
2.4.5 Immunofluorescence Staining of Cultured Kératinocytes 77
2.4.6 BrdU Incorporation and Nuclear counterstaining 78
2.4.7 Immunostaining of Wholemount Epidermis 78
2.5 Flow Cytometry 80
2.5.1 Materials and Solutions 80
2.5.2 FACS Analysis of MCSP and pi Integrin 80
2.5.3 FACS Analysis of E-FABP 80
2.5.4 Sorting of Producer Cells and Kératinocytes Expressing GFP 81
2.5.5 Sorting to Enrich for Stem and Transit Amplifying Cells 81
2.5.6 Staining and Sorting of kératinocytes expressing pi Integrin and MCSP 81
2.6 SDS-PAGE Electrophoresis and Western Blotting 83
2.6.1 Materials and Solutions 83
2.6.2 Preparation of SDS-PAGE gels 84
2.6.3 Extraction of Triton Soluble Proteins and Measurement of Protein
Concentration 85
2.6.4 SDS-PAGE Electrophoresis 85
2.6.5 Western Blotting 86
Chapter 3 Detection of differentially expressed genes in Basal Cell
Carcinoma and Skin samples
3.1 Introduction 87
3.4 Evaluation of the Hybridisations 89
3.5 Determination of Differentially Expressed Genes 90
3.6 MRP-8 and MRP-14 mRNA are Overexpressed in BCC Samples 93
3.7 Expression of MRP-14 protein in Epithélia and Cultured Kératinocytes 93
3.8 Distribution of MRP-8 and MRP-14 Transcripts 94
3.9 Discussion 95
Chapter 4 The Epidermal Fatty Acid Binding Protein, a Novel Transit
Amplifying Cell Marker Revealed by cDNA Array Hybridisation
4.1 Introduction 107
4.2 Unigene Filter Construction 107
4.3 Differential Hybridisation 108
4.4 Results of the Differential Hybridisation 109
4.5 Expression of E-FABP in Other Tissues, Epidermis and
Cultured Kératinocytes 111
4.6 Construction of Producer Cells Overexpressing E-FABP 113
4.7 Analysis of Kératinocytes Overexpressing E-FABP 114
4.8 Discussion 115
Chapter 5 The Melanoma Chondroitin Sulphate Proteoglycan, A
Potential Stem Cell Marker in Human Epidermis
5.1 Introduction 128
5.2 Structure and Possible Functions 128
5.3 Expression of MCSP m v/vo 129
5.4 Expression of MCSP in Cultured Kératinocytes and WholeMount
Epidermis 130
5.5 FACS Analyses of MCSP expression 131
5.6 Clonogenic Properties of MCSP Positive Cells 131
Chapter 6 Final Discussion
6.1 Markers of BCC and Stem Cells 143
6.2 Activation of the Hedgehog Pathway in BCC Formation 143
6.3 Limitations of Differential Hybridisations on Arrays 144
6.4 Further Work 145
6.5 The Future 148
List of Figures
Figure 1.1 Differential hybridisation experiments 23
Figure 1.2 Histogram and scatter plot 26
Figure 1.3 The human epidermis 32
Figure 1.4 BCC and SCC 36
Figure 1.5 The patched pathway in humans 38
Figure 1.6 Populations of the interfollicular keratinocyte lineage 43
Figure 1.7 Stem and transit amplifying cell markers 47
Figure 1.8 Stem cell patterning in the epidermis 50
Figure 1.9 Factors that determine stem cell fate 54
Figure 3.1 Overview of the Xdigitise program 98
Figure 3.1 Demonstration of the principle of the Cgen analysis program
using a mock-up of hybridisation results 99
Figure 3.3 Cgen analyses 100
Figure 3.4 Results of the analysis of the normalised hybridisations 101
Figure 3.5 Confirmation of the differential expression of MRP-8 and
MRP-14 by RT-PCR 102
Figure 3.6 Immunohistochemistry of BCCs 103
Figure 3.7 Immunhistochemistry of SCC and normal squamous epithelia 104
Figure 3.8 Immunofluorescence studies on epidermis and cultured
kératinocytes 105
Figure 3.9 In situ hybridisation 106
Figure 4.1 FACS profiles for the separation of basal cells 118
Figure 4.2 Hybridisation of the Unigene filters 119
Figure 4.3 Cgen profiles of stem cell versus transit amplifying cell
comparisons 121
Figure 4.4 Northern hybridisation analyses 122
Figure 4.5 Immunofluorescence staining of kératinocytes 124
Figure 4.8 Analyses of infected kératinocytes 127
Figure 5.1 Primary structure of MCSP 135
Figure 5.2 MCSP expression in breast epidermis 136
Figure 5.3 MCSP expression at other body sites 137
Figure 5.4 MCSP expression in the hair follicle 138
Figure 5.5 MCSP expression in cultured kératinocytes 139
Figure 5.6 Immunostaining of wholemount epidermis 140
Figure 5.7 FACS analysis of double stained kératinocytes 141
List of Tables
Table 1.1 Comparison of array hybridisation methods 24
Table 3.1 Differentially expressed genes 92
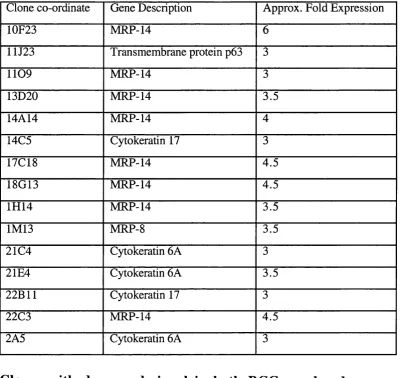
Table 4.1 Analysis of candidate genes
Table 4.2 Analysis of E-FABP negative nuclei
110
112
Abbreviations
18S 18 Svedburgs
20mer Oligonucleotide containing 20 bases
2D 2-Dimensional
Ack-1 Human activated p21cdc42Hs kinase
AMV Avian myeloblastosis virus
AP Ammonium persulphate
BCA Bicinchoninic acid
BCC Basal cell carcinoma
BSA Bovine serum albumen
bFGF Basic fibroblast growth factor
bp base pairs
BrdU 5-Bromodioxy Uridine
C-FABP Cutaneous fatty acid binding protein (E-FABP)
CD Cluster of differentiation antigen
Cdc42 Homo sapiens cell division cycle 42 (GTP-binding protein, 25kD)
cDNA Copy DNA
CGAP Cancer Genome Anatomy Project
CNS Central Nervous System
C0S2 Costal 2
CRN A Copy RNA
dXTP Deoxythymidine triphosphate
DAB 3,3-diaminobenzedene tetrahydrochloride
dATP Deoyadenosine triphosphate
DCS Donor Calf Serum
dCTP Deoxycytidine triphosphate
DEPC Diethylpyrocarbonate
dGTP deoxyguanosine triphosphate
DICE Difference Gel Electrophoresis
DMEM Dulbecco’s modification of Eagles medium
DMSG Dimethyl Sulphoxide
DNA Deoxyribonucleic acid
DNTPs Deoxynucleoside triphophates
DP Dermal Papilla
DTT Dithiothreitol
E-FABP Epidermal Fatty Acid Binding Protein
ECL Enhanced chemiluminescence
EDTA Ethyldiaminotetraacetic acid, disodium salt
EST Expressed Sequence Tag
FABP Fatty acid binding protein
FACS Fluorecence Activated Cell Sorter
FCS Foetal Calf Serum
FITC Fluorescein isothiocyanate
FSG Fish skin gelatin
Fu Fused
GFP Green Fluorescent Protein
GLI Human homologues of Drosophila Cubitus Interruptus
HEPES N-[2-hydroxyethyl]piperazine-N’-[2-ethanesulphonic acid]
HRP Horseradish peroxidase
ICRF Imperial Cancer Research Fund
IFN Interferon
IMAGE Integrated Molecular Analysis of Genomes and their Expression
1RES Internal ribosomal entry site
LamG Laminin G - D omain of the laminin protein
LB Luria Burtani
LRC Label retaining cell
MARK Mitogen protein kinase
MAPKKl Mitogen protein kinase kinase 1
MCSP Melanoma Chondroitin Sulphate Proteoglycan
MOPS 3-[N-Morpholino]propane-sulfonic acid
mRNA Messenger Ribonucleic acid
MRP-14 Homo sapiens migration inhibitory factor-related protein 14
MRP-8 Homo sapiens migration inhibitory factor-related protein 8
NaOAC Sodium Acetate
NG2 Mouse and rat homologues of the Melanoma Chondrotin Sulphate
Proteoglycan
NH4OAC Ammonium Acetate
OD Optical Density
plSOcas Homo sapiens Crk-associated substrate plSOCas
PAGE Polyacrylamide gel electrophoresis
PB Permeablilisation buffer
PBS Phosphate buffered saline
PB ST PBS/Tween
PCR Polymerase chain reaction
PDGF Platelet derived growth factor
PE Phycoerythrin
PMSF Phenylmethanesulphonyl fluoride
PTCH Human homologue of Drosophila patched
PVDF polyvinylidene fluoride
RDA Representation difference analysis
RNA Ribonucleic acid
RR Rete ridge
rRNA Ribosomal ribonucleic acid
RT Reverse transcriptase
RT-PCR Reverse transcription - polymerase chain reaction
RZPD German centre for the human genome project
SlOO 100% soluble in ammonium sulphate
SAGE Serial analysis of genomes and their expression
SCC Squamous cell carcinoma
SDS Sodium dodecyl sulphate
SHH Sonic hedgehog, a homologue of Drosophila hedgehog
SMOH Human homologue of Drosophila smoothened
SSC Salt sodium citrate buffer
SSSRC Salt sodium sarcosyl citrate buffer
Su (Fu) Suppressor of Fused
TAE Tris-acetate-EDTA buffer
TBE Tris-borate-EDTA buffer
TEMED N,N.N’ ,N’ -tetramethylethylenediamine
TM Transmembrane domain
To Mum and Dad
Acknowledgements
I was lucky enough to have two supervisors during my four years at the ICRF. The
greatest of thanks go to Anna-Maria and Fiona, for allowing me to learn what I have in
both laboratories, and for making me realise that I wanted to pursue a career in science.
Thanks for both for your patience and understanding. Lab life was made easier by the
many discussions and re-enactments of scenes from Star Wars in the Frischauf Lab, and
the constant denigration of West Ham in the Watt Lab. Without me asking inane
questions to Brian, Lisa, Steph, Thomas, Kirsten, Fritz and Sanjiv, I wouldn’t be where I
am now. The tradition of inane questioning continued when I was lucky enough to work
in the Watt lab. Thanks to all of you (over 20 at the last count!) for bearing with my first
tentative steps in cell biology. Although huge apologies for the mould! - Maybe one day
in the future I’ll get my Clonogenicity assays to work, and it’ll all be down to you guys!
I.C.R.F is a great place to make friends (and drink beer), and thanks goes out to the large
number people I have met and coerced into going to the George - Robin, Mat, Liz, Brian,
Shauny, Matt, Maria, Bryony, Steph, Jenny, and more recently, Josie, Ceri, Anna, and ....
(the list continues - oh I did drink quite a lot didn’t I!). A special shout goes out to my
fellow Essex-ites, Richard (never believe him- he is you know) and Becky. I’m sure that
the science we discussed and the beer (or whisky and cokes) we drank there was of the
highest calibre.
I.C.R.F have great laboratory services staff, without them, some of my thesis wouldn’t be
possible. Thanks go to all the members of the FACS laboratory, for their constant
patience with clumping kératinocytes, Histopathology, for the help with sections,
immunohistochemistry, and in situs, and the members of the equipment park for extended
loans of Phosphorlmagers!
Finally thanks to my family and friends who have had to bear with me through all this
Publications
O'Shaughnessy, R.F.L., Seery, J.P., Cells, J.E., Frischauf, A-M. and Watt, F.M. - E-
FABP, a novel marker of human epidermal transit amplifying cells revealed by 2D
protein gel electrophoresis and cDNA array hybridisation - In Press, FEES letters
Chapter 1
Introduction
1.1
Overview
The expression of candidate genes differentially expressed in normal and neoplastic
kératinocytes, or in kératinocytes in different stages of development could be assessed
one at a time in considerable detail. Using the intrinsically non-biased technique of
differential hybridisation, the expression of thousands of genes can be analysed
simultaneously, in a non-hypothesis driven manner. The goal of this thesis is to discover
new candidate genes involved the mechanisms of differentiation in interfollicular
epidermis and tumourigenesis in basal cell carcinoma.
1.2
Differential Gene Expression Analyses
No single cell type expresses all the genes present in a genome of an organism. At a very
basic level, liver cells express liver genes; brain cells express brain genes and so on.
What makes a brain cell a brain cell and a liver cell a liver cell? Different genes are
expressed in different cell types and the levels of expression of particular genes vary. The
panoply of different transcripts is referred to as the transcriptome, whereas the assortment
of different gene products is the proteome. Differences in the transcriptome and proteome
(the expressed genome) are what causes different cell types to have different phenotypes
and to form different tissues. The expressed genome also varies during the differentiation
of a tissue, for example kératinocytes that are destined to become terminally
differentiated squames produce proteins that are not present in the basal layer of the
epidermis. Variation is also observed in pathological conditions, a good example of this
being tumourigenesis.
Hybridisation of n orthem blots, nalysis of western blots, and more recently PCR of
cDNA with gene specific primers (RT-PCR) allow discovery single differences in the
expressed genome between two conditions. Analysis of the expressed genome by these
Chapter 1 Introduction
differences in the many thousands of genes in the expressed genome could be analysed
simultaneously. This is what differential gene expression analyses aim to achieve. It can
be likened to performing a Northern hybridisation for thousands of genes simultaneously,
or performing a Western blot for thousands of protein products simultaneously. Looking
at differences in the expressed genome between, for example, a normal cell line, and a
cell line derived from a tumour would give information on which pathways have been
altered in the tumour cell line (for example see DeRisi et al., 1996). The current term for
this is functional genomics, literally the determination of function through differences in
gene expression. The final goal of functional genomics is the tracking of differences in
the expressed genome within a species tissue by tissue, time-point by time-point, disease
by disease and condition by condition.
Although there are alternative methods to analyse the transcriptome, and these will be
discussed later, the current method of choice is the hybridisation of cDNA arrays. A
cDNA array is a number of cDNAs (from 1 to 40,000+) that have been spotted onto a
support, historically this has been a nylon filter but more recently has become a glass
slide. A probe is synthesised from RNA obtained from the tissue or cell line under test
and this is hybridised to the array. This provides an indication of what cDNAs present on
the array are actually present in the probe. If another hybridisation is performed with
another probe derived from a tissue or cell line, differences in expression of the genes
present on the array is possible by comparing the signal intensities between
hybridisations for the same spot on an array, which corresponds to a particular gene. Of
course by this method it is impossible to determine gene expression differences for genes
that are not present on the filter. The principles necessary have been known for over 25
years. However only in the last ten years with the continued development of array
technologies has the implementation been possible.
1.2.1 A Brief History of Arrays
Over 25 years ago, Edwin Southern’s discovery that labelled nucleic acid molecules
could be hybridised to immobilised nucleic acids (Southern, 1975) effectively lead to the
first array hybridisations. In these times before PCR, Northern blotting was the only way
to detect differences in the level of transcripts. Dot and slot blots were the next step, and
the first attempt to immobilise a number of genes of choice on a filter and interrogate
them with a probe. The combination of the dot blot and the ability to construct cDNA
libraries was required to allow the arraying of cDNA so there was a 1:1 relationship
between the hybridisation signal and the clones analysed (Gress et a l, 1992; Gress et a l,
1996). Attempts to quantify signal intensities and differences thereof between different
samples can be made with these filters, and one such attempt is described in Chapter 3,
the comparison of 2 BCC samples and 1 skin sample. At this time (Early-Mid 1990’s)
bacterial colonies were spotted onto nylon filters (Southern, 1975; Gress et al., 1992;
Gress et al.„ 1996). The nuts and bolts of the technology were present, but quantification
of signals was complicated by the variable amount of DNA present in a bacterial colony
and the fact that bacterial debris contributed to non-specific variation in hybridisation
signals.
Improvement were made in the technology. Better gene representation was possible as a
result of the huge amount of data being generated from the sequencing of cDNA ends
(ESTs) (For example see Boguski and Schuler, 1995 and Lennon et a l, 1996). Selecting
specific cDNAs from the huge numbers available also provided the arrays with non
redundancy, that is the representation of each gene only once. Using cDNA rather than
colonies allowed easier contol of the quantity of DNA present on each spot, and
drastically reduced the variation in DNA content on the spot, allowing for more precise
quantification of hybridisation signals
Stanford University, in the laboratory of Patrick Brown, was where the next advance
originated, with the discovery that cDNAs could be immobilised on a non-porous support
such as glass. Up to 10,000 cDNAs could be spotted on a microscope slide (Schena et a l,
1995). The ability to use two differently fluorescently labelled probes on the same
microarray (the term for arrays on chips) abrogated the need to normalise data. This
approach coupled with confocal microscopic analysis of the microarray has been
successfully used by a number of laboratories, and has been marketed by a large number
of companies. Both chips and chip readers are commonplace now. The most recent
Chapter 1 Introduction
allowed by in situ oligonucleotide synthesis, a method pioneered by Lipshutz and Fodor,
founders of Affymatrix.Inc. This allows 300,000 gene specific oligonucleotides
(corresponding to 15,000 genes) to be arrayed on a single chip (Lipshutz et a l, 1999).
Experimental chips now exceed 1,000,000 oligonucleotides (Lipshutz et al., 1999).
However for most researchers the cost of setting up an arraying facility or buying ready
made microarrays are still prohibitive, but the costs will fall as the demand for global
expression data increases.
1.2.2 Performing an Array Hybridisation
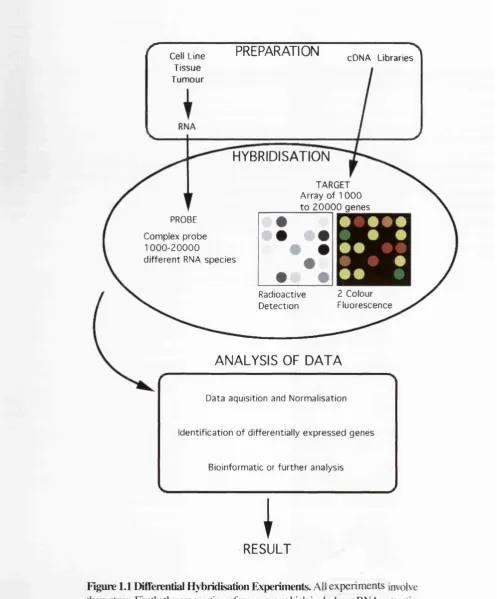
All array hybridisation methods involve the hybridisation of a complex probe from tissue
samples or cell lines to an array target either a large nylon filter (macroarray) or a smaller
glass support (microarray) (Figure 1.1). The probe in question is normally reverse-
transcribed from the mRNA and either labelled in the reverse-transcription reaction or the
synthesised cDNA is labelled. The probe is labelled radioactive nucleotides (typically
with or ” P labelled) or fluorescently labelled nucleotides. This “complex probe”
(Oettgen et a l, 1997) is a representative sample of the transcripts present in a particular
mRNA population. The probe is hybridised to the target in a volume appropriate for the
array being used i.e. tens to hundreds of microlitres for microarrays, and 10-30 ml for
macroarrays.
The hybridisation is performed in a large excess of the target i.e. the DNA spotted onto
the array. Only under these conditions will the hybridisation signal on a spot vary in a
linear fashion with the abundance of the transcript in the probe. To give an idea of
numbers, the typical nylon filter spot has 50ng of DNA (Nguyen et a l, 1995). An
abundant mRNA species (1/1000 relative abundance) when labelled corresponds to
approximately 1 ng when lug of mRNA is labelled. This is 50 times less than the amount
of DNA on the spot. Even then only a small fraction of this probe will hybridise to the
cognate target. This is in stark contrast to normal Southern and Northern hybridisation,
where the probe is in huge excess, and the signal is dependent upon the amount of
available target. In complex probe hybridisations, the signals are dependent on the probe
concentration, the length of hybridisation time and the DNA on each spot. These
hybridisation conditions are therefore not optimal and less complex DNA species, repeat
sequences, and polyA or polyT tracts will hybridise more readily. These events have to
be taken into consideration when the hybridisation is analysed (Nguyen et al.,, 1995;
Bernard gr a/., 1996).
As discussed previously, the signal on a spot is mostly dependent on the concentration of
the probe. Simply increasing the amount of probe present in the hybridisation can
increase the sensitivity of any hybridisation; the ability to detect low signals above the
background signal present over the whole array, assuming the background does not vary
as a result. However as the biological material is normally the limiting factor in any
expression analysis, this is not really possible. Sensitivity can be described in two ways:
the minimal number of transcripts per cell that can produce a discernible signal on a spot
(the detection limit) or the minimal number of mRNA molecules of a given species that
can detected (Bertucci et a l, 1999). Detection methods are important determinants in
sensitivity, as is the amount of DNA on per target. Radioactive detection is more
sensitive than fluorimetric detection (Bertucci et al., 1999), and Nylon arrays have more
DNA per target than microarrays. In fact the minimum detectable sample is
approximately the same for both techniques. In addition smaller amount of sample can be
Cell Line Tissue Tum our
PREPARATION cDNA Libraries
HYBRIDISATION
TARGET Array of 1 0 0 0 to 2 0 0 0 0 genes PROBE
Complex probe
1000-20000
d ifferent RNA species
2 Colour Fluorescence Radioactive
Detection
ANALYSIS OF D A TA
Data aquisition and Normalisation
Identification of differentially expressed genes
Bioinformatic or further analysis
I
RESULT
Figure 1.1 Differential Hybridisation Experiments. All experiments involve three steps. Firstly the preparation of resources, which includes mRNA extraction from the test and references tissue and selection of cDNAs for array construction. Secondly, the a probe is synthesised from the mRNAs and hybridised to the array target. Signals are analysed automatically and changes in signals are then determined.
Nylon Filters Microarrays
(Schena et al.„ 1995)
Oligonucleotide chips
(Lockhart et a l, 1996)
Target cDNA clones
(Colonies or PCR
products)
cDNA clones as PCR
products
Normally 20mer
oligonucleotides
Format Up 30,000 spots on
a 22x22 nylon filter
(B. Korn - Pers.
Comm.)
Up to 6400 spots on a
1.8x 1.8 cm glass
slide
64,000
oligonucleotides on
1.28x1.28 cm glass
chip
Sample 25 mg Total, 1 pg
mRNA
2 pg mRNA 10 pg mRNA
Label 33p Fluorescence Fluorescence
Hybridisation
Volume
10-40 ml 2-10 pi 200 pi
Detection limit 1/20,000 1/ 100,000 1/300,000
Minimum
sample amount
25 X10^ molecules 20 X 10^ molecules 30 X 10^ molecules
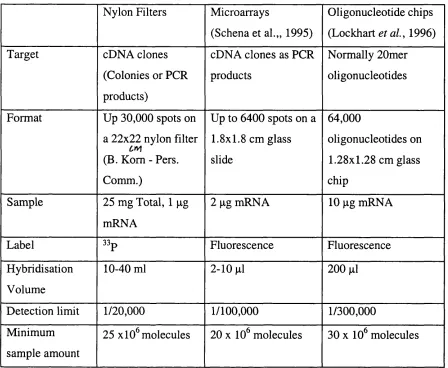
Table 1.1 Comparison of Array Hybridisation Methods: Adapted from Bertucci
et aL, 1999
Detection limit is the minimal relative abundance of a particular mRNA species that can actually be detected as a signal on a spot. Minimal sample amount is the smallest number of a single species of transcripts that can produce a signal. Ipg of mRNA is approximately 10^ transcripts, assuming a 1.7kb average transcript size (Bertucci et al.,
Chapter 1 Introduction
1.2.3 Analysis of Differential Hybridisation Data
Although performing the hybridisations is relatively trivial, what is far from trivial is the
analysis of the hybridisation results. Short of manually scoring every signal, the only way
that meaningful data can be obtained is by automated analysis. The hybridised filter is
normally analysed from an image derived from a high resolution imaging plate system
(for example the Phosphorlmager plates used in this thesis), and the results from
microarray hybridisations are normally analysed from a confocal microscopic image. The
result is a list of co-ordinates and signal intensities. The interpretation of these data can
be a problem. Data is typically normalised to allow easy comparison between different
hybridisations. Some way of determining the minimum difference in expression that can
be detected is necessary to reduce the number of false positives (differences in signals
that are not due to differences in expression). In addition the minimal detectable signal
above background levels has to be determined.
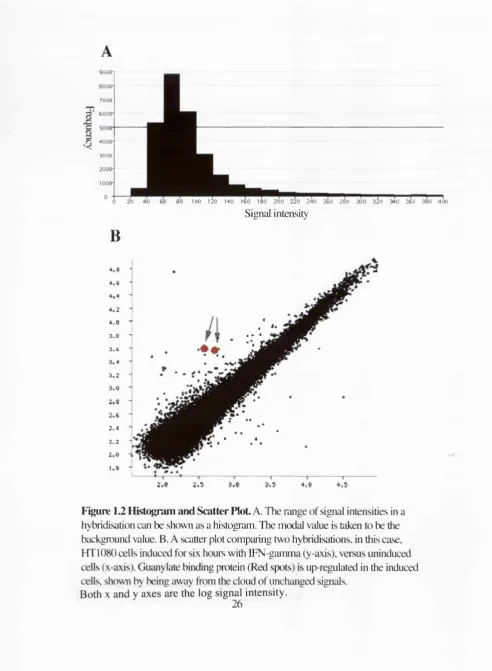
A good way of determining these criteria is by the plotting of data on a scatter plot and a
histogram respectively. Plotting the intensities as a histogram will show a distribution
around a peak value. Normally this peak value is regarded as the background value. All
signals below this value will be assigned this value for quantitation purposes (Figure 1.2).
In addition, differences in signal are only regarded as valid if one or other of the signals is
significantly above this background value, typically double the background value.
Blindly evaluating signal differences of spots that are of a background value is a major
source of false positives. Plotting two sets of signal intensities against each other will
always produce the same result, a cloud of data points that vary around the line of no
differential expression (that is identical signals in both hybridisations). Points that lie
outside of this main cloud correspond to signals that differ by a larger amount than is due
to random variation. These are regarded as due to potentially differentially expressed
genes (Figure 1.2)
800(r
7 0 0 0
6000-n 4 0 0 0 -3 0 0 0 2000
-1000
-B
80 100 120 140 160 180 200 220 ^ 4 ^ ^ 6 T ^ 8 ^ ^ i ^ 3 2 ^ ^ 0 " " 3 6 ^ ^ 8 0 " ^ W
Signal intensity
4 . 0 3 . 0 3 . 6
3 . 2
2 . 4
2 . 2
2 . 0
2 .9 2 .7
Figure 1.2 Histogram and Scatter Plot A. The range of signal intensities in a hybridisation can be shown as a histogram. The modal value is taken to be the background value. B. A scatter plot comparing two hybridisations, in this case, HT 1080 cells induced for six hours with IFN-gamma (y-axis), versus uninduced cells (x-axis). Guanylate binding protein (Red spots) is up-regulated in the induced cells, shown by being away from the cloud of unchanged signals.
Chapter 1 Introduction
1.2.4 Confirmation of Differential Gene fi.\pression
Gene expression differences are normally confirmed, typically by Northern hybridisation
or RT-PCR. This is necessary for several reasons. The first and most important of these is
the elimination of remaining false positives. Secondly confirmation that the observed
expression change is observed in other samples of the same condition (same kind of
tumour or a related cell line), gives weight to the finding. Tumours are good example of
the need to do these sorts of analyses as, for example, different classes of melanoma can
be identified on the basis of the genes that are differentially expressed in them (Bittner et
a l, 2000). When these confirmation steps are overlooked (Lee et aL, 1999) the results of
the analysis should be regarded with some scepticism. The only exception to this would
be where the results are in line with previously published findings, an example of this
would be the expression of keratins in different classes of breast tumours (Pérou et a l,
2000)
1.2.5 Other methods of determining differential gene expression
Differential hybridisation is not the only way to detect different levels amounts of
transcripts between two populations. Powerful though differential hybridisation clearly is,
it cannot provide the whole picture of differential gene expression as yet (although many
of the large companies that have bought into the technology would like you to think so).
Differential hybridisation currently fails at trying to find differences in expression in very
rare transcripts, and contrary to popular belief, the actual expression differences are hard
to quantify exactly. The other approachs open to most laboratories can only ever address
one of these problems well. PCR based approaches are the best way to determine
differential gene expression in rare transcripts, whereas cDNA sequencing projects are
better suited for more precise quantitation. Although analysis of changes in the transcript
population are reflected in the protein products, looking at the proteome can also allow
the detection of more subtle, yet just as significant changes such as post translational
modifications. Proteomics utilising 2D gel electrophoresis has been around for much
longer than array hybridisation, but only recently has it become a particularly powerful
tool in expression analyses (Cells et al., 1991)
PCR based technologies -cDNA subtraction
If knowing the approximate differences in expression of genes is not important, and the
only information desired is discovery of genes that are either absent or present from one
or other of the transcripts under test, then PCR approaches are powerful ways to detect
differences in even extremely rare transcripts. Without going into a huge amount of
detail, cDNA subtraction involves the hybridisation of the cDNA under test, the tester,
with a large excess of a reference cDNA, the driver. cDNAs that are present in the tester
but not in the driver do not hybridise. This first step is known as cDNA subtraction
(Hedrick et aL, 1984). Only the non-hybridised tester cDNA can be amplified. This
process can be iterated (in a variation of cDNA subtraction known as Representational
Difference Analysis or RDA - Lysitsyn et aL, 1993) until a number of PCR products
corresponding to genes present in the tester but not in the driver are seen. These products
have to be characterised, which involves not a small amount of work, but the whole
transcriptome has been analysed for differences, not just the representation on a cDNA
array.
cDNA sequencing and SAGE
If manpower and expense are not problems, then probably the most comprehensive way
of finding out what genes are differentially expressed between two mRNA populations is
to make cDNA libraries out of each and sequence tens of thousands of clones from both
libraries (examples Lennon et a/., 1996; Konishi et aL, 1994 in cultured kératinocytes).
Then all that is needed is to count the number of times a particular gene is sequenced in
both libraries to determine expression differences. Absolute quantitation is assured and
the sensitivity of the approach is only limited by the amount of clones sequenced.
l.M. A.G.E, the integrated molecular analysis of genomes and their expression (Lennon et
aL, 1996) is a huge attempt at this and now tens of millions of 5’ and 3’ ends of cDNAs
from hundreds of different libraries have been sequenced. But it has taken nearly a
decade so far. Indeed the Unigene database, an attempt to collate the l.M.A.G.E.
Chapter 1 Introduction
1995), is the basis of the genes that are spotted on the filters used in chapter 4 (B.Kom -
personal communication)
Recently a method has been devised to do the same as above, but for far less effort. The
reasoning goes that if only 9 bp is required for a unique gene sequence that will be only
present once in the human genome (Velculescu et aL, 1995), why sequence 500bp to
ascertain the identity of a gene in a cDNA sequencing project? Instead ligate together,
with spacers, these 9bp tags and sequence them all at once. This technique, known as
serial analysis of gene expression or SAGE is complicated, involving the digestion of
cDNAs at known locations brought about by the use of two restriction enzymes, the
ligation of the resulting identifying “tags” in concatomers, and their subsequent
sequencing and analysis (Velculescu et aL, 1995). The amount of each tag present is
counted and compared with the tags from the other cDNA population. The data is easy to
quantify and differential expression can be measured exactly. This technique has been
used with some success in determining gene expression differences in colorectal cancer
compared to normal tissue, and very recently has revealed that tumour neovasculature
expresses different genes to normal endothelia (Zhang et aL, 1997; St. Croix et aL, 2000),
validating the approach in small amounts of starting tissue.
Proteomics approaches
There is no need to look at differences in the transcriptome at all. Differences in
transcription will lead to differences in the translated gene products. Also there are many
post translational modifications that would not be apparent in cDNA based approaches.
Phosphorlyation, and glycosylation are just two of these modifications that could
modulate function. Conceptually proteomics is simple. Perform two identical 2D gel
electrophoreses with the two extracts under test (typically size separation on one axis
after isoelectric focusing on the second axis). Visualise the proteins as thousands of dots,
and look for dots that are different between the two, either in size (i.e. differential
expression), or position (normally due to post-translational modification).
The problems arise when trying to determine the identity of the protein of interest. This
involves microseqencing normally directly from the spot of interest. However in certain
tissues this has been made easier by the efforts of laboratories such as that of Julio Celis,
who is systematically characterising for example, all the proteins in normal human
kératinocytes and their positions in terms of their size in kilodaltons, and their isoelectric
points (Celis et al., 1991). This database (http://biobase.dk/cgi-bin/celis) has been used to
compare normal and psoriatic kératinocytes (Madsen et aL, 1992), and more recently has
been used to address the stem cell versus transit amplifying cell problem discussed in
Chapters 4 and 5 (O’Shaughnessy et aL, in press). Improvements have been made in the
technology. Difference gel eletrophoresis (DICE - Unlu et aL, 1997) allows two
differently fluorescently labelled extracts to be electrophoresed on the same
polyacyrlamide gel. In this way both the differences in expression and post-translational
modification are easier to detect.
1.2.6 Towards Functional Genomics - The Future of Array Hybridisation
In organisms where the whole genome has been sequenced, i.e yeast, differential
hybridisation is functional genomics. Comparing the expression profiles of a database of
known yeast mutants with the expression profile of an unknown yeast mutant makes
possible the detemination of probable functions of the product of the unknown mutated
gene (Hughes et aL, 2000). The global changes in gene expression in processes such as
cell division can also be analysed (Cho et aL, 1998). True functional genomics cannot be
performed as yet on human expression studies as the whole genome is not as yet
characterised. In addition on a practical level, it is unlikely in the very near future,that
there will be the ability to represent the whole human genome on a chip, as is the case
with yeast. However, attempts are being made to collate expression data in parallel
comparisons of tumour tissue versus normal tissue as a part of the cancer genome
anatomy project (CGAP)(Strausberg et a l, 1997; Cole et aL, 1999; Krizman et a l, 1999).
The true power of differential hybridsation in combatting diseases such as cancer will be
manifest in the ability to track and understand the progression of all tumours from the
earliest premalignant lesion right up to metastasis on the basis of their gene expression
Chapter 1 Introduction
1.3
The Epidermis
The epidermis is a good model tissue for examining problems in tumorigenesis and
development. Skin carcinogenesis in mouse is one of the major nv^;^contributing to the
understanding of the multi step nature of carcinogenesis in general (Yuspa., 1994). The
discovery that the epidermis requires stem cells active throughout life, that kératinocytes
undergo a well known program of terminal differentiation and that stem cells are
maintained in culture make the epidermis and kératinocytes an attractive model system in
which to analyse the properties of stem cells and their committed progenitors (Watt.,
1998; Watt., 2000)
The skin is the outermost layer of the human body and is made of three layers, the
innermost subcutaneous fat, the dermis, and the othermost layer, the epidermis. The main
role of the skin is to protect the rest of the body from water loss, infection and the
environment. The epidermis is the layer that plays the largest role, as it provides an
impermeable barrier to the outside by virtue of the outermost layer of the epidermis,
which produces anucleate, proteinaceous flattened cells called squames. Squames are
constantly sloughed off the surface of the skin, so to maintain its protective role, the
epidermis must be able to produce more squames. This is achieved with an actively
dividing layer of cells, the basal layer. These cells eventually terminally differentiate,
leaving the basal layer to eventually form squames (Holbrook., 1994).
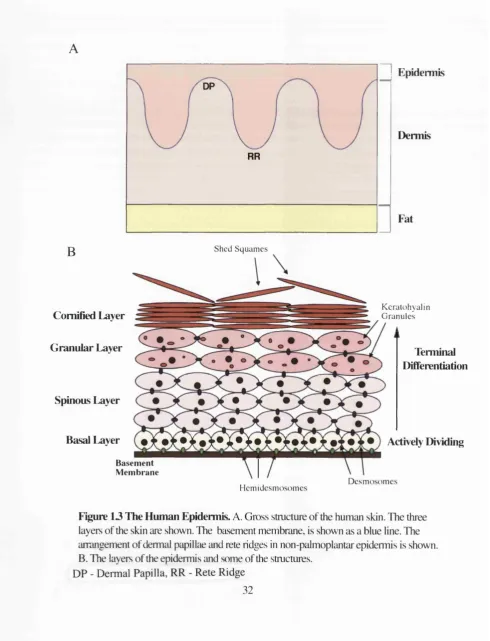
In humans, the thickness of the epidermis varies, with regions where the epidermis is thin
overlying the dermal papilla, and regions where the epidermis is thicker, projecting
further into the dermis, that are known as rete ridges (Figure 1.3). In the epidermis of the
palm and sole (palmoplanter epidermis), there are two sorts of rete ridges, the shallow
rete ridges similar to those seen in non palmoplantar epidermis, and deep rete ridges. The
epidermis is arranged into four histologically distinct layers, the basal layer, the spinous
layer, the granular and the comified layer. The main cell of the epidermis is the
leratinocyte. The major constituent of kératinocytes is keratin. Keratin forms an
intermediate filament skeleton, which provides resistance to shearing forces (Odland.,
1991). Different keratins are expressed in different layers of the epidermis, and act as
DP
RR
I Epidermis
Dermis
Fat
B
S h e d S q u a m e sComified Layer
Granular Layer
Spinous Layer
Basal Layer
K e r a t o h y a lin G r a n u le s
Terminal Differentiation
Actively Dividing
Basement Membrane
H e m id e s m o s o m e s
D e s m o s o m e s
Figure 13 The Human Epidermis. A. Gross structure of the human skin. The three layers of the skin are shown. The basement membrane, is shown as a blue line. The arrangement of dermal papillae and rete ridges in non-palmoplantar epidermis is shown. B. The layers of the epidermis and some of the stmctures.
DP - Dermal Papilla, RR - Rete Ridge
Chapter 1 Introduction
Specific markers for the layers (Stoler et al.,1988; reviewed in Fuchs., 1988). Other cells
are present in the epidermis and these are the melanocytes that provide the skin with
pigment (Jimbo et a l, 1991), the Langerhans cells, which are the epidermal antigen
presenting cells (Hauser et a l , 1991) and the Merkel cells which are required for hair
follicle development as well as electro-mechanical signal transduction (Munger et a l,
1991).
1.3.1 The Basal Layer, Basement Membrane and Integrins
The basal layer of the epidermis is the only actively dividing layer of the epidermis. Stem
cells that are present in the basal layer give rise to committed progenitors that eventually
leave the basal layer and terminally differentiate (Watt., 1998). There are several known
markers specific to the basal layer. Keratins 5 and 14 are the keratins that form the
intermediate filament skeleton in basal cells (Stoler et a l, 1988). The basal kératinocytes
express adhesion molecules called integrins, which allow them to attach to the basement
membrane which divides the epidermis from the dermis (Hynes., 1992; reviewed in Watt
and Hertle., 1993). The basement membrane consists of extracellular matrix componants
secreted by both the kératinocytes and the dermal fibroblasts, including laminins,
fibronectin and collagen (Burgeson and Christiano., 1997), The basement membrane
contains microfibrils which connect the dermis to the epidermis via structures called
hemidesmosomes (Jones et a l, 1998). There are three major integrins, consisting of a
and P subunits, expressed by the basal kératinocytes which can adhere to these
extracellular matrix componants. a 2pi integrin can adhere to laminin, fibronectin and
collagen, while aSpl and a6p4 integrins can adhere to laminin 5, with a6p4 being one of
the major components of the hemidesmosomes (Watt and Hertle 1993; Jones et al, 1998).
Integrins are important not only for adhesion, but also the modulation of growth and
proliferation (Hynes., 1992: Zhu et a l, 1999). Because of this they are attractive as
potential markers of the stem cell. This is discussed the section Keratinoyte stem cells.
1.3.2 The Spinous Layer
This 4-8 cell thick layer contains cells that are terminally differentiating. The cells are
more flattened and contain more keratin than the cells of the basal layer. The first well
known markers of terminal differentiation, keratins 1 and 10 are expressed in this layer in
hair bearing skin, whereas keratins 1,2 and 9 are expressed in palmoplantar epidermis
(Morely and Lane., 1994). The uppermost cells of this layer express some of the
constituents of the comified envelope of the squames, such as involucrin and proline rich
proteins such as comifin (Simon., 1994)
1.3.3 The Granular Layer
This 2-3 cell thick layer is named for the presence of keratohyalin granules, containing
profilaggrin and loricrin, whose function is thought to be the aggregation of keratin
filaments (Holbrook., 1994). These cells produce lipids that contribute to the barrier
function of the com ified layer (Lampe et al., 1983; reviewed in Nemes and
Steinert.,1999).
1.3.4 The Comified Layer
This is the outermost layer of the epidermis. It functions as an impermeable barrier to the
environment. The cells of this layer are the squames described earlier. Squames are large
but very thin cells with no organelles. The cytoplasm is packed full of keratins, and is
surrounded by a 12nm thick insoluble comified envelope, which consists of covalently
Chapter 1 Introduction
1.4
Two cancers of the epidermis: BCC and SCC
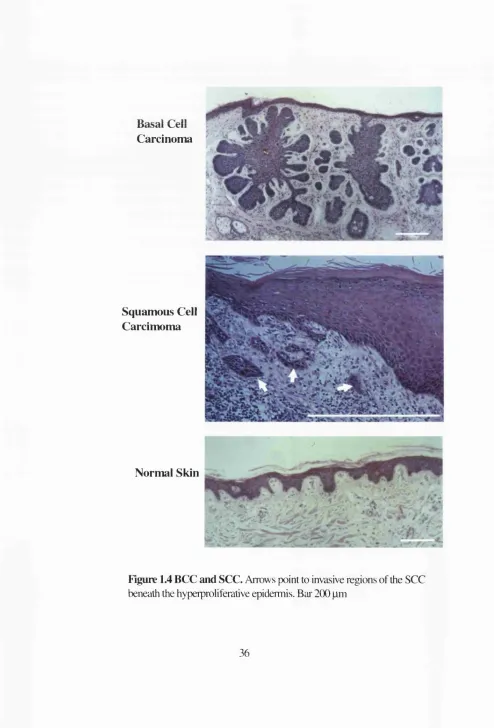
1.4.1 Basal Cell Carcinoma
Basal cell carcinoma (BCC) is a tumour derived from the basal layer of the epidermis. As
yet no clear precursor lesion has been detected (Miller, 1991a; Miller, 1991b; Preston and
Stem, 1992). In general, BCC begins as small invasive areas of the epidermis growing
downward into the dermis, but with an intact basement membrane. In later stages of the
carcinoma, small tumour nests bud away from the epidermis above and tend to be
associated with a mononuclear infiltrate. These nests are characterised by their outermost
cell layer having a pallisade-like appearance reminiscent of the basal layer of the
epidermis from which the tumour had originated (Miller, 1991a; Miller, 1991b; Preston
and Stem, 1992 and Figure 1.4)
There are few genes whose expression is diagnostic of BCC. In general genes that are
expressed in the basal layer of the epidermis, or in the proliferative cells of the hair
follicle, are also expressed in BCC. In particular expression of cytokeratins is observed.
The basal keratins, 5 and 14, and the hair follicle-derived keratins, 15 and 17, are
expressed in all BCCs (Stoler et a l, 1988). Other proteins that are typically upregulated
in BCC include, but are not restricted to, integrin subunits and the transferrin receptor
(Gatter et a l , 1984; Peltonen et a l, 1989). Conversely, markers of the suprabasal
epidermis are generally absent in BCC tumour nests. For example, involucrin, a markers
of terminal differentiation was negative in all tumours analysed (Murphy et a l, 1984;
Said et a l, 1984; Sumitomo et a l, 1986). Collagen IV, a basement membrane component
is present around all tumour nests suggesting an intact basement membrane (Barsky et
a l, 1987; Kallioinen el a l , 1984). The bullous pemphigoid antigen (BPAG), a
component of hemidesmosomes, has a reduced expression in BCC, consistent with a
reduced number of hemidesmosomes (Stanley et a l, 1982). However, too date, there is
no antibody that specifically marks BCC.
Cell cycle time for BCC cells and normal kératinocytes are not markedly different
(Weinstein and Frost, 1970), however the DNA synthesis phase (S-phase) is twice as
Carcinoma
Squamous Cell Carcimoma
Normal Skin
Figure 1.4 BCC and SCC. Arrows point to invasive regions of the SCC beneath the hyperproliferative epidermis. Bai 200 pm
Chapter 1 Introduction
long in BCC cells (Heenen et a l, 1973). The DNA content is almost the same as normal
diploid cells, with the most common genetic lesion being the loss of all or parts of
chromosome 9 (Quinn et a l, 1994). In general, amplification of oncogenes is not
observed, however, amplification of c-Myc and mutations in K-ras have been observed in
some BCCs (van der Schroeff et a l, 1990).
BCCs rarely metastasise, one reason for this possibly being that, according to Pinkus, the
BCC is a stroma-dependent tumour (Pinkus., 1959). This is borne out by the fact that
transplanted tumours are unable to survive without their accompanying stroma (Pinkus.,
1965) and that attempts to culture BCCs have always caused a degree of differentiation
(Flaxman and Van Scott, 1968; Flaxman, 1972; Kubilus et a l, 1980). This suggests that
the maintenance of the BCC phenotype requires factors from the surrounding stroma.
1.4.2 Genetic predispositions to BCC
Recently major advances in the understanding of BCC development has come from the
study of genodermatoses, or genetically inherited skin abnormalities that lead to a higher
incidence of BCC in the affected individual. These diseases include Xeroderma
Pigmentosum (Robbins et a l, 1988), Bazex Syndrome, which causes hypotrichosis
(reduced hair growth) as well as BCC (Viksnins and Berlin, 1977), and most importantly.
Nevoid Basal Cell Carcinoma Syndrome, or Gorlin Syndrome (Gorlin, 1987). Gorlin
Syndrome is an autosomal dominant disorder, which manifests as multiple BCCs,
palmoplantar pits, which are indicative of aberrant keratin synthesis, and developmental
abnormalities that include bifid ribs (Gorlin, 1987). The gene responsible for this disorder
has recently been cloned, providing insight into tumour development, not only in BCC,
but also other common cancers. The gene mutated in Gorlin syndrome is the human
homologue of the Drosophila segment polarity gene, patch ed, PTCH, part of the
hegdehog signalling pathway (Hahn et a l, 1996a; Hahn et a l, 1996b; Johnson et a l,
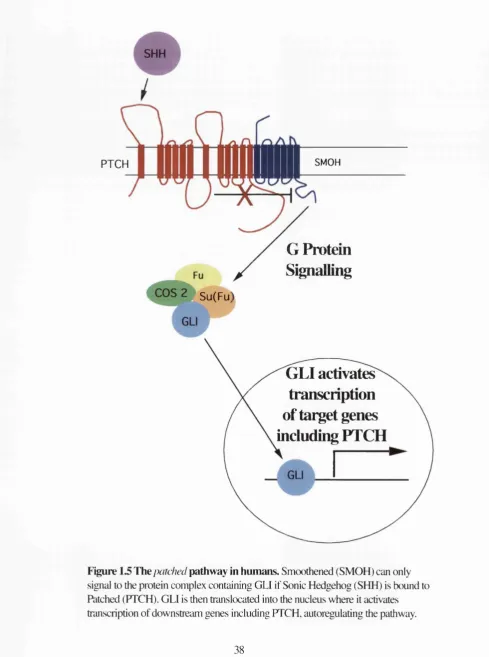
1996 and Figure 1.5).
PTCH is found on chromosome 9, the most common altered chromosome in BCC (Quinn
et a l, 1994). Analysis of some of the members of the PTCH pathway has revealed its
PTCH
II
SMOHG Protein
Signalling
Su(FuV
GLI activates
transcnption
of target genes
including PTCH
Chapter 1 Introduction
importance in the development of BCC. Mutations in PTCH and smoothened (SMOH)
have been observed in sporadic tumours, with the possibility that point mutations in some
cases were sufficient to impair function. Out of 37 tumours examined, 14 had mutations
in PTCH, most of which were premature stops and frameshifts, however there were 4
point mutations and a single in-frame deletion. These were found either on the first
extracellular loop on one intracellular loop or at the carboxyl terminus (Gailani et a l,
1996). In SMOH point mutations were often observed (Reifenberger et a l, 1998). Two
point mutations in SMOH were found in 3 out of 47 BCCs, one in the seventh
transmembrane domain and a second in the cytoplasmic tail. Some of these mutations
allowed SMOH to act as a cooperative oncogene with adenovirus E l A, transforming rat
fibroblasts (Xie et a l, 1998). Expressing one of the SMOH mutants in the basal layer of
the epidermis of mice lead to the development of BCC like features (Xie et a l, 1998).
Ectopic expression of some of the patched pathway members in the epidermis can lead to
BCC. Expressing SHH under the control of the keratin 14 promoter in mice produces
BCC-like lesions (Oro et a l, 1997). Human kératinocytes expressing SKH by retroviral
transduction when grafted onto SCID mice, produce epidermis with BCC-like features
(Fan et a l, 1997). Injection of GUI mRNA into Xenopus skin leads to BCC-like lesions
(Dahmane et a l, 1997). Mice overexpressing G lil under the control of the keratin 5
promoter develop spontaneous BCCs as well as other epidermal tumours, that are not
dependent on the mutation of Ras or p53 (Nilsson et a/.,2000). Recently mice that are
hemizygous for Patched display medulloblastomas, another of the tumours indicative of
the genetic abnormality (Zurawel et a l, 2000; Gorlin, 1987).
1.4.3 Squamous Cell Carcinoma
SCC is another neoplasm that arises from the basal layer of the epidermis (Figure 1.4).
Like BCC, the main causitive agent is again chronic sun exposure. Unlike BCC, they
appear to progress through precursor lesions. A possible candidate precursor lesion is
actinic keratosis, scaly skin caused by sun exposure (Marks, 1990). It is thought that
around 3% of these lesions go on to become SCCs in situ, and subsequently become
malignant (Marks et a l, 1988). SCCs appear to acquire multiple mutations in multiple
genes in a similar fashion to the multistep carcinogenesis model proposed by Vogelstein
(Vogelstein and Kinzler, 1993). In mice, SCCs that are produced by chemical
carcinogenesis progress through hyperproliferate papillomas, onto invasive and in some
cases metastatic tumours (Yuspa., 1986; Yuspa., 1994)
Carcinogenesis in the mouse begins with tumour promotion, typically a genetic mutation
that is phenotypically silent. The promoted cells undergo clonal expansion, which
eventually gives rise to papillomas. The c-Ras gene is frequently heterozygous in these
papillomas (For example Balmain et a l, 1984). The papilloma progresses, acquiring
more genetic hits and chromosomal abnormalilites, until malignant conversion can take
place. In carcinomas both copies of the c-Ras gene are typically hit (Quintalla et a l,
1986; Bianchi et al., 1990). Other genes typically altered on the way to carcinoma
include members of the TGF family, protein kinase C, with later hits including changes in
expression of integrins, and proteases, both of which promote invasion of malignant
keratinoytes (Reviewed in Yuspa., 1994).
Human SCC appears to progess along similar pathways. Typically multiple genetic hits
that include Ras and p53 (Field et a l, 1992). Indeed p53 mutations are seen in pre
malignant kératinocytes, typically C-T and CC-TT transitions associated with damage
from ultraviolet light, and are clonally expanded in sun exposed areas, awaiting further
mutations in other genes (Jonason et al., 1996). There is greater variation in genetic
content in SCCs compared to BCCs with the loss and amplification of chromosomes
(Quinn et al.„ 1994), as well as the mutation and amplification of classical oncogenes
(i.e. Ras) (Field et al., 1992). This suggests that the origin of BCC and SCC are very
different.
SCCs tend to exhibit regions that differentiate, so they tend to express high levels of
proteins normally expressed in the suprabasal epidermis. The expression of proteins that
display variation in BCC, for example, integrins, may have diagnostic potential in SCC of
the oral cavity, where reduction in the levels of integrin expression, particularly the pi
and a6p4 integrins correlate with poor prognosis. (Bagutti et a l, 1998). Routinely,
Chapter 1 Introduction
(Suminami et a l, 1998). These appear to act through the degradation of proteins involved
in apoptosis and inflammation (Suminami et al., 1998).
1.5
Kératinocyte Stem Cells
There is a requirement for the epidermis to be able to repopulate as there is constant
shedding of squames from the surface of the epidermis (Holbrook., 1994). When the
epidermis is injured, new epidermis has to be produced during wound healing
(Holbrook., 1994). Repopulation and turnover are possible due to the presence of a
population of stem cells that can give rise to both the epidermis itself, and its adnexa, the
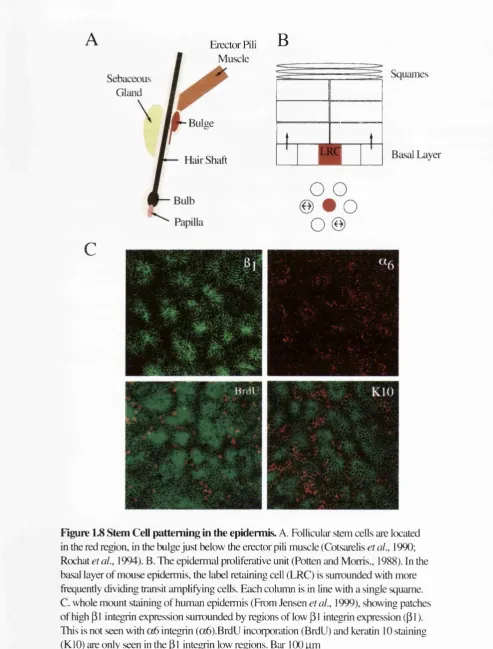
hair follicle and the sebacous gland (Odland., 1991). Evidence for keratinocyte stem cells
was first accumulated in the mouse, where only 10% of the basal cells were able to
reconstruct normal epidermis after severe irradiation (Withers., 1967; Rotten and
Hendry., 1973). As approximately 60% of the basal cells are actively cycling Withers.,
1967; Rotten and Hendry., 1973), this subdivides the basal layer into 3 putative
compartments, actively dividing cells that can reconstruct injured epidermis (stem cells),
actively dividing cells that cannot reconstruct epidermis (transit amplifying cells), and
non-dividing cells (committed progenitors). By inference therefore, stem cells have an
unlimited potential for cell division, and little likelihood of differentiation. Transit cells
on the other hand only divide a limited number of times and have a higher likelihood of
terminal differentiation (Figure 1.6). Understanding the properties of stem and transit
amplifying cells has involved the use of in vivo and in vitro models as well as newer
novel approaches such as whole mount epidermal staining (Jensen et al., 1999). What
follows is a summary of the knowledge accrued so far.
1.5.1 Keratinocyte Cell Culture
For many years, the culture of human kératinocytes by established methods (Rheinwald
1989) has been used to produce epidermal sheet for grafting onto bums (Gallico et al.,
1984; Compton et al., 1998). The fact that these grafts persist for long periods of time
proves that epidermal stem cells are retained in cell culture. When kératinocytes are
cultured on a layer of mitotically inactive 3T3 cells at clonal density, that is a single cell
gives rise to a colony of kératinocytes, then only 20-40% of cells plated typically give
Basal I Suprabasal |
Committed to
Stem Transit Terminal Terminally
Amplifying Differentiation Differentiating
C
Unlimited
5-6 Times
Actively Dividing Post-Mitotic
Proliferative Abortive
I Colonies | Colonies | No Colony Forming Ability [
Figure 1.6 Populations of the interfoUicular keratinocyte lineage
types, those that are large and proliferative (typically containing thousands of cells), and
those that are small (normally 32 cells or less), with all the cells producing markers of
terminal differentiation, such as involucrin (Adams and Watt., 1989; Jones and Watt.,
1993). These colonies are known as abortive colonies. It is assumed that the founders of
proliferative colonies have the characteristics of stem cells, whereas the founders of
abortive colonies have the characteristics of transit amplifying cells (Jones and Watt.,
1993; demonstrated also in Gandarillas and Watt., 1997; Zhu and Watt., 1999; Zhu ef a l,
1999; Lowell et al., 2000)
One essential characteristic of stem cells is their ability to divide effectively limitlessly.
The ability of the cells of a proliferative colony to themselves found proliferative
colonies is a more stringent assay for a stem cell (Barrandon and Green., 1987; Rochat et
al., 1994). Three types of colony founder were observed using this approach. A founder
that produced little or no secondary colonies and the cells of the colonies were all
expressing terminal differentiation markers (a terminal colony) was referred to as a
paraclone. Founders producing no terminal colonies were referred to as holoclones.
Founders with intermediate qualities were meroclones. How do these three classifications
compare with the abortive/proliferative classifications? Holoclones, paraclones and
meroclones can all produce proliferative colonies but have different proliferative
potential (Barrandon and Green., 1987). Most if not all of the secondary colonies of a
paraclone have the properties of abortive colonies. However the number of divisions a
paraclone can undergo prior to terminal differentiation are significantly greater than the
number of divisions of a cell that produces an abortive colony, and so are unlikely to be
the transit amplifying cells as described above. Cells move from being holoclones,
through meroclone and paraclone to transit amplifying cells then they terminally
differentiate. The hope is that finding new markers will allow the better characterisation
of this continuum of proliferative potential.
1.5.2 pi Integrin as a Stem Cell Marker
Adhesion receptors are attractive candidates for stem cell markers as they have the ability