IJSRR, 7(4) Oct. – Dec., 2018 Page 467
Research article
Available online www.ijsrr.org
ISSN: 2279–0543
International Journal of Scientific Research and Reviews
Import Variability: A Disaggregated Analysis in the Indian Context
Shanmugan K.
Department of Business Economics, Faculty of Commerce, The Maharaja Sayajirao University of Baroda, Vadodara, Gujarat. Email-id: [email protected], Contact: 09925928859
ABSTRACT
Developing countries require good amount of imports in terms of raw materials, technologies and capital know-how and in fact some of the basic industries of critical importance depended on the imports from particularly developed countries. Technological gap, inventions in Research and Development (R&D) and innovation in production processes have always lacked behind in developing countries and therefore imports remained an integral part of the Balance of Payments adjustment process. Economic crisis that originated out of external payments problem during early nineties had enormous links with imports that could not be met by the existing reserves and ultimately the Government had to sell gold, undertake devaluation activities and borrow money from international agencies. Variability in the overall imports is quite often influenced by dynamics of individual variabilities in the concerned import items depending upon the weight age in the composition of total imports. The variability has been observed phenomenally high for the sub-periods one and four as compared to other sub-periods which is noticed to be moderate. Therefore, overall imports have not had a smooth and consistent behavioural pattern but rather they were subjected to considerable variability. However it is fairly clear, after analyzing the estimates of mean and measures for variability on the principal categories of imports, that the extent of variability for India’s import categories are fairly high. Instability and variability are the root cause of major economic ups and downs and these happen to be in various categories of imports which play a predominant role in the management of sustainable trade and current account balances. The policy framework of moderating imports has been there for some time now and the time has come to rationalize, not further globalize, the trade flows that are consistent with growth, employment and inflation.
KEYWORDS:
Coefficient of Variation, Current Account Balance, Liberalization, Principal Commodities of Imports, Skewness and Kurtosis.*Corresponding author
Dr. K. Shanmugan
Associate Professor,
IJSRR, 7(4) Oct. – Dec., 2018 Page 468
I. INTRODUCTION
Growth and Development are largely affected by behavioural changes and trends in the overall imports and in particular various categories of imports that might adapt to the basket of key imports. Developing countries require good amount of imports in terms of raw materials, technologies and capital know-how and in fact some of the basic industries of critical importance depended on the imports particularly from the developed world. Technological gaps, inventions in Research and Development (R&D) and innovation in production processes have always lacked behind in developing countries and therefore imports of capital goods, technology and key intermediary commodities remained integral parts of the Balance of Payments (BOP) adjustment process. Sometimes, the adjustment process is very costly and it becomes very difficult as a result of increasing and sometimes unsustainable import requirements which are necessary for development. Import substitution policies, both for quantity restrictions and raising revenues, have become irrelevant in the context of Globalization. Freer trade, quicker access to services and goods and, demand and requirement of consumers have dismantled the regulations that are typically argued for industrial development and sovereignty of the nation. In fact, the very nation building and expansion in the industrial activities by judiciously allowing imports have become critical for lifting the serious problems such as poverty, malnutrition, unemployment and social development.
IJSRR, 7(4) Oct. – Dec., 2018 Page 469
II. BACKGROUND
Economic crisis that originated out of external payments problem during early nineties had enormous links with imports that could not be met by the existing reserves and ultimately the Government had to sell gold, undertake devaluation activities and borrow money from international agencies. Subsequently, imports have been posing some serious consequences to the adjustment process in BOP. Aggregate Imports have risen from rupees 51470 crores in 1991-92 to rupees 2633395 crores to the tune of almost 51 times within the twenty six years of liberalized scenario. Exports could not keep pace with imports as exports grew approximately 40 times for the same period, thereby putting an enormous pressure on trade balance. To some extent, invisibles have compensated the current account adjustment but trade account continued to face unsustainable situations. Imports have grown from 7.87 percentages of Gross Domestic Product (GDP) in 1991-92 to the highest level of 25.07 percent of GDP in 2013-14. Subsequently, a marginal decline is noticed. Fortunately this steady rise in the imports has been accompanied by strong positive net capital flows and well-accumulated reserves with the monetary authority.
It is more important to note that it is not the quantity of imports that is more important but more crucial consideration is the behaviour of imports over time and the variability associated with various groups of imports that make up the basket. This paper attempts to investigate how the behaviour of various components of total imports, and their variabilities, have contributed to the economic management of external sector. The objective of the paper is to throw some light on the dynamics of trend that can be observed from the distributional characteristics of information on various imports. This study makes some observations on different categories of imports that are evident from the data without resorting to any hardcore macro econometric modelling and yet brings out some meaningful inferences.
III. DATA AND METHOD
IJSRR, 7(4) Oct. – Dec., 2018 Page 470
behaviour, trends and variability’s pertaining to different categories of imports. The estimates are reported at the end of this paper.
Information and data pertaining to various categories of imports are available from most of the well-known official sources and some of the private data disseminating houses do give detailed account of imports, but the choice has been made to collect data from sources of RBI and Government of India. This is obvious because the standard classification available with these sources do give time series data. The various classifications reported across time have not been uniform both in terms of their coverage as well as with reference to the items that are included without overlapping. In other words, we find that some items are discontinued in some classification and new items are emerging in others. There is some amount of overlapping in shifting a particular item or items from one category to another category. In order to make various classifications of principal commodities of imports we have structured the classifications broadly in line with the Handbook of Statistics on Indian Economy and organized the data to give uniform broad information. The details are reported in the Appendix of this article and further the appendix includes tables in the form of estimates.
IV. DISAGGREGATED ANALYSIS
IJSRR, 7(4) Oct. – Dec., 2018 Page 471
1. Agriculture and other related products
This category consists of cereals, edible oil, pulses, cotton, sugar, wood and other processed items including pulp. India, being a fast developing economy, has been based on very strong footings on agriculture sector and hence, the percentage share of agricultural commodities in the overall imports is relatively less. The percentage share has declined from 4.92 percent in 1991-92 to 0.92 percent in 2003-04 and then onwards one finds highly unstable percentage share in total imports. Annual growth rates for the same are abnormally fluctuating with growth rates highly varying between the range of 99.25 percent to -24.39 percent. This indicates the demand and supply gap that exists in the demand for food and agricultural products and the need for addressing food security. Any deficiency in the production of food products will immediately shoot the inflation and this cannot be addressed by monetary policy mechanism. Mismanagement in the buffer stocks have been leading to abnormal rise and fall in the imports of food products. Mean value of percentage share across sub-periods are also fluctuating with very less CV and variance. Therefore, the fluctuation is efficient and significant. Annual growth rates of mean across sub-periods have been very high. Along with volatile percentage share, high annual growth rates of mean values indicates the importance of imports for fulfilling this demand and supply gap.
2. Fertilizers
IJSRR, 7(4) Oct. – Dec., 2018 Page 472
3. Minerals and leather products
This commodity group includes non-metallic mineral manufactures, sulphur and unroasted iron, coal, coke, non-ferocious metals, leather products and metals scrap. Quite a good number of commodities with varying degrees of substitutability in themselves are grouped together. This commodity group remained very high in imports and in terms of percentage share it occupies the first position, thereby indicating that the imports of minerals and leather continued to be not only crucial for consumption but more importantly for production purposes. As one would observe, the sub-items included in this group of principal imports, most of them serve to be an input for basic and heavy industries and industries of national importance. Presumably, considerations to reduce the imports might not be an economically viable solution given the context. Annual growth rates of the same have varied significantly. The range of annual growth rates is worked out to be 83.48 percent to 25.93 percent. These variations in the annual growth rates can be traced back to the price and exchange rate factors rather than demand and supply driven mechanisms. Mean value of percentage share remained very high. The variations in the mean value are observed to be very narrow but for the same item mean value of annual growth rates fluctuated widely. Despite estimated variances are being very large across all sub-periods the fluctuations in the mean values of annual growth rates happened to be significant for imports. In fact, mean annual growth rate for the last sub-period is around 6 percent even when the percentage share remained as high as 30 percent. Variations in the mean values of percent growth are moderate.
4. Petroleum and petroleum products
IJSRR, 7(4) Oct. – Dec., 2018 Page 473
petroleum imports. Accordingly, they played their role in building inflationary pressures and expectations. Mean value of annual growth rates have also enormously fluctuated across all sub-periods. In fact, the mean value itself ranges from 29 percent to -2.3 percent. Wherein, CV seems to be abnormally high. In each sub-period the standard deviation happened to be higher than mean even where variability is moderate. Variability in the percentage share expressed in terms of CV is relatively low indicating that the significance of petroleum consumption more or less remained strong and consistent.
5. Chemical and related goods
This category is made up of organic and inorganic chemicals, textile yarn and fabrics, dyeing and colouring materials, artificial resins, plastic materials, chemical materials, etc. The significance of import of chemical and other related materials have considerably declined over a period of time. This is an important indication of local production and supply conditions. As it can be seen in the Table 1 the percentage share of chemical and other related commodities have declined from 10.08 percent in 1991-92 to around 6 percent in 2016-17. Mean value of percentage share has also diminished steadily across all periods. Incidentally, variability in the same seems to be low and moderate. Annual growth rates of the chemical related products have their own share of variations but variability seems to be comparatively less given that its range is from 48 percent to -7.62 percent. This annual growth rate of -7.62 percent is exclusively the only negative growth rate across all years during the sample period. Even then the mean values of annual growth rates fluctuated somewhat, the variability of the same is comparatively less across all sub-periods. This is because of the sound growth of industrial base of chemicals in India and local supplies have put pressure on quantum imports of chemicals.
6. Pearls and precious stones
IJSRR, 7(4) Oct. – Dec., 2018 Page 474
growth rates are very high. Mean values of percentage share have declined over a period of time. The decline in the share is accompanied by less variability.
7. Iron, machines and transport equipments
This product category includes iron and steel, manufacture of metals, machine tools, transport and project equipments, scientific controlling equipments, etc. This category occupies the second most important position in the overall import basket. Percentage share remained almost similar with 3 percentage variation around the average percentage share. Mean value of percentage share almost remained fairly stable along with very low variance, standard deviation and CV. But if one observes the annual growth rates, which is more important measure for the short run adjustment in the stocks or in demand, the variability is moderately high. In terms of its range, it is anywhere between 50 percent to -20 percent. The mean values of annual growth rates pertaining to this category have fluctuated across sub-periods. Standard deviation worked out to be higher than mean except for the third sub-period while covariance remained very high indicating variabilities involved in the import of these goods.
8. Machineries and electronic goods
This classification of principal imports encompasses Machinery except Electricals and Electronics, Electrical Machinery except Electronics, and includes Electronics and Computer Goods. The percentage share of exports have been very low but steadily increased from 2010-11 onwards. Some of the key items that are not reflected in the imports are essentially produced by trans-national and multinational companies. Electronic and computer items are predominantly Indian but its production origin is foreign. Mean value of percentage share has increased marginally and annual growth rates for the same are again observed to be very high. The annual growth rates vary from 123.53 percent to -19.79 percent during the sample period. Mean value of annual growth rates has remained more or less the same except for the last sub-period. Surprisingly, the variability is comparatively moderate and absolute estimates of variance declined over a period of time. Excess kurtosis fluctuated across sample period.
9. Gold and silver
IJSRR, 7(4) Oct. – Dec., 2018 Page 475
Notwithstanding its social and cultural importance to boost demand domestically, imports of gold remained a major source of inputs for production of gems and jewelleries. Its percentage share in total imports has increased considerably over time. Probably, this is one item where variability has been observed phenomenally high as the imports must have been sensitive to exchange rate variations and domestic price movements of gold. In terms of range, annual growth rates varied anywhere between 234.6 percent to -36.2 percent. CV of annual growth rates worked out to be very large.
10. Medical, pharmaceutical and other products
Advanced medical treatment, importance of medical laboratories, medical tourism, pharmaceutical innovations and an increase in demand for life saving drugs and important medicines have pushed the imports of this category especially after 2000-01, The mean value of percentage share for this category is estimated to be somewhere around 9 percentage across the sample period and has remained more or less the same for the last three sub-periods. Variance, standard deviation and CV are fairly very low indicating rather its stable import demand but in terms of annual growth rates, some variability is observed. Mean value of annual growth rates have fluctuated with a large degree of CV associated with them. Other commodities essentially include those miscellaneous items that are not grouped in any specific category narrated here and also commodities that are discontinued at some point in time from the import list as well as some new import items. As these are scattered around various categories, examining their variability carries a less meaningful exercise. One can observe that their mean percentage share across sub-periods has declined. Average of annual growth rates expressed in terms of mean has less variability.
V. BEHAVIOUR OF TOTAL IMPORTS
IJSRR, 7(4) Oct. – Dec., 2018 Page 476
the annual growth rate occurred during the last sub-period as mean of annual growth rate fell down to 2.08 percent. The variability has been observed phenomenally high for the sub-periods one and four as compared to other periods which is noticed to be moderate. Therefore, overall imports have not had a smooth and consistent behavioural pattern and rather they were subjected to considerable variability.
VI. CRITICAL REFLECTIONS
The focus of this analysis is to understand the dynamics of variability in terms of its pattern of growth expressed with reference to the descriptive statistical measures. More sophisticated instability frameworks are not employed for analysis. However it is fairly clear, after analyzing the estimates of mean and measures for variability on the principal categories of imports, that the extent of variability for India’s import categories are fairly high. Instability and variability are the root cause of major economic ups and downs and these happen to be in various categories of imports which play a predominant role in the management of sustainable trade and current account balances.
IJSRR, 7(4) Oct. – Dec., 2018 Page 477
VII. CONCLUSIONS
This study in its simplistic framework throws some meaningful understanding about how individual categories of import groups have been unstable during the study period. Instability in imports produces unwarranted expectations for both consumption and production thereby somewhat it may put pressure on exchange rate and inflation. The policy framework of moderating the imports has been there for some time now and the time has come to rationalize, not further globalize, the trade flows that are consistent with growth, employment and inflation. Relooking and revisiting the import policies in order to promote stable growth of imports especially in terms of annual growth rates of the same are critically important for long term BOP adjustment process and targeted growth trajectory.
REFERENCES
1. Andriamananjara, S. & Nash, J. Have trade policy reforms led to greater openness in developing countries? Policy Research Working Paper 1730, The World Bank Washington DC, 1997.
2. Bagchi, S. End of Quantitative Import Restrictions: Unfounded Fears. Economic and Political Weekly. 2001; 36 (18): 1500-1503.
3. Dutta, M. Import Structure of India. The Review of Economics and Statistics. 1965; 47(3): 295-300.
4. Giansoldati, M.& Gregori, T. A note on the estimation of import trade demand functions. Economics Letters. 2017; 157: 133-135.
5. Goldberg, P. K., Khandelwal, A. K., Pavcnik, N. & Topalova, P. Imported Intermediate Inputs and Domestic Product Growth: Evidence from India. The Quarterly Journal of Economics. 2010; 125 (4): 1727–1767.
6. Goldberg, P. Khandelwal, A. Pavcnik, P. and Topalova, P. Trade Liberalization and New Imported Inputs. American Economic Review. 2009; 99(2): 494-500.
IJSRR, 7(4) Oct. – Dec., 2018 Page 478
Appendix
Classification of Principal Commodities of India’s Imports
Principal Commodity Groups Items
Agricultural and Other related goods Cereals and Cereal Preparations, Edible Oils, Pulses, Fruits & vegetables, Cotton Raw & Waste, Sugar, Wood
& Wood products, Cashew Nuts, Paper, Paper Boards, Manufactures including News Prints, Crude Rubber, including Synthetic and Reclaimed, Pulp and Waste Paper
Fertilisers Fertilizer including organic and inorganic varieties. Some
of the intermediary products for fertilizer production.
Minerals and lather Non-Metallic Mineral Manufactures, Crude, Sulphur and
Unroasted Iron Pyrites, Manufactured, Coal, Coke and Briquittes, etc., Non-Ferrous Metals, Leather & leather
products, Metalliferrous Ores, Metal Scrap, etc.
Petroleum, Crude and Products Petroleum and petroleum products, mainly import of crude oil.
Chemical and related goods Organic and Inorganic Chemicals,
Dyeing/tanning/colouring materials, Textile Yarn, Fabrics, Made-Ups, etc., Artificial Resins and Plastic Materials,
etc., Chemical Materials and Products
Pearls, Precious and Semi-Precious Stones Precious stones, unpolished precious stones, pearls and rare stones and, synthetic stones.
Iron, Machine, Project and Transport Equipment Iron and Steel, Manufactures of Metals, Machine Tools, Transport Equipment, Professional, Scientific Controlling Instruments, Photographic Optical Goods , Project Goods
Machineries and Electronic Goods Machinery except Electrical and Electronic, Electrical Machinery except Electronic, Electronic Goods,
Computer Goods
Medicinal and Pharmaceutical Products Medicinal and pharmaceutical products including special and life-saving drugs and, also intermediate products.
Gold and Silver Gold and Silver.
Others Includes all other items that are not classified into any of
IJSRR, 7(4) Oct. – Dec., 2018 Page 479
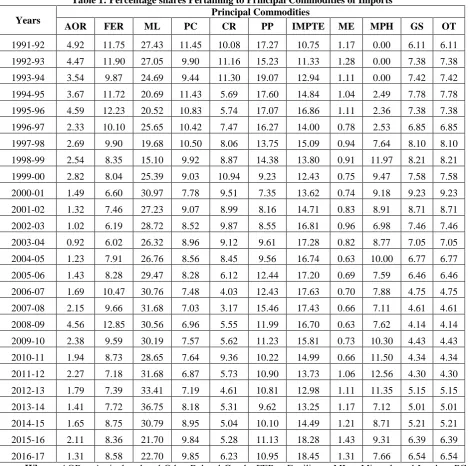
Table 1: Percentage shares Pertaining to Principal Commodities of Imports
Years Principal Commodities
AOR FER ML PC CR PP IMPTE ME MPH GS OT
1991-92 4.92 11.75 27.43 11.45 10.08 17.27 10.75 1.17 0.00 6.11 6.11
1992-93 4.47 11.90 27.05 9.90 11.16 15.23 11.33 1.28 0.00 7.38 7.38
1993-94 3.54 9.87 24.69 9.44 11.30 19.07 12.94 1.11 0.00 7.42 7.42
1994-95 3.67 11.72 20.69 11.43 5.69 17.60 14.84 1.04 2.49 7.78 7.78
1995-96 4.59 12.23 20.52 10.83 5.74 17.07 16.86 1.11 2.36 7.38 7.38
1996-97 2.33 10.10 25.65 10.42 7.47 16.27 14.00 0.78 2.53 6.85 6.85
1997-98 2.69 9.90 19.68 10.50 8.06 13.75 15.09 0.94 7.64 8.10 8.10
1998-99 2.54 8.35 15.10 9.92 8.87 14.38 13.80 0.91 11.97 8.21 8.21
1999-00 2.82 8.04 25.39 9.03 10.94 9.23 12.43 0.75 9.47 7.58 7.58
2000-01 1.49 6.60 30.97 7.78 9.51 7.35 13.62 0.74 9.18 9.23 9.23
2001-02 1.32 7.46 27.23 9.07 8.99 8.16 14.71 0.83 8.91 8.71 8.71
2002-03 1.02 6.19 28.72 8.52 9.87 8.55 16.81 0.96 6.98 7.46 7.46
2003-04 0.92 6.02 26.32 8.96 9.12 9.61 17.28 0.82 8.77 7.05 7.05
2004-05 1.23 7.91 26.76 8.56 8.45 9.56 16.74 0.63 10.00 6.77 6.77
2005-06 1.43 8.28 29.47 8.28 6.12 12.44 17.20 0.69 7.59 6.46 6.46
2006-07 1.69 10.47 30.76 7.48 4.03 12.43 17.63 0.70 7.88 4.75 4.75
2007-08 2.15 9.66 31.68 7.03 3.17 15.46 17.43 0.66 7.11 4.61 4.61
2008-09 4.56 12.85 30.56 6.96 5.55 11.99 16.70 0.63 7.62 4.14 4.14
2009-10 2.38 9.59 30.19 7.57 5.62 11.23 15.81 0.73 10.30 4.43 4.43
2010-11 1.94 8.73 28.65 7.64 9.36 10.22 14.99 0.66 11.50 4.34 4.34
2011-12 2.27 7.18 31.68 6.87 5.73 10.90 13.73 1.06 12.56 4.30 4.30
2012-13 1.79 7.39 33.41 7.19 4.61 10.81 12.98 1.11 11.35 5.15 5.15
2013-14 1.41 7.72 36.75 8.18 5.31 9.62 13.25 1.17 7.12 5.01 5.01
2014-15 1.65 8.75 30.79 8.95 5.04 10.10 14.49 1.21 8.71 5.21 5.21
2015-16 2.11 8.36 21.70 9.84 5.28 11.13 18.28 1.43 9.31 6.39 6.39
2016-17 1.31 8.58 22.70 9.85 6.23 10.95 18.45 1.31 7.66 6.54 6.54
Where; AOR = Agricultural and Other Related Goods, FER = Fertilizers, ML = Minerals and Leather, PC = Petroleum, Crude and related Products, CR = Chemicals and Related Goods, PP = Pearls, Precious and Semi Precious Stones, IMPTE = Iron, Machine, Project and Transport Equipment, ME = Machineries and Electronic Goods, MPH = Medicinal and Pharmaceutical Products, GS = Gold and Silver and, OT = Unclassified items.
IJSRR, 7(4) Oct. – Dec., 2018 Page 480
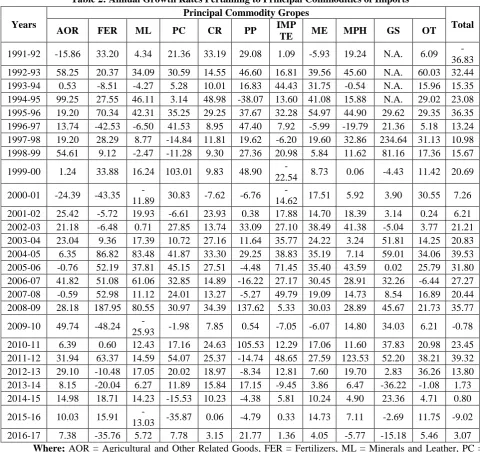
Table 2: Annual Growth Rates Pertaining to Principal Commodities of Imports
Years
Principal Commodity Gropes
Total
AOR FER ML PC CR PP IMP
TE ME MPH GS OT
1991-92 -15.86 33.20 4.34 21.36 33.19 29.08 1.09 -5.93 19.24 N.A. 6.09
-36.83
1992-93 58.25 20.37 34.09 30.59 14.55 46.60 16.81 39.56 45.60 N.A. 60.03 32.44
1993-94 0.53 -8.51 -4.27 5.28 10.01 16.83 44.43 31.75 -0.54 N.A. 15.96 15.35
1994-95 99.25 27.55 46.11 3.14 48.98 -38.07 13.60 41.08 15.88 N.A. 29.02 23.08
1995-96 19.20 70.34 42.31 35.25 29.25 37.67 32.28 54.97 44.90 29.62 29.35 36.35
1996-97 13.74 -42.53 -6.50 41.53 8.95 47.40 7.92 -5.99 -19.79 21.36 5.18 13.24
1997-98 19.20 28.29 8.77 -14.84 11.81 19.62 -6.20 19.60 32.86 234.64 31.13 10.98
1998-99 54.61 9.12 -2.47 -11.28 9.30 27.36 20.98 5.84 11.62 81.16 17.36 15.67
1999-00 1.24 33.88 16.24 103.01 9.83 48.90
-22.54 8.73 0.06 -4.43 11.42 20.69
2000-01 -24.39 -43.35
-11.89 30.83 -7.62 -6.76
-14.62 17.51 5.92 3.90 30.55 7.26
2001-02 25.42 -5.72 19.93 -6.61 23.93 0.38 17.88 14.70 18.39 3.14 0.24 6.21
2002-03 21.18 -6.48 0.71 27.85 13.74 33.09 27.10 38.49 41.38 -5.04 3.77 21.21
2003-04 23.04 9.36 17.39 10.72 27.16 11.64 35.77 24.22 3.24 51.81 14.25 20.83
2004-05 6.35 86.82 83.48 41.87 33.30 29.25 38.83 35.19 7.14 59.01 34.06 39.53
2005-06 -0.76 52.19 37.81 45.15 27.51 -4.48 71.45 35.40 43.59 0.02 25.79 31.80
2006-07 41.82 51.08 61.06 32.85 14.89 -16.22 27.17 30.45 28.91 32.26 -6.44 27.27
2007-08 -0.59 52.98 11.12 24.01 13.27 -5.27 49.79 19.09 14.73 8.54 16.89 20.44
2008-09 28.18 187.95 80.55 30.97 34.39 137.62 5.33 30.03 28.89 45.67 21.73 35.77
2009-10 49.74 -48.24
-25.93 -1.98 7.85 0.54 -7.05 -6.07 14.80 34.03 6.21 -0.78
2010-11 6.39 0.60 12.43 17.16 24.63 105.53 12.29 17.06 11.60 37.83 20.98 23.45
2011-12 31.94 63.37 14.59 54.07 25.37 -14.74 48.65 27.59 123.53 52.20 38.21 39.32
2012-13 29.10 -10.48 17.05 20.02 18.97 -8.34 12.81 7.60 19.70 2.83 36.26 13.80
2013-14 8.15 -20.04 6.27 11.89 15.84 17.15 -9.45 3.86 6.47 -36.22 -1.08 1.73
2014-15 14.98 18.71 14.23 -15.53 10.23 -4.38 5.81 10.24 4.90 23.36 4.71 0.80
2015-16 10.03 15.91
-13.03 -35.87 0.06 -4.79 0.33 14.73 7.11 -2.69 11.75 -9.02
2016-17 7.38 -35.76 5.72 7.78 3.15 21.77 1.36 4.05 -5.77 -15.18 5.46 3.07
Where; AOR = Agricultural and Other Related Goods, FER = Fertilizers, ML = Minerals and Leather, PC = Petroleum, Crude and related Products, CR = Chemicals and Related Goods, PP = Pearls, Precious and Semi Precious Stones, IMPTE = Iron, Machine, Project and Transport Equipment, ME = Machineries and Electronic Goods, MPH = Medicinal and Pharmaceutical Products, GS = Gold and Silver and, OT = Unclassified items.
IJSRR, 7(4) Oct. – Dec., 2018 Page 481
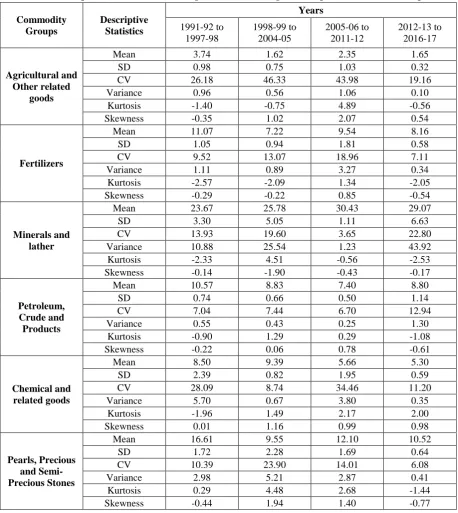
Table 3: Descriptive Statistics of Percentage shares Pertaining to Principal Commodities of Imports
Commodity Groups Descriptive Statistics Years 1991-92 to 1997-98 1998-99 to 2004-05 2005-06 to 2011-12 2012-13 to 2016-17 Agricultural and Other related goods
Mean 3.74 1.62 2.35 1.65
SD 0.98 0.75 1.03 0.32
CV 26.18 46.33 43.98 19.16
Variance 0.96 0.56 1.06 0.10
Kurtosis -1.40 -0.75 4.89 -0.56
Skewness -0.35 1.02 2.07 0.54
Fertilizers
Mean 11.07 7.22 9.54 8.16
SD 1.05 0.94 1.81 0.58
CV 9.52 13.07 18.96 7.11
Variance 1.11 0.89 3.27 0.34
Kurtosis -2.57 -2.09 1.34 -2.05
Skewness -0.29 -0.22 0.85 -0.54
Minerals and lather
Mean 23.67 25.78 30.43 29.07
SD 3.30 5.05 1.11 6.63
CV 13.93 19.60 3.65 22.80
Variance 10.88 25.54 1.23 43.92
Kurtosis -2.33 4.51 -0.56 -2.53
Skewness -0.14 -1.90 -0.43 -0.17
Petroleum, Crude and Products
Mean 10.57 8.83 7.40 8.80
SD 0.74 0.66 0.50 1.14
CV 7.04 7.44 6.70 12.94
Variance 0.55 0.43 0.25 1.30
Kurtosis -0.90 1.29 0.29 -1.08
Skewness -0.22 0.06 0.78 -0.61
Chemical and related goods
Mean 8.50 9.39 5.66 5.30
SD 2.39 0.82 1.95 0.59
CV 28.09 8.74 34.46 11.20
Variance 5.70 0.67 3.80 0.35
Kurtosis -1.96 1.49 2.17 2.00
Skewness 0.01 1.16 0.99 0.98
Pearls, Precious and Semi-Precious Stones
Mean 16.61 9.55 12.10 10.52
SD 1.72 2.28 1.69 0.64
CV 10.39 23.90 14.01 6.08
Variance 2.98 5.21 2.87 0.41
Kurtosis 0.29 4.48 2.68 -1.44
IJSRR, 7(4) Oct. – Dec., 2018 Page 482
Table 3: Contd.
Iron, Machine, Project and
Transport Equipment
Mean 13.69 15.06 16.21 15.49
SD 2.17 1.89 1.45 2.68
CV 15.83 12.57 8.92 17.33
Variance 4.69 3.58 2.09 7.21
Kurtosis -0.90 -1.91 -0.32 -3.12
Skewness -0.06 -0.06 -0.88 0.42
Machineries and Electronical
Goods
Mean 1.06 0.81 0.73 1.25
SD 0.16 0.11 0.15 0.12
CV 15.24 13.67 20.07 9.98
Variance 0.03 0.01 0.02 0.02
Kurtosis 0.53 -0.17 6.00 -0.28
Skewness -0.60 -0.14 2.40 0.77
Medicinal and Pharmaceutical
Products
Mean 2.15 9.33 9.22 8.83
SD 2.72 1.50 2.20 1.65
CV 126.61 16.04 23.83 18.69
Variance 7.39 2.24 4.83 2.72
Kurtosis 2.94 1.96 -1.61 0.57
Skewness 1.58 0.39 0.66 0.88
Gold and Silver
Mean 7.29 7.86 4.72 5.66
SD 0.65 0.89 0.80 0.74
CV 8.88 11.37 16.87 13.10
Variance 0.42 0.80 0.63 0.55
Kurtosis 1.16 -1.09 5.59 -3.13
Skewness -0.92 0.43 2.30 0.59
Others
Mean 7.29 7.86 4.72 5.66
SD 0.65 0.89 0.80 0.74
CV 8.88 11.37 16.87 13.10
Variance 0.42 0.80 0.63 0.55
Kurtosis 1.16 -1.09 5.59 -3.13
Skewness -0.92 0.43 2.30 0.59
Notes: Descriptive statistics are calculated for seven year periods for each period except for the last period where the last five years are put together. SD and CV refer to Standard Deviation and Coefficient of Variation respectively.
IJSRR, 7(4) Oct. – Dec., 2018 Page 483
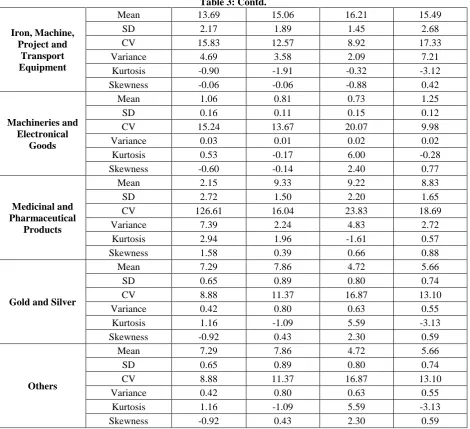
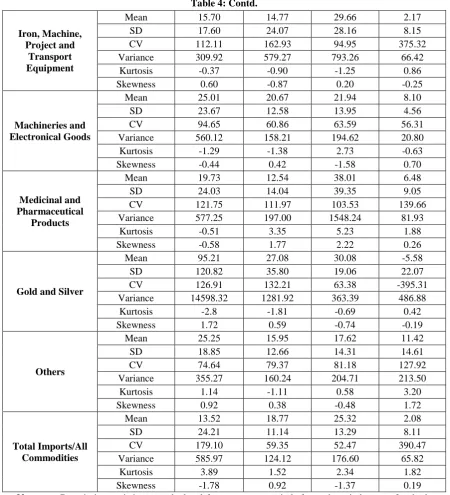
Table 4: Descriptive Statistics of Annual Growth Rates Pertaining to Principal Commodities of Imports
Commodity Groups Descriptive Statistics Years 1991-92 to 1997-98 1998-99 to 2004-05 2005-06 to 2011-12 2012-13 to 2016-17 Agricultural and Other related goods
Mean 27.76 15.35 22.39 13.93
SD 38.79 24.48 20.70 8.98
CV 139.74 159.45 92.45 64.50
Variance 1504.67 599.10 428.42 80.68
Kurtosis 1.03 1.01 -1.98 2.78
Skewness 1.15 -0.07 0.01 1.70
Fertilizers
Mean 18.39 11.95 51.42 -6.33
SD 35.45 40.44 72.23 23.42
CV 192.78 338.41 140.47 -369.66
Variance 1256.36 1635.15 5217.19 548.26
Kurtosis 1.00 1.79 2.36 -2.08
Skewness -0.53 0.88 0.88 -0.05
Minerals and lather
Mean 17.83 17.63 27.37 6.05
SD 22.39 31.37 35.50 11.75
CV 125.54 177.97 129.70 194.19
Variance 501.31 984.23 1260.55 137.99
Kurtosis -2.25 4.14 -0.26 1.95
Skewness 0.27 1.87 0.15 -1.30
Petroleum, Crude and Products
Mean 17.47 28.06 28.89 -2.34
SD 20.33 38.44 18.41 22.93
CV 116.37 137.01 63.72 -978.73
Variance 413.38 1477.65 338.86 525.90
Kurtosis -0.98 2.19 0.29 -0.79
Skewness -0.46 1.30 -0.40 -0.86
Chemical and related goods
Mean 22.39 15.66 21.13 9.65
SD 15.15 13.73 9.34 8.06
CV 67.67 87.69 44.22 83.49
Variance 229.61 188.63 87.30 64.92
Kurtosis -0.20 0.05 -1.15 -2.29
Skewness 0.96 -0.50 -0.10 -0.09
Pearls, Precious and Semi-Precious Stones
Mean 22.73 20.55 29.00 4.28
SD 29.39 19.64 64.19 14.03
CV 129.30 95.58 221.34 327.78
Variance 863.95 385.89 4119.73 196.97
Kurtosis 3.61 -0.99 -0.32 -2.89
IJSRR, 7(4) Oct. – Dec., 2018 Page 484
Table 4: Contd.
Iron, Machine, Project and
Transport Equipment
Mean 15.70 14.77 29.66 2.17
SD 17.60 24.07 28.16 8.15
CV 112.11 162.93 94.95 375.32
Variance 309.92 579.27 793.26 66.42
Kurtosis -0.37 -0.90 -1.25 0.86
Skewness 0.60 -0.87 0.20 -0.25
Machineries and Electronical Goods
Mean 25.01 20.67 21.94 8.10
SD 23.67 12.58 13.95 4.56
CV 94.65 60.86 63.59 56.31
Variance 560.12 158.21 194.62 20.80
Kurtosis -1.29 -1.38 2.73 -0.63
Skewness -0.44 0.42 -1.58 0.70
Medicinal and Pharmaceutical
Products
Mean 19.73 12.54 38.01 6.48
SD 24.03 14.04 39.35 9.05
CV 121.75 111.97 103.53 139.66
Variance 577.25 197.00 1548.24 81.93
Kurtosis -0.51 3.35 5.23 1.88
Skewness -0.58 1.77 2.22 0.26
Gold and Silver
Mean 95.21 27.08 30.08 -5.58
SD 120.82 35.80 19.06 22.07
CV 126.91 132.21 63.38 -395.31
Variance 14598.32 1281.92 363.39 486.88
Kurtosis -2.8 -1.81 -0.69 0.42
Skewness 1.72 0.59 -0.74 -0.19
Others
Mean 25.25 15.95 17.62 11.42
SD 18.85 12.66 14.31 14.61
CV 74.64 79.37 81.18 127.92
Variance 355.27 160.24 204.71 213.50
Kurtosis 1.14 -1.11 0.58 3.20
Skewness 0.92 0.38 -0.48 1.72
Total Imports/All Commodities
Mean 13.52 18.77 25.32 2.08
SD 24.21 11.14 13.29 8.11
CV 179.10 59.35 52.47 390.47
Variance 585.97 124.12 176.60 65.82
Kurtosis 3.89 1.52 2.34 1.82
Skewness -1.78 0.92 -1.37 0.19
Notes: Descriptive statistics are calculated for seven year periods for each period except for the last period where the last five years are put together. SD and CV refer to Standard Deviation and Coefficient of Variation respectively.