Atmos. Meas. Tech., 6, 275–299, 2013 www.atmos-meas-tech.net/6/275/2013/ doi:10.5194/amt-6-275-2013
© Author(s) 2013. CC Attribution 3.0 License.
EGU Journal Logos (RGB)
Advances in
Geosciences
Open Access
Natural Hazards
and Earth System
Sciences
Open AccessAnnales
Geophysicae
Open AccessNonlinear Processes
in Geophysics
Open AccessAtmospheric
Chemistry
and Physics
Open AccessAtmospheric
Chemistry
and Physics
Open Access DiscussionsAtmospheric
Measurement
Techniques
Open AccessAtmospheric
Measurement
Techniques
Open Access DiscussionsBiogeosciences
Open Access Open Access
Biogeosciences
DiscussionsClimate
of the Past
Open Access Open Access
Climate
of the Past
Discussions
Earth System
Dynamics
Open Access Open Access
Earth System
Dynamics
DiscussionsGeoscientific
Instrumentation
Methods and
Data Systems
Open Access
Geoscientific
Instrumentation
Methods and
Data Systems
Open Access DiscussionsGeoscientific
Model Development
Open Access Open Access
Geoscientific
Model Development
DiscussionsHydrology and
Earth System
Sciences
Open AccessHydrology and
Earth System
Sciences
Open Access DiscussionsOcean Science
Open Access Open Access
Ocean Science
DiscussionsSolid Earth
Open Access Open Access
Solid Earth
DiscussionsThe Cryosphere
Open Access Open Access
The Cryosphere
Discussions
Natural Hazards
and Earth System
Sciences
Open Access
Discussions
Retrieval interval mapping: a tool to visualize the impact of the
spectral retrieval range on differential optical absorption
spectroscopy evaluations
L. Vogel1, H. Sihler1,2, J. Lampel1, T. Wagner2, and U. Platt1
1Institute of Environmental Physics, University of Heidelberg, Im Neuenheimer Feld 229, 69120 Heidelberg, Germany 2Max Planck Institute for Chemistry, Hahn-Mertner-Weg 1, 55128 Mainz, Germany
Correspondence to: L. Vogel ([email protected]), H. Sihler ([email protected])
Received: 15 March 2012 – Published in Atmos. Meas. Tech. Discuss.: 13 June 2012 Revised: 24 December 2012 – Accepted: 3 January 2013 – Published: 7 February 2013
Abstract. Remote sensing via differential optical absorption spectroscopy (DOAS) has become a standard technique to identify and quantify trace gases in the atmosphere. Due to the wide range of measurement conditions, atmospheric compositions and instruments used, a specific challenge of a DOAS retrieval is to optimize the retrieval parameters for each specific case and particular trace gas of interest. Of these parameters, the retrieval wavelength range is one of the most important ones. Although for many trace gases the overall dependence of common DOAS retrieval on the evaluation wavelength interval is known, a systematic ap-proach for finding the optimal retrieval wavelength range and quantitative assessment is missing. Here we present a novel tool to visualize the effect of different evaluation wavelength ranges. It is based on mapping retrieved column densities in the retrieval wavelength space and thus visualizing the con-sequences of different choices of spectral retrieval ranges caused by slightly erroneous absorption cross sections, cross correlations and instrumental features. Based on the informa-tion gathered, an optimal retrieval wavelength range may be determined systematically.
The technique is demonstrated using examples of a theo-retical study of BrO retrievals for stratospheric BrO and BrO measurements in volcanic plumes. However, due to the gen-eral nature of the tool, it is applicable to any type of DOAS retrieval (active or passive).
1 Introduction
Differential optical absorption spectroscopy (DOAS) is an established technique to quantify the concentration and dis-tribution of a large number of atmospheric gases in the ul-traviolet (UV), visible (Vis) and near-infrared (NIR) wave-length ranges (Platt and Stutz, 2008). The technique is based on the Lambert–Beer law (also known as Bouguer–Lambert law), which states that the intensity of electromagnetic ra-diation with an initial intensity I0 will decrease
exponen-tially depending on the amount of absorber present and its respective absorption cross section. The idea behind DOAS is to split the absorption cross section σ (λ) in its broad-band and narrow-broad-band parts (absorption structures widths typically smaller than a few nm). This narrow-band part is also called the differential absorption. Thus it is possible to determine the amount of various gases with sufficiently strong differential absorption features by splitting the total absorption into broad-band extinction and narrow-band ab-sorption. A suitable filter such as a polynomial can be ap-plied to describe the combined broad absorption structures together with Rayleigh and Mie extinction and broad-band instrumental features, whereas the amounts of trace gases of interest are derived from their narrow-band absorption tures. Due to the differences in differential absorption struc-tures, it is possible to retrieve different trace gases in the same measurement and spectral region. In this case, the recorded intensities need to be carefully separated in order to deter-mine the integrated concentration of the trace gases along the light path, the slant column density (SCD). In many sce-narios, the absorption of the trace gas of interest is concealed
276 L. Vogel et al.: DOAS retrieval interval mapping
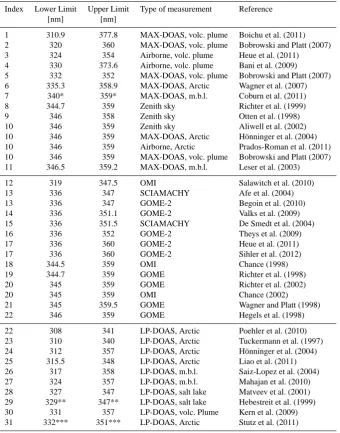
Table 1. Selection of published DOAS measurements of BrO and the respective retrieval wavelength intervals used for the DOAS evaluation. The list is ordered by ascending lower wavelength limit and type of measurement (ground-based and airborne in the upper part, satellite instruments in the bottom part). The index number is given for orientation and further reference in later figures. In general, the list indicates the broad range of wavelength intervals applied.
Index Lower Limit Upper Limit Type of measurement Reference [nm] [nm]
1 310.9 377.8 MAX-DOAS, volc. plume Boichu et al. (2011) 2 320 360 MAX-DOAS, volc. plume Bobrowski and Platt (2007) 3 324 354 Airborne, volc. plume Heue et al. (2011) 4 330 373.6 Airborne, volc. plume Bani et al. (2009) 5 332 352 MAX-DOAS, volc. plume Bobrowski and Platt (2007) 6 335.3 358.9 MAX-DOAS, Arctic Wagner et al. (2007) 7 340* 359* MAX-DOAS, m.b.l. Coburn et al. (2011) 8 344.7 359 Zenith sky Richter et al. (1999) 9 346 358 Zenith sky Otten et al. (1998) 10 346 359 Zenith sky Aliwell et al. (2002) 10 346 359 MAX-DOAS, Arctic H¨onninger et al. (2004) 10 346 359 Airborne, Arctic Prados-Roman et al. (2011) 10 346 359 MAX-DOAS, volc. plume Bobrowski and Platt (2007) 11 346.5 359.2 MAX-DOAS, m.b.l. Leser et al. (2003) 12 319 347.5 OMI Salawitch et al. (2010) 13 336 347 SCIAMACHY Afe et al. (2004) 13 336 347 GOME-2 Begoin et al. (2010) 14 336 351.1 GOME-2 Valks et al. (2009) 15 336 351.5 SCIAMACHY De Smedt et al. (2004) 16 336 352 GOME-2 Theys et al. (2009) 17 336 360 GOME-2 Heue et al. (2011) 17 336 360 GOME-2 Sihler et al. (2012) 18 344.5 359 OMI Chance (1998) 19 344.7 359 GOME Richter et al. (1998) 20 345 359 GOME Richter et al. (2002)
20 345 359 OMI Chance (2002)
21 345 359.5 GOME Wagner and Platt (1998) 22 346 359 GOME Hegels et al. (1998) 22 308 341 LP-DOAS, Arctic Poehler et al. (2010) 23 310 340 LP-DOAS, Arctic Tuckermann et al. (1997) 24 312 357 LP-DOAS, Arctic H¨onninger et al. (2004) 25 315.5 348 LP-DOAS, Arctic Liao et al. (2011) 26 317 358 LP-DOAS, m.b.l. Saiz-Lopez et al. (2004) 27 324 357 LP-DOAS, m.b.l. Mahajan et al. (2010) 28 327 347 LP-DOAS, salt lake Matveev et al. (2001) 29 329** 347** LP-DOAS, salt lake Hebestreit et al. (1999) 30 331 357 LP-DOAS, volc. Plume Kern et al. (2009) 31 332*** 351*** LP-DOAS, Arctic Stutz et al. (2011)
* In addition, Coburn et al. (2011) applied a significance criterion consisting of logical AND combination of a 2-band (345–359 nm) and a 3-band (340–359 nm) evaluation of BrO (personal communication, October 2012). ** derived from Hebestreit et al. (1999), Fig. 1. *** 338.7–342.3 nm and 346.1–347.4 nm excluded..
by the presence of stronger absorbers. Small errors in refer-ence absorption cross sections (RCSs) might lead to small errors in the determination of the strong absorber, but can heavily influence the retrieval results of other much weaker absorbers.
DOAS instruments can be classified into active and pas-sive instruments, which apply artificial light sources or natu-ral light sources (scattered sun, direct sun, moon or starlight), respectively. Active DOAS instruments allow one to compare spectra of light before and after a beam has passed a known
(MAX-DOAS) from different platforms (ground-based, air-craft, balloon, ships and car traverses), which have been ap-plied to a multitude of scientific problems including measure-ments of volcanic plumes. For a comprehensive overview of different DOAS systems and the evaluation technique, see Platt and Stutz (2008).
The wavelength interval in which the DOAS retrieval is performed is one of the most important parameters of the re-trieval process. Obviously, the interval should include promi-nent absorption features of the trace gas of interest in order to obtain optimum sensitivity, whilst excluding strong ab-sorptions features of other trace gases and possible instru-mental artefacts. Thus, a balance has to be found between sensitivity and possible cross correlations. A broader inter-val increases the information available to the algorithm, but also introduces the danger of incorporating the strong ab-sorption structures of other gases present. In some cases, a broader wavelength range can increase errors due to insuf-ficient correction of the broad-band terms (Marquard et al., 2000; Puk¸ite et al., 2010). Other effects to be considered are the wavelength dependency of the Ring effect in presence of higher aerosol loads or clouds (e.g. Wagner et al., 2009, and references therein) and radiative transfer effects when measuring volcanic plumes (Kern et al., 2010). A narrower evaluation wavelength range on the other hand can lead to an increase in cross correlation between the different RCSs. Moreover, the retrieval might be more strongly influenced by the DOAS high-pass filtering (e.g. fitting of a polynomial).
Despite the importance of the problem, only a few at-tempts were made to systematically and quantitatively as-sess the influence of the retrieval wavelength range on the resulting SCDs. In most publications, the retrieval wave-length ranges applied are only motivated by a single compar-ison to one other retrieval wavelength range. Furthermore, a large variety of retrieval wavelength intervals have been used by different authors. This is illustrated in Table 1, which displays a selection of different retrieval wavelength ranges of bromine monoxide (BrO), which have been used in the past. Since the studies of BrO in Table 1 have been per-formed with different instruments from different platforms and strongly varying measurement conditions, a single re-trieval wavelength interval would not have been sufficient. Nevertheless, one wonders whether a total of 32 different retrieval wavelength intervals really represents the differ-ent requiremdiffer-ents of the various measuremdiffer-ent geometries and instruments used.
One of the few systematic studies on the retrieval of BrO was published by Aliwell et al. (2002), where DOAS retrievals were studied for measurements of stratospheric BrO via ground-based zenith-looking instruments at mid-latitudes. In that case, one faces lowBrO SCDs combined with very high ozone O3 SCDs, which interfere with the
evaluation since measurements are conducted at a high so-lar zenith angles (SZA). Aliwell et al. (2002) found an op-timal retrieval range from 346 nm to 359 nm, which limits
cross correlations with O3 but encompasses only two,
rel-atively weak, BrO absorption bands in the retrieval. Theys et al. (2007) supported the suggested wavelength range with an additional radiative transfer study. The results of these studies, however, can not be unambiguously transferred to the retrieval of BrO under any measurement condition (dif-ferences in BrO SCDs, SZA, time difference between the measurement of the Fraunhofer reference spectrum and the measurement spectrum, etc.). Similar studies for other mea-surement conditions and trace gases are sparse (for NO2, e.g.
Roscoe et al., 2010). Furthermore, the effects of different re-trieval intervals have not been studied systematically over a broad range of retrieval intervals for any trace gas.
In this study, we introduce a novel tool that is suitable for systematically and quantitatively studying the influence of the retrieval wavelength interval on the results and quality of the DOAS retrieval. It consists of contour plots of DOAS re-trieval results where the lower and upper limits of rere-trieval wavelength intervals are the coordinates, while the value of retrieved column density or the value of any other retrieval parameter of interest (e.g. fit error,χ2value as a measure of the overall goodness of the fitting algorithm’s results, possi-ble shifts in wavelength calibration by the algorithm) is plot-ted colour coded (see Sect. 2). These retrieval maps enable an easy visualization of the results for a large set of evalua-tion wavelength ranges and offer an intuitive tool for showing how certain key parameters influence the fit results.
One problem when analysing the influence of the retrieval wavelength range is that the true SCDs of trace gases are usually unknown for measured spectra. Therefore, as an ap-plication example, synthetic spectra are studied with known columns of trace gases. These synthetic spectra represent simplified spectra of passive DOAS measurements of strato-spheric BrO and BrO in volcanic plumes using scattered sun-light (see Sect. 3). Different tests are performed on these synthetic spectra as described in Sect. 3.3: (i) the influence of theI0effect, (ii) cross correlations between trace gas RCSs
and variations in assumed trace gas SCDs, and (iii) the be-haviour of retrieved results when noise is added to the syn-thetic spectra. The results for each measurement set-up and test are presented and discussed in Sect. 4, followed by a gen-eral comparison between measurement scenarios in Sect. 5 and concluding remarks in Sect. 6.
2 Retrieval wavelength mapping – general approach
Small errors in reference cross sections (RCSs) and correc-tions for broad-band extinction, unaccounted radiative trans-fer effects, cross correlations between RCSs and instrumen-tal defects may lead to erroneously retrieved slant column densities (SCDs) of measured trace gases. In general, these systematic errors exhibit a dependency on the retrieval length interval, which varies more slowly over broader wave-length intervals than errors introduced by common pixel to
278 L. Vogel et al.: DOAS retrieval interval mapping
Fig. 1.Wavelength interval mapping of a synthetic spectrum. Zenith-sky measurements of stratospheric BrO
(Tab. 2) are simulated with a true BrO SCD of1.5·1014moleccm−2. The retrieval applies I
0corrected RCSs.
The abscissa-axis shows the lower wavelength limit of the retrieval wavelength interval, the ordinate-axis the
upper wavelength limit. Deviations from the true BrO SCD are displayed on a logarithmic colour coded scale.
The circles mark selected retrieval wavelength intervals in the literature, which are referenced by the given
number in table 1. The highlighted wavelength interval denotes the optimal retrieval wavelength interval found
by Aliwell et al. (2002)
33
Fig. 1. Wavelength interval mapping of a synthetic spectrum. Zenith-sky measurements of stratospheric BrO (Table 2) are simu-lated with a true BrO SCD of 1.5×10¹⁴molec cm−2. The retrieval appliesI0-corrected RCSs. The abscissa axis shows the lower wave-length limit of the retrieval wavewave-length interval, the ordinate axis the upper wavelength limit. Deviations from the true BrO SCD are displayed on a logarithmic colour coded scale. The circles mark se-lected retrieval wavelength intervals in the literature, which are ref-erenced by the given number in Table 1. The highlighted wavelength interval denotes the optimal retrieval wavelength interval found by Aliwell et al. (2002).
pixel sensitivity differences and electronic or photonic noise. Therefore, these different types of error should be distin-guishable in a systematic study of the influence of retrieval wavelength intervals on the retrieved values.
A DOAS retrieval performed systematically over a wide range of different wavelength ranges may uncover these sys-tematic variations and allows one to study key parameters. This includes among others the retrieval wavelength interval dependency of the following:
– retrieved trace gas SCDs and their fit error;
– cross correlations between different RCSs;
– the influence of parameters like wavelength calibration of spectra;
– radiative transfer effects;
– the influence of instrumental features;
– shifts in wavelength calibration of recorded spectra;
– the dependency of the retrieved SCDs on theI0 effect and Ring effect (passive DOAS measurements only). By studying appropriate parameters, an optimal retrieval wavelength range may be found which results in a robust
retrieval of true trace gas slant columns. In this way, an op-timal homogenization of retrievals may be achieved, which is necessary, e.g. if larger data sets are recorded by different instruments.
Easy visualization of such systematic retrievals can be achieved by displaying the results in contour plots, where the first and second dimension are the lower and upper limits of the retrieval wavelength interval respectively. The plotted results are colour coded. Thus each point in the plot corre-sponds to one particular wavelength interval. The resulting maps allows one to readily identify retrieval wavelength in-tervals which are likely to lead to erroneous results, or might lead to a greater variability of the retrieved SCDs due to a large gradient of the retrieval interval dependency.
As an example of this novel method, Fig. 1 displays re-trieved BrO SCDs using a synthetic spectrum modelling zenith-sky DOAS measurements of stratospheric BrO. De-tails on the construction of the synthetic spectrum are given in Sect. 3. Since it is a synthetic spectrum, the true BrO SCD of 1.5×10¹⁴molec cm−2is known. All retrieval wavelength intervals are plotted with lower limits of 316–358 nm and up-per limits of 322–364 nm. The respective wavelength limits are varied in steps of 0.1 nm, with a total width of the in-tervalω between 6 nm and 45 nm. Retrieval results which differ by less than 0.1 % from the true SCD are plotted in white; under- and overestimated results in shades of blue and red respectively. The advantage of this systematic approach is apparent. In a first assessment, certain retrieval wavelength intervals can be disregarded since they yield results that devi-ate quite strongly from the true value, while others could be subject to further investigation. For instance, evaluation inter-vals including wavelengths below≈345 nm yield erroneous results. For an in-depth discussion of the depicted result, see Sect. 4.1.
The computational requirements to map the wavelength evaluation ranges are moderate. All individual maps shown were generated on a desktop PC with a 3.0 GHz process-ing unit. The retrievals necessary for a sprocess-ingle map were per-formed with the software package DOASIS (Doasis, 2010; Kraus, 2006; Lehmann, 2013) within 30 min for the given wavelength evaluation ranges at 0.1 nm steps. Therefore, this novel tool allows one to give a quick overview of possible pitfalls in DOAS evaluations. An example is provided in the Supplement, which consists of the necessary DOASIS script to perform the evaluations and Matlab/Octave scripts to visu-alize the results as well as spectra and fit scenarios described in Sects. 3.1 and 3.2 to perform Test I (Sect. 3.3.1).
3 Retrieval wavelength mapping for the example of
synthetic spectra
zenith-sky DOAS and BrO in tropospheric volcanic plumes. As mentioned above, synthetic spectra offer the advantage that retrieved and true SCDs can be compared. Both mea-surement scenarios assume passive DOAS meamea-surements us-ing scattered sunlight, allowus-ing one to study the two differ-ent measuremdiffer-ent conditions in direct comparison. In order not to exceed the scope of these examples, certain effects are neglected. The most important of these is the Ring effect (Grainger and Ring, 1962), which, if insufficiently corrected, may greatly affect the retrieval results due to its narrow-band structure. For a correct assessment of the Ring effect how-ever, an extensive study including advanced radiative transfer modelling and comparison with measured data would be nec-essary. Up to date, the tools are missing to calculate the Ring effect in a 3-dimensional atmosphere in order to perfectly simulate the effect when probing volcanic plumes. Further-more, retrieval wavelength ranges yielding highly erroneous SCDs without considering the Ring effect will not yield true SCDs when the effect is included. However, an attempt to assess the influence of the Ring effect is described in Ap-pendix B, in which results need to be treated with care due to the above described difficulties. The effects of noise are ne-glected for certain tests (I and II, see Sect. 3.3) performed on the two measurement scenarios. Given these simplifications, the results can be assumed to yield the lowest error possible and act as a “best-case” scenario. This poses certain limits on extending the results from the studied synthetic measurement scenarios to spectra measured in the field. The prime focus of this study is to present the new method of retrieval wave-length mapping rather than model real measurement spectra. The software package DOASIS was used for computation of all spectra and retrieval of results (Doasis, 2010; Kraus, 2006; Lehmann, 2013).
3.1 Generation of synthetic spectra
The same approach was taken for all measurement scenarios in constructing synthetic spectra as well as RCSs. Because this study focuses on measurements using scattered sunlight, a high-resolution solar spectrumIK,0(Kurucz, 2005) is used
as an initial spectrum without additional absorption struc-tures with a dispersion of ≈150/ 3×10⁵nm/pixels be-tween 300 and 450 nm. The literature absorption cross sec-tions of the different trace gases (σi(λ), see Table 2) were recorded at different spectral resolutions. Thus they were first interpolated toσK,i(λ) at the resolution of the initial solar spectrumIK,0. Subsequently, the RCSsσK,i(λ)were multi-plied by the respective SCDsSi assumed for each trace gas and measurement scenario. Their absorptions were applied to the solar spectrumIK,0according to the Lambert–Beer law: IK(λ)=IK,0(λ)exp −
X
i
σK,i(λ)·Si !
. (1)
The high-resolution spectra with (IK) and without
absorp-tions (IK,0) were convolved with an instrumental slit
func-tionWof Gaussian shape with 0.65 nm FWHM (full width at half maximum). A spectrometer with a detector of 1024 pix-els was assumed with a spectral range of 300 nm–402.3 nm with a constant dispersion of 0.1 nm/pixel. This allows one to disregard possible under-sampling effects (Roscoe et al., 1996; Platt et al., 1997; Chance et al., 2005), and the results can be transferred to spectrographs of similar optical resolu-tion and equal or higher dispersion. The calculated synthetic spectra are denotedI0andIM for Fraunhofer reference and
measurement, respectively. TheI0 spectrum constructed in
this way was used as a Fraunhofer reference spectrum in all evaluations.
When convolving the high-resolution RCSsσK,i(λ)to the resolution of the instrument, care must be taken to account for theI0effect (Platt et al., 1997), because the incident so-lar spectrum and the RCSs are highly structured. The convo-lution also introduces an error for absorbers at high optical densities (ln(I0/I ) >0.1). The reason for both effects is that the convolution and Lambert–Beer law do not commute (e.g. Wenig et al., 2005). In this study, RCSs are denoted as “un-corrected RCSs” if they are not “un-corrected for the I0 effect
or saturation effect. They are constructed by convolving the RCSs σK,i(λ) with the instrumental slit function W to the instrumental resolution.
RCSs corrected for theI0effect and saturation are
calcu-lated corresponding to (Platt et al., 1997; Aliwell et al., 2002; Wagner et al., 2002)
σi0(λ)= −1
Si ln
IK,0exp(−σiSi)∗W(λ)
IK,0∗W(λ)
!
(2) where∗denotes the convolution operation. However, using only the incident solar lightIK,0in the denominator of Eq. (2)
neglects the fact that many absorbers can be present at partly very high optical densities (e.g. O3in measurement scenario
for zenith-sky DOAS, Sect. 3.2.1). Thus a true correction of theI0effect can only be achieved if a spectrumIK0,0is used
in Eq. (2), which consists ofIK,0 modified by all other
ab-sorptions present except the one to be corrected. Although this can easily be achieved for synthetic spectra with known SCDs of absorbers, it would require a high computational ef-fort if applied to measured spectra, which is not feasible for common DOAS retrievals.
3.2 Measurement scenarios
3.2.1 Measurements of stratospheric BrO by zenith-sky
DOAS
In this scenario, spectra of ground-based zenith-sky DOAS measurements are simulated, which are used to measure stratospheric BrO. Commonly, spectra are recorded with a zenith looking telescope at high solar zenith angles (SZA). Evaluation of spectra at higher SZA against reference spec-tra at 70◦SZA yields information about stratospheric trace gases. The main problem for retrievals of stratospheric BrO
280 L. Vogel et al.: DOAS retrieval interval mapping
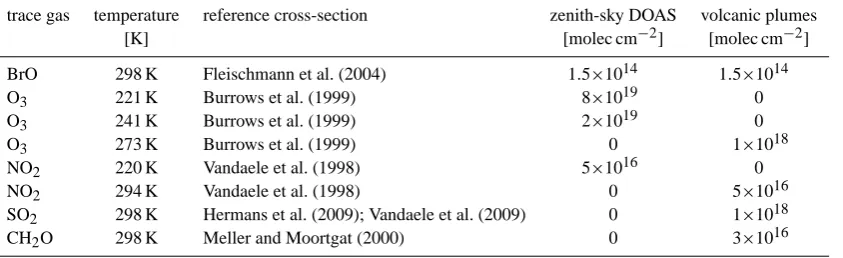
Table 2. SCDs used in the construction of synthetic spectra for the two different measurement scenarios. The zenith-sky DOAS scenario corresponds to the composition of slant column densities typical for zenith-sky DOAS measurements of stratospheric BrO at mid-latitudes. It reproduces the settings in Aliwell et al. (2002). The second scenario, volcanic plumes, applies typical SCDs of trace gases for MAX-DOAS measurements of BrO in tropospheric volcanic plumes.
trace gas temperature reference cross-section zenith-sky DOAS volcanic plumes [K] [molec cm−2] [molec cm−2]
BrO 298 K Fleischmann et al. (2004) 1.5×10¹⁴ 1.5×10¹⁴ O3 221 K Burrows et al. (1999) 8×10¹⁹ 0 O3 241 K Burrows et al. (1999) 2×10¹⁹ 0 O3 273 K Burrows et al. (1999) 0 1×10¹⁸ NO2 220 K Vandaele et al. (1998) 5×10¹⁶ 0 NO2 294 K Vandaele et al. (1998) 0 5×10¹⁶ SO2 298 K Hermans et al. (2009); Vandaele et al. (2009) 0 1×10¹⁸ CH2O 298 K Meller and Moortgat (2000) 0 3×10¹⁶
measurements is the strong O3 absorption structures
en-countered at lower wavelengths. The results can be trans-ferred to other measurement scenarios under similar condi-tions (e.g. stratospheric balloon measurements, satellite mea-surements in the limb-viewing direction). Information on the assumed RCSs and SCDs is given in Table 2. The as-sumed columns for the zenith-sky DOAS scenario are the same as the ones used in a previous study by Aliwell et al. (2002). However, instead of the BrO cross section by Wah-ner et al. (1988) at 223 K, the cross section by Fleischmann et al. (2004) at 298 K was used, because the latter is avail-able at higher resolution and the same BrO cross sections for both measurement scenarios can be used. Sensitivity tests have been performed for cross sections at different tempera-tures and by different authors (Wahner et al., 1988; Wilmouth et al., 1999; Fleischmann et al., 2004). Although the ampli-tude can differ significantly, the shape remains similar (see also Dorf, 2005). Since the BrO’s optical density is small compared to the other absorbers, it can be assumed that the relative changes in retrieved SCDs are independent of the respective BrO RCSs used for all tests performed. This ap-proach is also justified by the negligible differences in re-trieved SCDs that can be seen in the results presented later between this study and Aliwell et al. (2002), Sect. 4.1.1.
3.2.2 BrO in tropospheric volcanic plumes
This scenario is set up to model tropospheric measurements of a volcanic plume at low-elevation viewing angles. The Fraunhofer reference spectrum would be recorded in zenith view, and it is assumed to be taken in close proximity in time with measurements of the volcanic plume and thus at approx-imately the same SZA. Consequently, the measurement will be sensitive to trace gases in the volcanic plume as well as to absorbers in the the lower ambient atmosphere. Stratospheric absorptions should be the same in both measurement and ref-erence spectrum and cancel in the retrieval. Thus they are neglected in this scenario. Tropospheric SCDs of NO2, O3
and HCHO correspond to a slightly polluted troposphere, as found at Mt. Etna, Italy, during the summer months (Hui-jnen et al., 2010; Curci et al., 2010; Heckel et al., 2005). BrO and SO2SCDs are typical for a diluted plume, which
is several minutes old at the point of the measurement (Bo-browski and Platt, 2007; von Glasow, 2010). Advanced mod-elled measurement scenarios are described in Vogel (2011).
These measurement conditions are quite different to those of zenith-sky DOAS. Since stratospheric O3 absorptions
are neglected, assumed SCDs of tropospheric O3 are much
smaller. However, the volcanic plume includes SO2at high
concentrations, which absorbs in a similar wavelength range as O3. Possible cross correlation of BrO with ambient HCHO
must also be taken into account due to the similar shape of absorption structures and optical density encountered.
3.3 Tests performed on synthetic spectra
Several tests were performed on the two measurement sce-narios. In order to allow for a better comparison between the different tests, only two different retrievals are used. A set of (1) uncorrected RCSs and (2)I0-corrected RCSs for
each scenario is applied. The different tests vary by small changes to the synthetic measurement spectra (variations of the SCDs of absorbers, added noise, etc.). Otherwise, all re-trievals are performed coherently. In both evaluation scenar-ios, the logarithm of the Fraunhofer reference spectrum I0
of second order was included. This is sufficient since no ad-ditional broad-band extinctions are applied during the con-struction of synthetic spectra. If the presented tool is applied to field measurements however, the effect on the retrieval re-sults by different degrees of DOAS polynomials should be studied.
3.3.1 Test I: influence of theI0effect
As a first test, the influence of the I0 effect on retrieved column densities was assessed by fitting both sets of RCSs (uncorrected and corrected for theI0effect) to the synthetic
measurement spectrum. In this way, the upper limit of accu-racy is established with which the different SCDs of respec-tive measurement scenarios can be reproduced. This test also allows direct comparison to the study of Aliwell et al. (2002) for the zenith-sky DOAS measurement set-up.
As mentioned in Sect. 3.1, a trueI0correction can only be achieved if the denominatorIK,0in Eq. (2) includes
absorp-tions of all trace gases except the one whose cross section is to be corrected. This was tested for both synthetic mea-surement spectra, and correct SCDs could be retrieved for all trace gases at all retrieval wavelength range.
The necessary files to perform Test I for both measurement scenarios (see Sect. 3.2) are provided in the Supplement. 3.3.2 Test II: cross correlations of other absorbers with
retrieved BrO SCD
Beyond studying the behaviour of retrieved trace gas SCDs with changing evaluation wavelength intervals, many other properties of a fit can be investigated (e.g. see Sect. 2). Test II is designed to yield information on the sensitivity of the re-trieval to small variations in the amount of absorbers present. Cross correlations between the differential absorption cross sections of the different absorbers may affect the retrieved SCDs. Since the RCSs are wavelength dependent, these cross correlations depend on the retrieval wavelength range.
A series of fits were used to assess these cross correlations. The original sets ofI0-corrected RCSs were fit to synthetic spectra, which were constructed with varying strengths of ab-sorbers. Dependencies of the retrieved BrO SCDs on other absorber strengths can be expressed as
δSBrO δSA =
SBrO,A+−S
BrO,A-21SA ·
S
BrO,0 SA,0
−1
. (3)
The derivativeδSBrO to variations in columns of absorber
“A” (δSA) is calculated from BrO SCDsSBrO,A+andSBrO,A-,
which are retrieved when changing the original SCDs of ab-sorber ASA,0by±1SA, respectively.SA,0andSBrO,0are the
SCDs as given in Table 2. The sensitivity of the BrO SCD at a certain retrieval wavelength range relative to changes in SCDs of all other absorbers is estimated by
dSBrO
dSAll
= 1
nA
X
A δSBrO
δSA
(4)
where nA denotes the total number of different absorbers excluding BrO.
An additional error is introduced by varying the absorbers while constructing the synthetic measurement spectrum without changing theI0 correction of RCSs in the
respec-tive fit scenario. Thus the dependencies revealed are result-ing from (1) cross correlations between different RCSs and (2) wrongly assumed trace gas SCDs when correcting for the
I0effect of the respective trace gas.
The variations of the trace gases were set to 1 % for the measurement scenarios assessing stratospheric BrO by zenith-sky DOAS and 10 % for the measurement scenarios of BrO in volcanic plumes (see also Table 2). These choices are motivated by the different measurement conditions:
For the zenith-sky DOAS, changes in the measured trace gas SCDs are mainly induced by changes in SZA. The 1 % changes for the zenith DOAS scenario have been chosen, be-cause they represent the mean deviation from the true O3
SCDs observed in Aliwell et al. (2002), scenario B2 and C2 (see p. 4, Table 3), which correspond to the retrieval approach chosen in this publication. In case of the volcanic plume sce-nario, the motivation of 10 % deviations of true trace gas SCDs is that rapid changes of observed trace gas SCDs may occur due to changes in volcanic emission strength, which may well exceed 10 %. If aerosols or ash are present in the plume, also trace gas SCDs of the ambient atmosphere may vary due to different optical light paths observed.
Different trace gas SCDs may vary on a different scale, but for the sake of simplicity the same deviations were chosen for all trace gases in the respective measurement scenarios. For real measurement spectra, additional residual structures and noise may increase these cross correlations. Thus this test will only yield a “best-case” result.
3.3.3 Test III: effect of noise on retrieval and error calculation
In order to render the theoretical study more realistic, tests were performed on the synthetic spectra with added noise. Typical residual structures are simulated by adding Gaus-sian noise to the logarithm of the measurement spectra. The standard deviation of the noise structure was normalized to an optical density of 3×10⁻⁴. Additional broad-band fea-tures were introduced by binomial low-pass filtering (e.g. J¨ahne, 2005) of the noise with 0, 10 and 50 iterations with subsequent rescaling (see Fig. 2). Iterations of 10 and 50 correspond to a filtering using a running mean of 6 and 15 pixels, similar to the error calculation study by Stutz and Platt (1996). A correction factor is defined in the study which is the ratio of standard deviation of results and the mean fit error. For one BrO absorption band with an average FWHM of 1.5 nm (15 pixels), the correction factor is≈1.5 for unfil-tered noise,≈2.5–3 for noise filtered with 10 iterations and ≈4.5 for 50 iterations respectively.
282 L. Vogel et al.: DOAS retrieval interval mapping
Fig. 2. Examples of different Gaussian noise spectra added to the logarithm of the synthetic spectrum. The
broad band structures are introduced by a low pass filter using a binomial filter of 0 (top trace), 10 (center trace)
and 50 (bottom trace) iterations respectively. After low pass filtering, the noises were rescaled to the original
standard deviation with an amplitude of3·10−4
.
Fig. 3. Results from a retrieval wavelength mapping of a synthetic spectrum for the measurement scenario
zenith-sky DOAS with a true BrO SCD of1.5·1014
moleccm−2. The plot shows a retrieval map constructed
with the uncorrected RCSs used in the retrieval. Note that the color-code is on a logarithmic scale. Compared
to the retrieval applying corrected RCSs (Fig. 1), highly erroneous SCDs are retrieved. The numbers denote
certain wavelength intervals shown in Tab. 1.
34
Fig. 2. Examples of different Gaussian noise spectra added to the logarithm of the synthetic spectrum. The broad-band structures are introduced by a low-pass filter using a binomial filter of 0 (top trace), 10 (center trace) and 50 (bottom trace) iterations respec-tively. After low-pass filtering, the noises were rescaled to the orig-inal standard deviation with an amplitude of 3×10⁻⁴.
The influence of noise on retrievals withI0-corrected and uncorrected RCSs was tested for the case of unfiltered noise. Broader residual structures are studied only forI0-corrected
RCSs. In order to get reasonable statistics with indepen-dent retrieval results for each wavelength retrieval range, 100 maps with independent noise for each wavelength range are averaged to yield the presented retrieval maps.
4 Results and discussion of the individual measurement
scenarios
Results of the different tests are presented in the following section, which were performed on the measurement scenar-ios of zenith-sky DOAS (see Sect. 4.1) and DOAS measure-ments of volcanic plumes (see Sect. 4.2).
4.1 Zenith-sky DOAS
4.1.1 Test I: influence of theI0effect on zenith-sky
DOAS
Figures 1 and 3 depict the deviation from the true BrO SCD of 1.5×10¹⁴molec cm−2 for I0-corrected and uncorrected
RCSs used in the retrieval, respectively. In the case of I0 -corrected RCSs (see Fig. 1), retrieved BrO SCDs vary by more than 10 % at most retrieval ranges including wave-lengths below 330 nm. If fits are only performed at longer wavelengths, deviations of less than 1 % are achieved for lower limits>345 nm. Note that no additional residual struc-tures or noise has been added in this test, and therefore the results can be regarded as a lower limit of accuracy.
Fig. 2. Examples of different Gaussian noise spectra added to the logarithm of the synthetic spectrum. The
broad band structures are introduced by a low pass filter using a binomial filter of 0 (top trace), 10 (center trace)
and 50 (bottom trace) iterations respectively. After low pass filtering, the noises were rescaled to the original
standard deviation with an amplitude of3·10−4 .
Fig. 3. Results from a retrieval wavelength mapping of a synthetic spectrum for the measurement scenario
zenith-sky DOAS with a true BrO SCD of1.5·1014
moleccm−2
. The plot shows a retrieval map constructed
with the uncorrected RCSs used in the retrieval. Note that the color-code is on a logarithmic scale. Compared
to the retrieval applying corrected RCSs (Fig. 1), highly erroneous SCDs are retrieved. The numbers denote
certain wavelength intervals shown in Tab. 1.
34
Fig. 3. Results from a retrieval wavelength mapping of a synthetic spectrum for the measurement scenario zenith-sky DOAS with a true BrO SCD of 1.5×10¹⁴molec cm−2. The plot shows a retrieval map constructed with the uncorrected RCSs used in the retrieval. Note that the colour code is on a logarithmic scale. Compared to the retrieval applying corrected RCSs (Fig. 1), highly erroneous SCDs are retrieved. The numbers denote certain wavelength inter-vals shown in Table 1.
If uncorrected RCSs are applied in the fitting algo-rithm (Fig. 3), the retrieval of the true BrO SCD is not unambiguously possible. Highly erroneous results by more than 100 % are to be expected for retrieval wavelength intervals including wavelengths below ≈340 nm. Even at longer wavelengths, most wavelength intervals yield SCDs deviating by more than 20 % from the true BrO SCD.
For both sets of RCSs, one of the major features visi-ble in the retrieval maps is that the results depend mostly on the lower wavelength limit. This indicates the influ-ence of the strong O3 absorptions, because their absorption
structures decrease with increasing wavelength. Prefer-ences to under- or overestimate the true BrO SCD change with the BrO absorption maxima included in the retrieval wavelength interval.
Figure 4 depicts retrieval results and residuals at three dif-ferent wavelength ranges for uncorrected and I0-corrected RCSs. The evaluation wavelength intervals chosen corre-spond to the ones marked by #12 (319–347.5 nm), #5 (332– 352 nm) and #10 (346–359 nm) in Table 1, Figs. 1 and 3. Greater residual structures occurring for the retrieval be-tween 319 nm and 347.5 nm confirm that retrievals at lower wavelength ranges and the use of uncorrected RCSs must be avoided if higher O3absorptions are present in the
Fig. 4.Shown above are fit results of the measurement scenario zenith-sky DOAS for three different wavelength
intervals, corresponding to #12, #5 and #10 in Tab. 1. The fit of the BrO RCS and the residuum are displayed.
Left column: uncorrected RCSs; right column: I0corrected RCSs. Regardless of which RCSs are used, a fit
applying the longest wavelengths (346-359 nm) yields the most accurate results. At 346-359 nm, tests C1 and
C2 on synthetic spectra in Aliwell et al. (2002) are reproduced.
35
Fig. 4. Shown above are fit results of the measurement scenario zenith-sky DOAS for three different wavelength intervals, corresponding to #12, #5 and #10 in Table 1. The fit of the BrO RCS and the residuum are displayed. Left column: uncorrected RCSs; right column:I0 -corrected RCSs. Regardless of which RCSs are used, a fit applying the longest wavelengths (346–359 nm) yields the most accurate results. At 346–359 nm, tests C1 and C2 on synthetic spectra in Aliwell et al. (2002) are reproduced.
the fitting process. The residual structures of the retrieval us-ing uncorrected RCSs at 346–359 nm reproduce the results of tests C1 and C2 described in Aliwell et al. (2002), both in retrieved BrO SCDs and shapes of the residual.
4.1.2 Test II: cross correlations of other absorbers for zenith-sky DOAS
In this test, the dependencies of the retrieved column den-sity of the trace gas of interest (i.e. BrO) on changes in other
284 L. Vogel et al.: DOAS retrieval interval mapping
Fig. 5. Cross correlation study for the zenith-sky DOAS scenario. Changes in BrO SCDs if potentially cross
correlating absorbers are varied by 1%. The color-code depicts relative changes of the retrieved BrO SCD per
relative change of absorber. At shorter wavelengths, the strongO3absorptions are clearly dominating (upper
row), whereas the influence ofNO2is negligible in comparison (lower left). The average of all relative changes
is depicted in the lower right graph.
36
Fig. 5. Cross correlation study for the zenith-sky DOAS scenario. Changes in BrO SCDs if potentially cross correlating absorbers are varied by 1 %. The colour code depicts relative changes of the retrieved BrO SCD per relative change of absorber. At shorter wavelengths, the strong O3absorptions are clearly dominating (upper row), whereas the influence of NO2is negligible in comparison (lower left). The average of all relative changes is depicted in the lower right graph.
absorber strengths were investigated. Figure 5 depicts the rel-ative change in retrieved BrO SCD when varying the strength of the other absorbers in the synthetic measurement spec-trum by 1 %. If any of the O3 RCSs are varied by 1 %, a
relative change of BrO of more than 10 % occurs for wave-length ranges with a lower limit between 316–330 nm. Even above a lower wavelength interval limit of 330 nm, changes of BrO SCDs greater than 10 % are present for O3at 221 K,
the stronger of the two O3 RCSs used. Relative changes of
BrO SCD due to O3at 241 K remain mostly below 5 % above
a lower limit of ≈335 nm and become negligible above 345 nm. Therefore, the variations of SCDs for the zenith-sky DOAS scenario show a clear imprint of the strong O3
absorp-tions. They generally lead to an overestimation of BrO SCDs if wavelengths<330 nm are included in the retrieval. The strong O3absorptions also affect the retrieved BrO SCDs at
longer wavelengths, although not as severely.
Compared to O3, the influence of varying the NO2SCD
is only minor and can be disregarded when evaluating at intervals starting above a lower limit of 345 nm. However, the depicted dependency of NO2 at the shorter wavelength
end of the evaluation range is surprising. Other than O3,
the differential optical absorption bands of NO2increase in
strength towards longer wavelengths. Thus, a dependency on the upper wavelength end of the evaluation retrieval would be expected (see also Sect. 5.2).
4.1.3 Test III: effect of noise on retrieval and error calculation for zenith-sky DOAS
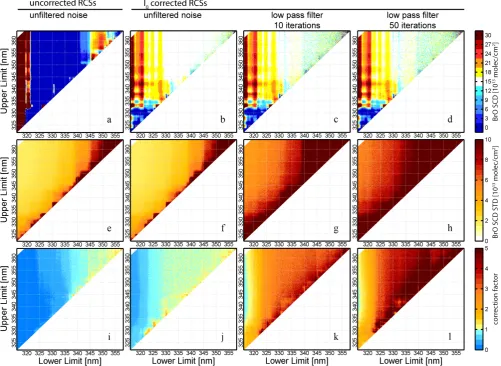
Fig. 6.
Results from the statistical study on the zenith-sky DOAS measurement scenario. For information on
the noises applied to the synthetic spectra, the reader is referred to Sec. 3.3.3. The first column shows results
for an uncorrected set of RCSs together with unfiltered noise. The second till fourth column depict results for I
0corrected RCSs and different filtered noises. The rows (upper to lower) correspond to retrieved SCDs, standard
deviation of results, and calculated correction factors defined as the standard deviation divided by the fit error
(top to bottom row, respectively).
37
Fig. 6. Results from the statistical study on the zenith-sky DOAS measurement scenario. For information on the noises applied to the synthetic spectra, the reader should refer to Sect. 3.3.3. The first column shows results for an uncorrected set of RCSs together with unfiltered noise. The second till fourth column depict results forI0-corrected RCSs and different filtered noises. The rows (upper to lower) correspond to retrieved SCDs, standard deviation of results, and calculated correction factors defined as the standard deviation divided by the fit error (top to bottom row, respectively).
structure. The same is true for an overestimation of SCDs between lower limits of 334–338 nm. This indicates that un-derlying systematic errors are not concealed by noise but ac-tually become more pronounced. The reason for this is yet unclear.
The standard deviation shows a clear change at≈338 nm, 345 nm and 350 nm of lower limit of the retrieval interval for all cases studied (different noise types, uncorrected andI0
-corrected RCS). These changes correspond to the maxima of different BrO absorption bands included in the fitting pro-cess. Comparing standard deviations of uncorrected andI0
-corrected RCS, no major difference can be observed. There-fore, the unstructured noise does not obviously influence the distribution of retrieved SCDs even if systematic structures are present. Nevertheless, the systematic structures influence the fit error greatly. This can be observed in Fig. 6 by looking
at the correction factor, the ratio between standard deviation and fit error (see Sect. 3.3). For unfiltered noise, a correction factor below 1 is calculated for evaluations of lower limit
<330 nm forI0-corrected RCS, and even a factor below 1 for all evaluations of lower limit<345 nm for uncorrected RCS. A possible reason for this behaviour is discussed in Sect. 5.
4.2 BrO in volcanic plumes
4.2.1 Test I: influence of theI0effect on retrievals of
BrO in volcanic plumes
Figure 7 shows the results for the measurement scenario of BrO in volcanic plumes for a retrieval using I0-corrected
RCSs. It is apparent that theI0-corrected retrieval yields
re-sults with only minor deviations from the true BrO SCD at
286 L. Vogel et al.: DOAS retrieval interval mapping
Fig. 7.Deviations from the true BrO SCD (1.5·1014moleccm−2) for the measurement scenario of BrO in
volcanic plumes using I0corrected RCS. The retrievals only show minor structures if lower wavelengths are
included in the fit. The numbers indicate the different retrieval ranges in Tab. 1.
38
Fig. 7. Deviations from the true BrO SCD (1.5×10¹⁴molec cm−2) for the measurement scenario of BrO in volcanic plumes usingI0 -corrected RCS. The retrievals only show minor structures if lower wavelengths are included in the fit. The numbers indicate the differ-ent retrieval ranges in Table 1.
most evaluation wavelength intervals. The deviations range up to 1 % only if the fit is performed with a retrieval inter-val including wavelengths below≈323 nm. These features may be attributed to the stronger SO2 and O3 absorptions
at shorter wavelengths. Also residual structures shown for three different evaluation wavelength ranges are negligible (Fig. 9).
If uncorrected RCSs are used, the retrieved BrO SCDs show larger deviations from the true BrO SCD (Fig. 8), how-ever far less than observed in the scenario for zenith-sky DOAS (Fig. 3). In general, a systemic overestimation of BrO SCDs is apparent if lower wavelength limits below 319 nm and above 332.5 nm are included in the retrieval; otherwise, BrO SCDs are slightly underestimated. Deviations from the true BrO SCD range of more than 10 % are only observed at lower limits>347.5 nm and in the range of lower lim-its>332.5 nm,<340 nm, upper limits<345 nm for upper limits<330 nm.
Assigning deviations at a specific retrieval wavelength range to a certain trace gas is difficult since possible cross correlations may occur between all trace gases. Also, changes in retrieved SCDs of absorbers do not directly trans-late into the same changes in the respective optical density of the differential optical absorption structure due to the wave-length dependency of the RCSs. As an example, optical den-sities are given in Table 3 for different trace gases at three different wavelengths. An attempt to assign different wave-length intervals to the different absorbers that interfere the most with the BrO retrieval at respective wavelength ranges is presented in Appendix A. It indicates that the observed
de-Fig. 8.Deviations from the true BrO SCDs in the measurement scenario of volcanic plumes applying
uncor-rected RCSs in the retrieval. Over- or underestimation of the target BrO SCD of1.5·1014moleccm−2is higher
compared to I0corrected RCS (Fig. 7). Retrievals at longer wavelength ranges (>345nm) systematically
over-estimate the BrO SCD. The index numbers denote selected wavelength intervals from Tab. 1.
39
Fig. 8. Deviations from the true BrO SCDs in the measurement scenario of volcanic plumes applying uncorrected RCSs in the re-trieval. Over- or underestimation of the target BrO SCD of 1.5×
1014molec cm−2is higher compared toI0-corrected RCS (Fig. 7). Retrievals at longer wavelength ranges (>345 nm) systematically overestimate the BrO SCD. The index numbers denote selected wavelength intervals from Table 1.
viations from the true BrO SCD in Fig. 8 may be caused by cross correlations between the RCSs of BrO and HCHO.
Figure 9 displays fit examples for uncorrected and I0 -corrected RCSs. As expected from the previously shown Figs. 7 and 8, only small residual structures and deviations from the true BrO SCD are observed. For the retrievals ap-plyingI0-corrected RCSs, all three different retrieval wave-length ranges yield negligible residual structures. In contrast to the fit examples of the zenith-sky DOAS scenario (Fig. 4), the retrieval wavelength interval between 332 nm and 352 nm is most accurate and the wavelength interval of 346–359 nm shows the largest deviation from the true BrO SCD.
4.2.2 Test II: cross correlations of other absorbers when evaluating BrO in volcanic plumes
As described in the previous paragraph,I0-corrected RCSs yield accurate results with only slight deviations from the true BrO SCD when lower wavelengths are included (<
325 nm, Fig. 7). These results are also confirmed when vary-ing the strengths of other absorbers in the case of the sce-nario for volcanic plumes. The influence of changes in other absorber strength on the retrieved BrO columns is visible for
I0-corrected RCSs in Fig. 10. The increased absorptions of
O3 and SO2 below 325 nm lead to a small overestimation
of BrO SCDs if these wavelengths are included in the re-trieval wavelength interval. In the case of NO2, almost all
Fig. 9.Fit examples for selected wavelength intervals (#12, #5, #10 in Tab. 1) for the measurement scenario of
BrO in volcanic plumes: All wavelength intervals yield results with negligible residual structures applying I0
corrected RCSs. For fits applying uncorrected RCSs, the largest deviation is seen for the interval of 346-359 nm
(#10) in contrast to the scenario of zenith-sky DOAS (Fig. 4). Note that the optical density for the fit residual
is given in units of10−6for I0corrected RCSs and in units of10−3for uncorrected RCSs.
40
Fig. 9. Fit examples for selected wavelength intervals (#12, #5, #10 in Table 1) for the measurement scenario of BrO in volcanic plumes: all wavelength intervals yield results with negligible residual structures applyingI0-corrected RCSs. For fits applying uncorrected RCSs, the largest deviation is seen for the interval of 346–359 nm (#10) in contrast to the scenario of zenith-sky DOAS (Fig. 4). Note that the optical density for the fit residual is given in units of 10−6forI0-corrected RCSs and in units of 10−3for uncorrected RCSs.
show clearly overlapping absorption bands with BrO. Nev-ertheless, NO2 interacts unfavourably with BrO due to its
comparably high optical density (Table 3). BrO shows the least dependency on changes in absorber strength to HCHO. Cross correlations are mainly observed at shorter wavelength
limits between 335–340 nm and above 345 nm. This may be attributed to absorption bands of similar shape for both trace gases at≈338 nm.
The average of all dependencies in Fig. 10 is shown in Fig. 11. BrO SCDs obtained in retrieval wavelength intervals
288 L. Vogel et al.: DOAS retrieval interval mapping
Fig. 10.The plots depict the influence of varying absorber strength on the retrieval of BrO in volcanic plumes.
Retrieval wavelength maps are constructed using absorber strengths varied by 10%. The original I0corrected
set of RCSs was used. Greatest deviations from the true BrO SCD occur where strong absorption features
ofSO2orO3are included (e.g. at evaluation ranges including wavelengths≤323nm). While these effects
correlated to the BrO SCDs,NO2andHCHOmostly anti-correlate with BrO, of which the first shows greater
influence.
41
Fig. 10. The plots depict the influence of varying absorber strength on the retrieval of BrO in volcanic plumes. Retrieval wavelength maps are constructed using absorber strengths varied by 10 %. The originalI0-corrected set of RCSs was used. Greatest deviations from the true BrO SCD occur where strong absorption features of SO2or O3are included (e.g. at evaluation ranges including wavelengths≤323 nm). While these effects correlated to the BrO SCDs, NO2and HCHO mostly anti-correlate with BrO, of which the first shows greater influence.
Table 3. Differential optical densities of trace gases at SCDs applied in the measurement scenarios of BrO in volcanic plumes. The differential optical densities are calculated by taking the peak to peak value of a high-pass filtered absorption cross section multiplied by the respective SCD in a 5-nm wavelength interval. The 325-nm and 350-nm wavelengths were chosen to indicate approximate optical densities in the lower and higher wavelength ranges. The strongest absorption band of BrO is situated at≈338 nm.
Center of wavelength interval BrO SO2 O3 NO2 HCHO
[nm] optical densityh10−3i
325 0.7 6.2 5.0 0.7 1.0 338 1.2 0.1 1.2 2.0 0.7 350 0.3 0.1 0.1 3.5 0.2
with a lower limit<325 nm are dominated by O3and SO2,
whereas results at other wavelength intervals may be influ-enced mainly by NO2 and HCHO. The area least affected
by varying absorber strengths is observed between the lower limits of 326 nm and 333 nm. However, cross correlations in total remain negligible as long as the stronger differential absorption structures of SO2and O3are avoided.
4.2.3 Test III: the effect of noise on retrieval and error calculation for BrO in volcanic plumes
The effects of different noise spectra on the retrieval of BrO in volcanic plumes are depicted in Fig. 12. As al-ready observed for the scenario of zenith-sky DOAS (Sect. 4.1.3), BrO SCDs are comparable to evaluations without noise (see Figs. 7, 8). Possible minor deviations from the true BrO SCDs for evaluations applyingI0-corrected RCSs
Fig. 11.The figure depicts the average of cross correlations of other trace gases with the BrO retrieval (Fig. 7).
Wavelength evaluation ranges with a lower limit<325 are dominated byO3andSO2features, where as the
other wavelength ranges may be influenced mainly byNO2andHCHO.
42
Fig. 11. The figure depicts the average of cross correlations of other trace gases with the BrO retrieval (Fig. 7). Wavelength evaluation ranges with a lower limit<325 are dominated by O3 and SO2 features, whereas the other wavelength ranges may be influenced mainly by NO2and HCHO.
RCSs (Fig. 12e, f), no differences can be distinguished, al-though results for both types of evaluations differ (Fig. 12a, b). Therefore, the unfiltered noise leads to comparable stan-dard deviation of retrieved BrO SCDs, but absolute results are dominated by the underlying systematic residuals. In the case of theI0-corrected RCSs, the average SCDs remain the
same, independent of the different filtered noise spectra. A general increase in standard deviation is visible with an in-crease in structure of the noise spectra (i.e. stronger low-pass filtering). For all types of noise spectra, a sudden increase in standard deviation occurs at shorter retrieval wavelength lim-its of 338 nm and 345 nm, corresponding to the maxima and decrease in amplitude of the differential optical absorption bands of BrO included in the fit.
The calculated correction factor shows a clear transition at a lower limit of 320 nm for uncorrected RCSs, changing from below unity to an average value of 1 for all other retrieval wavelength intervals. ForI0-corrected RCSs, the correction
factor only shows a small wavelength dependence. For un-filtered noise, standard deviation and measurement error do not differ significantly. For low-pass filtered noise, correc-tion factors of ≈3 and ≈4.5 (10 and 50 iterations of the binomial filter, respectively) need to be applied to calculate the true standard deviation from the fit error.
5 Comparison of results from both measurement
scenarios
The three tests for both measurement scenarios yield sev-eral common features. Even if gensev-eralisations are difficult
without a thorough mathematical description, these find-ings offer empirical insights and reveal common pitfalls in DOAS evaluations.
5.1 I0-corrected and uncorrected reference cross
sections
Although the two measurement scenarios incorporate ab-sorptions of differing strengths, retrieved SCDs showed that anI0correction should always be applied. This is especially
true if very strong absorbers conceal the trace gas of interest (e.g. O3 concealing BrO in the scenario zenith-sky DOAS
scenario). Even in this best-case study, an insufficient cor-rection of theI0effect yielded deviations of the BrO SCDs at lower wavelengths with high O3 absorptions. In the case
of the scenario of BrO in volcanic plumes, the combined SO2 and O3 differential absorptions are still about two
or-ders of magnitude smaller than the combined O3differential
absorptions in the zenith-sky DOAS scenario at wavelengths ≥320 nm. Therefore, deviations of the retrieved BrO SCDs are much smaller than for the zenith-sky DOAS scenario. Nevertheless,I0correction of the RCSs remains mandatory
to achieve correct results.
The observed deviations when using I0-corrected RCSs
can be attributed to a slightly erroneous correction of theI0
effect since the denominator in the correction (Eq. 2) con-sists only of the incident solar light without the presence of other absorbers. Sensitivity tests were performed with true
I0-corrected RCSs as outlined in Sect. (3.1). Using these sets of RCSs, true SCDs of all trace gases could be retrieved at all wavelength intervals for both measurement scenarios. 5.2 Sensitivity to cross correlating absorbers
In both measurement scenarios, variations in the strengths of other absorbers affected the BrO retrieval. These errors in the retrieved BrO SCDs are due to a combination of cross corre-lations between the different absorbers and anI0correction
of RCSs with slightly erroneous SCDs. The observed depen-dencies are up to two magnitudes greater for the zenith-sky DOAS scenario than for the measurement scenario of vol-canic plumes. Since the contributions of cross correlations andI0correction have not been separated, it is not possible to assign observed dependencies clearly. However, the ob-served correlations are in general quite small. Since (1) the synthetic spectra in this test are constructed without noise or other wavelength-dependent residual structures and (2) the retrieval wavelength ranges studied are sufficiently large at
>60 channels of the simulated detector, a precise retrieval of all absorbers should be possible. The only sources of error re-maining are malicious spectral features induced by the insuf-ficientI0correction of RCSs. This hypothesis is strengthened
by the observations for the zenith-DOAS measurement sce-nario (Fig. 5). The similarities of the structures observed for variations of O3and NO2SCDs indicate that the structures
290 L. Vogel et al.: DOAS retrieval interval mapping
Fig. 12.
The graph depicts results of the the statistical study for the scenario of measuring BrO in volcanic
plumes. Different types of noise spectra were added to the logarithm of the synthetic spectra (see Sec. 3.3.3).
The first column shows results for unfiltered noise and an uncorrected set of RCSs applied in the fit. In the
second, third and fourth column, results are plotted for I
0corrected RCSs applied to synthetic spectra with
unfiltered noise and low pass filtered noise. The mean BrO SCDs retrieved are shown in the top row, the middle
row depicts the standard deviation of SCDs and the bottom row the calculated error correction coefficient.
Fig. 12. The graph depicts results of the the statistical study for the scenario of measuring BrO in volcanic plumes. Different types of noise spectra were added to the logarithm of the synthetic spectra (see Sect. 3.3.3). The first column shows results for unfiltered noise and an uncorrected set of RCSs applied in the fit. In the second, third and fourth column, results are plotted forI0-corrected RCSs applied to synthetic spectra with unfiltered noise and low-pass filtered noise. The mean BrO SCDs retrieved are shown in the top row; the middle row depicts the standard deviation of SCDs and the bottom row the calculated error correction coefficient.
observed in the NO2plot may originate from the insufficient
correction of theI0effect of the O3RCSs.
Thus for the case of measured spectra, it can be spec-ulated that retrieval wavelength interval-dependent correla-tions between trace gases originate from systematic residual structures. One such example is the anti-correlation be-tween BrO and HCHO observed in measurements of vol-canic plumes (Vogel, 2011), which occur despite the neg-ligible correlations described in Sect. 4.2.2 and only minor anti-correlations found in Appendix A. For field measure-ments of volcanic plumes, systematic spectral structures are likely induced by wavelength-dependent radiative transfer effects, which are not fully considered in a standard DOAS retrieval.
5.3 Influence of noise on the retrieval
In Sects. 4.1.3 and 4.2.3, the influence of noise on the DOAS retrieval was tested. For both scenarios, SCDs obtained from synthetic spectra without additional noise were comparable to the mean of retrieved SCDs of spectra with noise. These findings also remained true in general when noise spectra were calculated with additional, random broad-band struc-tures. However, the deviations from the true BrO SCD were slightly increased with increasing broad-band structures of the noise in the case of the zenith-sky DOAS scenario for reasons yet unclear.
The relationship between standard deviation of retrieved SCDs, fit error and the correction factor used to calculate one from the other has been described in Stutz and Platt (1996).
They found that the true standard deviation of retrieved SCDs is always larger than the fit error. However, the authors as-sumed that no systematic residual structures were present. The results presented in Sects. 4.1.3 and 4.2.3 reveal several interesting features. (1) Comparing results from retrievals ap-plying uncorrected andI0-corrected RCSs, it can be seen that
the standard deviation of the retrieved SCDs does not appear to depend on systematic wavelength structures due to theI0
effect. (2) However, the increase of the fit error by these sys-tematic structures may lead to a correction factor<1. There-fore, the application of a correction factor may lead to over-estimation of the true standard deviation.
The observed effects are not pronounced when system-atic residual structures are small, and thus the boundary conditions of the previous study are fulfilled. In that case, the correction factor calculated for the BrO retrieval corre-sponds to the previously published approach. It is only de-pendent on the width of the differential absorption structure and width of the residual features, here≈1.5 for unfiltered noise,≈2.5–3 for noise filtered with 10 iterations and≈4.5 for 50 iterations.
To perform an extensive error analysis on a theoretical basis is beyond the scope of this work. However, based on the empirical studies performed here, we conclude that cor-rection factors calculated assuming only random structures should also be applied if systematic residual structures are present. This approach may lead to an overestimation of the standard deviation of results, but the systematic spectral structures will also lead to a systematic offset of the average retrieved columns.
5.4 Recommended retrieval wavelength intervals
For zenith-sky DOAS, the tests confirmed the evaluation wavelength range 346–359 nm as suggested by Aliwell et al. (2002) due to greater stability of retrieved SCDs in mea-sured spectra in comparison to 345–359 nm. If one compares this explanation with Fig. 1, it may be speculated that the observations may have been induced by shifts in the wave-length to pixel mapping of the spectrograph. The retrieval wavelength maps show a strong gradient for the 345–359 nm range, which is not present for 346–359 nm. At this known example, the novel tool confirms that this retrieval wave-length interval of BrO offers at least the dependency on the
I0effect, although anI0correction of RCSs is still manda-tory. BrO retrievals including lower wavelengths are not ad-vised since strong O3absorption and slightly insufficientI0
correction of RCSs may yield highly erroneous columns even in this “best-case” scenario.
BrO retrievals for measurement of volcanic plumes show a much lowerI0 dependency of the BrO SCDs on the
re-trieval wavelength interval, mostly due to a total O3 SCD
that is about 100 times weaker. Whereas the fit applyingI0
-corrected RCSs shows a good agreement with the true BrO SCD at most wavelengths, BrO SCDs retrieved with
uncor-rected RCSs can differ by more than 10 %. In the field, vol-canic emissions can vary greatly on short time scales. Also, changing O3SCDs in early and late hours of the day have to
be considered. Therefore, a retrieval wavelength range with a low dependency on theI0effect and cross correlations to
other absorbers is needed rather than one that can be well cor-rected under stable conditions. In an evaluation wavelength range with a lower limit between 320–335 nm, the devia-tions from the true BrO SCDs are below 5 % applying un-corrected RCSs. Given the variability of strong absorbers at lower wavelengths, i.e. SO2and O3, and the increased cross
correlations observed for lower wavelength limits<325 nm (Sect. 4.2.2), evaluations should be performed at the upper range of suggested interval.
However, a specific retrieval wavelength interval can not be recommended for the evaluation of BrO in volcanic plumes here. Advanced modelling of synthetic spectra (in-cluding realistic simulations of the atmospheric radiative transfer and the Ring effect in a 3-dimensional atmosphere once the respective tools are created) in comparison with measured spectra is needed in order to advise one on choos-ing a specific retrieval wavelength interval. A simplified ap-proach is presented in Appendix B, but the results need to treated with care for the above given reasons.
6 Conclusions
The retrieval wavelength interval is one of the most important parameters in a DOAS retrieval. Finding the optimal retrieval wavelength interval is not trivial, because many wavelength-dependent effects may influence the retrieval, such as instru-mental features, cross correlations between absorption cross sections and wavelength-dependent radiative transfer. Previ-ous publications were motivated by the comparison of the applied wavelength retrieval interval with typically one or two additional wavelength intervals. The lack of appropriate visualisation prohibited a systematic study of the parameter space and made an easy determination of the optical retrieval wavelength interval extremely difficult.
In this study a novel method is presented that consists of systematically varying the retrieval wavelength interval of DOAS retrievals and displaying the results in a contour plot. In this way, appropriate spectral intervals become im-mediately visible. Furthermore, the method is not limited by studying the dependency of the retrieved SCDs on the evalu-ation wavelength intervals. Other parameters influencing the DOAS retrieval can be studied in the same way, such as cross correlations of RCSs, the effect of errors in theI0correction,
residual amplitude and shifts in wavelength-pixel calibration of the instrument.
In order to prove the concept, several tests were performed for two synthetic measurement scenarios of BrO by pas-sive DOAS instruments. The scenario for zenith-sky DOAS reproduces conditions of stratospheric BrO measurements
292 L. Vogel et al.: DOAS retrieval interval mapping
Fig. 13. Deviations from the true SCDs of trace gases other than BrO in test I of the measurement scenario of
BrO in volcanic plumes using uncorrected RCSs. The respective true SCD±1%is indicated in white,
over-and underestimation in red over-and blue colours.
44
Fig. A1 Deviations from the true SCDs of trace gases other than BrO in test I of the measurement scenario of BrO in volcanic plumes using uncorrected RCSs. The respective true SCD±1 % is indicated in white, over- and underestimation in red and blue colours.
at mid-latitudes, whereas the scenario of BrO in volcanic plumes captures typical conditions encountered when mea-suring BrO in tropospheric volcanic plumes. For the latter measurement scenario, this work constitutes the first system-atic study of the dependency of retrieved BrO SCD on the retrieval wavelength interval. Tests on synthetic spectra in-cluded the assessment of theI0effect and the influence of its
correction on the BrO retrieval. Furthermore, cross correla-tions between different absorption cross seccorrela-tions were inves-tigated and a statistical study was conducted on the influence of noise on the retrieval.
By studying synthetic spectra, interpretation of results is aided by knowledge of the SCDs applied to construct the spectra. Measured spectra usually lack this a priori knowl-edge, and thus other approaches have to be chosen to ob-tain an optimal retrieval wavelength interval. For example, for certain measurement conditions some trace gases should not be present. In the case of MAX-DOAS measurements, different reference spectra can be compared, whereas night-time measurements of LP-DOAS systems should not yield BrO or other photochemically produced species.
For the example of synthetic spectra of passive DOAS measurements, the novel tool of retrieval wavelength map-ping was introduced. However, the method is not limited to these types of instruments but can be applied to any DOAS measurement. Thus, it enables a systematic study of important retrieval parameters, can highlight pitfalls in any DOAS retrieval and allows for an encompassing motivation of applied parameters.
Appendix A
BrO in volcanic plumes – Test I: individual SCDs of all trace gases applying uncorrected RCSs
RCSs are negligible, the discussion is restricted to the re-trieval applying uncorrected RCSs.
Table 3 shows the differential optical densities of all trace gases in the synthetic spectrum for three different wavelength intervals. These values se