ISSN (Online): 2320-9364, ISSN (Print): 2320-9356
www.ijres.org Volume 4 Issue 8 ǁ August. 2016 ǁ PP. 73-80
www.ijres.org 73 | Page
Research of the USIP Slope One Collaborative Filtering
Recommended Algorithm Based on Hadoop
Ning Su
1,Wenya Du
1,Weiping Liu
1,2*(1College Of Information Science And Technology, Jinan University, China) (2Zhongshan Aiscent Technologies Ltd, Zhongshan, Guangdong, 528437, China)
(*Corresponding author: Weiping Liu E-mail: [email protected])
Abstract:
As the Internet technology grows, various kinds of information have been presented in front of us, and it is getting more and more difficult for us to retrieve the information in which we are interested. The so-called Collaborative Filtering is an efficient path to solve this problem, because it can build a model through the analysis of users' historical information, and recommend to the users the products they are potentially interested in. Slope one is a classical Collaborative Filtering recommended algorithm, however, its forecasting accuracy can be affected by the data sparsity. Therefore, this paper proposed an improved Slope One algorithm USIP (User Similarity and Item Property). Based on the user average similarity and the item attribute similarity, this algorithm calculates the prediction score of user u to the target item j through the auto-adapted adjustment of the proportion between both sides, as well as conducts parallelization on the data with the distributed Hadoop platform, so as to improve the ability of processing data. The result indicates that the improved algorithm enhances the accuracy of the prediction and the execution speed, as well as is suitable for processing the large-scale data.Keywords: Recommendation; Improved Slope One; Hadoop platform; MapReduce ;Similarity
I.
INTRODUCTION
As the scale ofelectronic commerce grows, the commodity type and quantity also grow rapidly. Thus, users have to spend more time in finding their satisfied goods. So the personalized recommendation system becomes more and more necessary and grow up as a main research direction recently. The recommendation system analyzes users' preference according to their personal information and purchase records to recommend the satisfied goods to the users better and faster, as well as to improve the service quality of e-commerce itself. For example, the main e-commerce companies such as Baidu, Amazon and Taobao, Dangdang, Jingdong and other websites have already adapted the personalized recommendation technology.
The major recommendation technologies are divided into several types: the content-based recommendation, the knowledge-based recommendation, the association rules-based recommendation, the effectiveness-based recommendation and Collaborative Filtering. At present, the collaborative Filtering (CF) [1] recommendation technology is is the most widely adapted among various personalized recommendation systems,which analyzes users' preference according to the users' history behaviorin order to recommend the most relevant products to users. As well known, recommendation algorithm is the core of the recommendation technology. Slope One is one of the widely adapted recommendation algorithm, which mainly considers the users who have been already scored in their scored item and pre-prediction items to estimate the target users' scoring in pre-prediction items by these scores. But if there are few or no users who score the pre-prediction item, it will probably leadto a large error in prediction score, or a failure in predicting the prediction score. To solve the problem, the weighted Slope One has been proposed in literature [2], which carrying on the weighting on the basic Slope One according to the number of users who score the pre-prediction item,. Literature [3] and [11] proposed an algorithm that integrated the dynamic k-Nearest-Neighborhood with Slope One that canbe adaptive to the higher data sparse recommendation system. Literature [4] proposed a kind of Slope One that is based on item semantics similarity. This algorithm integrated Slope One and the model of item semantics similarity, and then obtained a final prediction score on the item j that the user makes. Literature [5] proposed to take the number of items that were scored by the user as the weightin the calculation of score deviation among the items. Literature [6] proposed to take the similarity among the users as the weight, and then calculated the score deviation among items. Literature [7] carried out the pre-filling on the empty scoring items in the item scoring matrix for users with Slope One, as well as the recommendation on the after-filling scoring matrix with the user-based Collaborative Filtering. Literature [8] modified user-item scoring matrix with average value filling and singular value decomposition.
www.ijres.org 74 | Page
calculates the average similarity of the users, and then of the items. After that, it adjusts the proportion between the user-based similarity and the item-based similarity occupied in the final prediction score by the automatic adjusting the parameter α to optimize the algorithm. In the end, the algorithm is implemented in the MapReduce programming frame by using Hadoop distributed cluster to improve the accuracy and efficiency to the algorithm prediction, as well as achieve the high-activity processing on big data.II.
P
RINCIPLES OFS
LOPEO
NESlope One algorithm is a simple and efficient collaborative filtering recommendation algorithm proposed by Professor Daniel Lemire and Anna Maclachlan publishedin the paper in 2005 [9].Of which the linear fitting formula is written as :
b
x
x
f
(
)
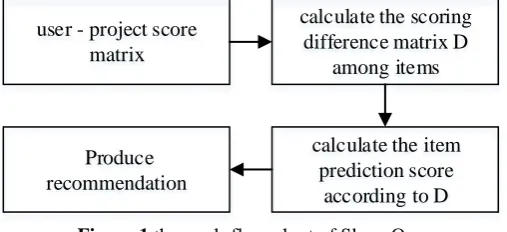
(1)Regression line between any two items can be obtained, according to the scoring information of items. Then we can calculate the score of the unrated item according to the scored item,the recommendation is given out according to the ordering of the calculated scores of the items. The work-flow-chart of Slope One is as follow:
user - project score matrix
calculate the scoring difference matrix D
among items
calculate the item prediction score
according to D Produce
recommendation
Figure 1 the work-flow-chart of Slope One
The data source of Slope One is similar to user - item score matrix. It is based on the assumption: the diversity between items can be measured according to the D-value of users' scoring, while the values of the same user's scoring on the different items also reflect the diversity of such items. Assuming Rui to represent the
scoring value of user u to item i and Pujto represent the prediction scoring value of user u to item j. the unknown
Pujis calculated according to these known Rui in the user-item score matrix, the working principle of Slope One
algorithm is as follows:
(1)Assuming that the scoring of the same user v to any two items i and j conform to the linear fitting formula, namely Rvj=Rvi+devij, where devij is the scoring difference of the user v to both items i and j. Thus the
calculation of the similarity between items can be accomplished using the following formula.
j i U
U
v i j
vj vi ij
U
U
R
R
dev
|
|
(2)In the above formula, Rvj refers to the scoring that the user v makes on item j; Ui refers to the user sets in
which the users participate in scoring the item i; |Ui∩Uj| refers to the number of users who score both item i and
item j.
(2) If the user u scores the item i, then the scoring assigned to the item j by user u can be predicted that by using the above formula, namely Puj=Rui+devij.The final prediction score Pujcan be given after calculating the
possiblescore that assigned to the item j by all users and the arithmetical mean of possible scoring under the Slope One principle that the average value can be used to replace the scoring differences between two unknownindividuals, the result can be used as the final prediction score that the user u makes on item j. The computation formula is defined as follows:
u Su i
ij ui
uj
S
dev
R
P
)
(
(3)
In which, Su refers to the items set scored by user u; |Su| refers to thenumber of items that user u scored;
www.ijres.org 75 | Page
However, whilecalculating the regression line, Slope One does not take the number of users in the same item into account. If there are 100 users who score item 1 and item 2, and there are 1000 users who score item 3 and item 2, at this time the influence of users' scoring in item 3 obviously is larger than that in item1 and item 2.In consideration of this situation, Daniel Lemire et al proposed an improved weighted algorithm (Weighted Slope One) , in which the Pujvalue is calculated by adding the number of users who simultaneously score bothitems as the weight when conducting scoring with Slope One. The computation formula is as follows:
Su i ij Su i ij ij ui ujC
C
dev
R
P
)
(
(4)Cij refers to the number of users who simultaneously scored both item i and item j. Slope One's
prediction is a linear prediction function, therefore its computing speed is relatively fast, but its prediction accuracy is not ideal, especiallywhen the user-scoring matrix is sparse.
III.
I
MPROVEMENT OFS
LOPEO
NEThis paper proposes the USIP Slope One based on the average similarity among the users or the items similar property weighting. The algorithm proposed ensures the parameter optimization through the dynamic adjustment of α,α is item parameter average similarity .Meanwhile, this paper will takesinto accountthe user similarity, and adjusts the proportion of both sides through the dynamic adjustment of α, which is more convenient and reasonable.
3.1 The Slope One based on the user average similarity
Firstly we calculate the similarity between two users with Pearson correlation coefficient, and the formula sim(u,v) is defined as follows:
uv uv uv I c v vc I c u uc I c V vc u ucR
R
R
R
R
R
R
R
v
u
sim
2 2)
(
)
(
)
,
(
(5)Here Ruc refers to the scoring assigned to item c by user u;
u
R refers to the average of the
scoresassignedby user u to all the items; Iuvrefers to the item set in which all the items assignedby both user u
and user v make scoring. The computing result shows thatthe value of Pearson correlation coefficient higher, the similarity between two users bigger, otherwise, the similarity between users smaller.
Here this paper will calculate the average user similarity between user u and all the items i that participate in the scoring, as well as generates the user-item similarity matrix.Let S(u,i) represent the average user similarity between user u and all the items i that participate in the scoring. The computation formula is defined as follows:
1
)
,
(
)
,
(
( ) ( )
Ui
v
u
Sim
i
u
S
v Ui v u (6)Here v refers to the scored non u users; Sim(u,v) refers to the similarity of user u and user v; |Ui| refers to the number of users who participate in the scoring of item i. Because |Ui| contains user u, so the denominator of equation (6) needs to minus 1 when in calculation.
Finally combining the results of the average deviations devij of item scoring and user average similarity
S(u,i) that are calculated above, the prediction scoring Pujcan be calculated by the below formula:
Su i Su i ij ui uji
u
S
i
u
S
dev
R
P
)
,
(
)
,
(
)
(
(7)3.2 The Slope One based on the item property similarity
www.ijres.org 76 | Page
degree between arbitrary two items of them according to the similar property. Then we define the property similarity between item i and item j as:b
a
c
j
i
sim
2
)
,
(
(8)The data in this paper comes from the MovieLens website. The name, show time and genre of English movies on MovieLens websiteare presentedin detail in the descriptions. We extract the movie's genre description information to take it as the item's parameter property. Then we calculate the parameter similarity between both sides according to above-mentioned formula, and then construct the item parameter similarity matrix.
Given the item j is the non u scored item, the formula of item-based prediction score assigned to item j by the user u is defined as:
Si k kj Si k kj uk uja
a
r
r
(9)The formula above shows that the same user has the similar preference to the item of similar type.Thus we can take the parameter similarity of other items and pre-predict item as the weight, and calculate the weighted average value of this user to the scored item, in order to predict users' score to this pre-predict item.
3.3 The improvement of the integrated USIP Slope One
We determine α by the item parameter average similarity which can auto be adjusted by empirical data. Assume that the item to be calculated Ij has Xjparameters, while other items I1, I2,… In separately has x1, x2,… xn
parameters, and the common parameters between Ij and I1, I2,… Inare yj1、yj2...yjnrespectively. Thenαis written
as follows:
nk k j jk
k
j
n
n
x
x
y
n
j
sim
1)
,
2
(
)
1
)(
(
2
)
,
(
(10) Therefore, the formula of the prediction scoring is written as follows:0
)
,
min(
,
)
-1
(
),
,
max(
) 2 ( ) 1 ( ) 2 ( (1) ) 2 ( ) 1 ({
uj uj uj uj uj ujr
r
r
r
otherwise
r
r
uj
r
(11)
In the formula(11), ruj(1) and ruj(2), respectively, refer to the prediction scoring of user u to target item j
thatbased on the user average similarity and item similarity parameters. Improvement USIP Slope One utilizes the advantages of both user average similarity and item similarity, dynamically adjusts of the proportion of both sides, so the improved USIP Slope One could enhance the predictionaccuracyand execution efficiency for the algorithm.
IV.
T
HE IMPLEMENTATION OF IMPROVEDUSIP
S
LOPEO
NE IN THEM
APR
EDUCEThe improved USIP Slope One algorithm is implemented by using the programming model to decompose the improved algorithm into a series of MapReduce job stream basing on Hadoop distributed-computing-platform In this way we distribute the algorithm into difference steps. Such method makes use of the function programming language, simplifiy data treating processes into Map and Reduce. These two processes are the key part of this computation model. The specific purpose of these two functions will be designed by users in accordance with their own needs.
www.ijres.org 77 | Page
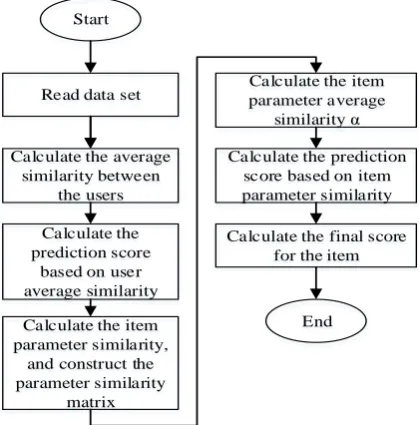
And at the stage of the Reduce process, Reducer takes <k2, list(v2)> as the input of the Reduce function, and then obtains the key value to <k3, v3> and output to HDFS after carrying on corresponding processing. MapReduce's specific realizing processes are showed as follows:Read data set
Calculate the average similarity between
the users
Calculate the prediction score
based on user average similarity
Calculate the item parameter similarity,
and construct the parameter similarity
matrix
Calculate the item parameter average
similarity α
Calculate the prediction score based on item parameter similarity
Calculate the final score for the item Start
End
Figure 2 the MapReduce flow chart of USIP Slope One
The calculatation of the average similarity between the users is divided into two MapReduce duties, the first duty's goal is to calculate the user sets that participate in the scoring of various items. The specific processes are shown as follows:
User-row scoring matrix : (Userid,<Itemid,
pref>)
Map
Item-row scoring matrix : (Itemid,<Userid,
pref>)
Reduce
Item and the user who scores the item: (Itemid,<Userid1,Userid2
,Userid3,Userid4...>)
Figure 3 Calculate the user sets that participate in the scoring of various items
The second goal is to calculate the average similarity between users. The calculation procedures of MapReduce are shown as follows.
The similarity between two users: (Userid1,<Userid2,
SimilarityValue>)
Item and the user who scores the item: (Itemid,<Userid1,Userid
2,Userid3,Userid4...>)
Map
The average similarity between users: (Userid,<Itemid,
SimilarityValue>)
The result that the default Reduce directly
enter Map
Figure 4. Calculate the average similarity between users
The calculation of parameter similarity between the items is similar to the calculation above, so we will omit unnecessary details.
www.ijres.org 78 | Page
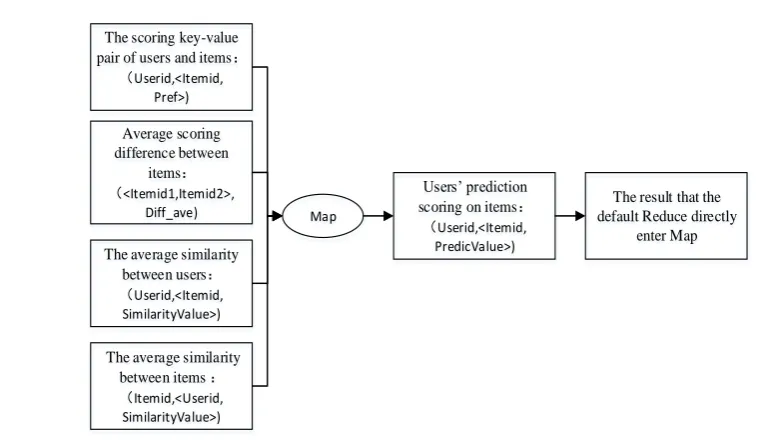
The average similaritybetween users: (Userid,<Itemid,
SimilarityValue>) Average scoring difference between
items: (<Itemid1,Itemid2>,
Diff_ave) The scoring key-value pair of users and items:
(Userid,<Itemid, Pref>)
The average similarity between items : (Itemid,<Userid, SimilarityValue>)
Map
Users’ prediction scoring on items: (Userid,<Itemid,
PredicValue>)
The result that the default Reduce directly
enter Map
Figure 5 Calculate the users' final prediction score to the item
V.
THE
EXPERIMENTALRESULTS
AND
ANALYSIS
The experiment data set in this paper adopts the Movie scoring data sets MovieLens that are supplied by GroupLens research product group which is a Web-based research recommendation system, used to receive the users' scores on the movie, and provide the corresponding movie recommended list. This data set we adopted in our experiment has 100,000 scoring records, including 943 users' scoring to 1,682 movies with each user at least scores 20 movies. The scoring scope is 1~5 points. If the score is higher, it means the users' appraisal to the movie is higher. The degree of rarefication for the data is:
n
m
N
S
1
(12)In the formula(12), m refers to the number of users; n refers to the number of items; N refers to the overall appraisal score. Then, the degree of rarefication for the data set under this experiment is:
937
.
0
1682
943
100000
1
(13)This experiment takes a computer as the Master node, and takes the other 3 computers as the Slave node.The hardware configuration of each node is: The processor is AMD A8-5600K frequency is 3.60GHz, the memory is 4.00GB, the hard disk is Seagate 1TB, the operating system is Windows 7 64bit flagship version. The Hadoop is configured strictly in accordance with the method and step disposition given in the Hadoop official website [10],of which the edition is Hadoop 1.1.2.
The statistical accuracy and decision support accuracy are two main measuring standards to judge the quality of the recommendation system. For the statistical precision measuring method, the mean absolute error (MAE) is the most commonly-used recommendation quality index. By calculating the mean deviation between user's prediction score and actual score in the test data set to measure the accuracy of the prediction algorithm, we can intuitively evaluate the recommendation quality. If the MAE value is smaller, it means the recommendation quality is higher.
Given that the users' actual score set in the test data set is {q1, q2, q3,…qN}, and the prediction score set
is {p1, p2, p3,…pN}, the definition of the corresponding MAE is:
Ni
i
i
q
p
N
MAE
1
1
(14)
www.ijres.org 79 | Page
proportion of training set to test set is 8:2, other parameters are the same as before; Group 4, the proportion of training set to test set is 9:1, other parameters are the same as before. And experiment results are drawn the line chart for the experimental results of various algorithms in Figure 6.Figure 6the prediction precision of various algorithms under different proportions of training set
It is observed that in the figure 6: the MAE value decreases with the proportion of the training set in any kind of Slope One model. At the same training set proportion the MAE value differ from each other in different Slope One model. For example, when the training set accounts for 60%, the MAE value obtained in basic Slope one is 0.8147, the MAE value is 0.7516 when the training set accounts for 90%; the weighted Slope One takes the second place, the MAE value is 0.7425 when the training set accounts for 90%,the MAE value is 0.7521 when the training set accounts for 60%; the USIP Slope One algorithm that this paper improves is the smallest, the MAE value is 0.7216 when the training set accounts for 60%. However,we can see that our USIP Slope One have the smallest MAE value in any case, in other words it has a higher prediction precision, thus it can enhance the accuracy for the commodity recommendation.
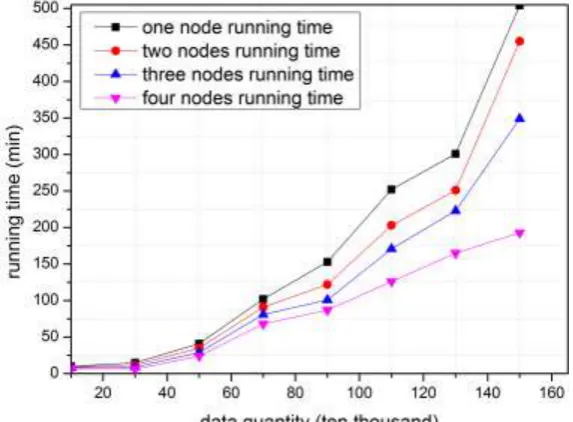
Next, the computing efficiency is another factor that must be considered.We operate the USIP Slope One on the Hadoop which with different quantity of nodes under the same condition. The results are shown in Figure 7.
www.ijres.org 80 | Page
It can be observed that in the figure 7: when the data quantity is very small, the USIP Slope One's serial running time is nearly the same with the MapReduce's parallel running time. This is because that under the case of small data set, when executed in parallel, the deployment tasks, data interaction and other processes between Master nodes and Slave nodes will consume some resources, and thus slow the computing speed, leading to that MapReduce's operating efficiency is not high under the small data set. Along with the size of data set increases, the running time under the MapReduce frame is greatly reduced, the efficiency constantly enhances, so the superiority under parallel running getting more and more obvious when the data quantity becomes greater, it shows that the USIP Slope One has a good execution efficiency and extendibility on the Hadoop clusters, as well as manifest the advantages of USIP Slope One in processing large data on the Hadoop platform.VI.
CONCLUSION
In this paper,we fully play the respective superiority of user-based similarity and item-based similarity of Slope One. By analyzing and improving the principle of Slope one, this paper, based on the user average similarity and item property similarity, proposes USIP Slope One, which gives a generalized analysis of the influence of user similarity and item parameter similarity on the prediction scoring, so as to make the dynamic adjustment of the proportion of them in the prediction scoring, which make it could effectively solve the problem of data sparseness and cold start. Our USIP Slope One algorithm is implemented under the Hadoop-based MapReduce programming frame to realize efficient data processing, thus improve the ability of processing data. The test data set in this paper adopts the Movie scoring data sets MovieLens,the experiment is divided into four groups to test,by comparing the prediction accuracy of various algorithms under different proportions of training set,the experimental results show that the USIP Slope One could be able to enhance the accuracy of the prediction, as well as have good execution efficiency if under the Hadoop-based MapReduce frame and good scalability.
ACKNOWLEDGEMENTS
This work is supported in part by Strategic Emerging Industries Project of Guangdong Province (No.2011912027).
REFERENCES
[1]. Sarwar B, Karypis G, Konstan J, et al. Item-based collaborative filtering recommendation algorithms[C]//Proceedings of the 10th international conference on World Wide Web. ACM, 2001: 285-295.
[2]. LEMIRE D,MACLACHLAN A.Slope One predictors for online rating-based collaborative filtering[C]//Proceedings of SIAM Data Mining Conference. Newport Beach,California, 2005:471-475. [3]. Sun L, Jingjiao L I. SlopeOne Collaborative Filtering Recommendation Algorithm Based on Dynamic k-Nearest-Neighborhood[J]. Journal of Frontiers of Computer Science & Technology, 2011, 5(9):857-864.
[4]. WANG Yi LOU Heng yue School of Information Science amp Technology, University S J, Chengdu. Improved Slope One Algorithm for Collaborative Filtering[J]. Computer Science, 2011.
[5]. Jiang T, Lu W, Xiong H. Personalized collaborative filtering based on improved slope one alogarithm[C]//Systems and Informatics (ICSAI), 2012 International Conference on. IEEE, 2012: 2312-2315.
[6]. SUN Mingtao,ZHANG Hui,SONG Shiyu,et al.USO-A New Slope One Algorithm Based On Modified User Similarity [C]//2012 International Conference on Information Management,Innovation Management and Industrial Engineering(ICIII).Sanya:IEEE,2012: 335-340.
[7]. WANG Pu,YE Hongwu. A Personalized Recommendation Algorithm Combining Slope One Scheme and User Based Collaborative Filtering [C]//2009 International Conference on Industrial and Information Systems.Haikou:IEEE,2009:152-154.
[8]. Liu W J. Predicting User's Page Interest Degree by Using Singular Value Decomposition[J]. Journal of Applied Statistics & Management, 2012.
[9]. D. Lemire, A. Maclachlan. Slope One Predictors for Online Rating Based Collaborative Filtering. SIAM Data Mining(SDM’05). 2005: 21-25.
[10]. Aapache Hadoop. Hadoop[EB/OL].[2011-02-15]http://hadoop.apache.org/.