Pothole Dimensions Measurement using Mean
Shift-based Speckle Filtering
Prof. A. B. Makone Mr. Amitkumar G. Rathod
Department of Electronics & Telecommunication Engineering
Department of Electronics & Telecommunication Engineering
MIT College of Engineering Aurangabad, Aurangabad, India MIT College of Engineering Aurangabad, Aurangabad, India
Abstract
This paper presents a Pothole dimensions’ measurement using mean shift based speckle filtering. The mean shift algorithm, which uses a moving window and utilizes both spatial and range information contained in an image, is widely employed in digital image filtering and segmentation. The mean shift algorithm has been studied and applied successfully for speckle reduction in images. Speckle reduction techniques need to be applied before information extraction. Speckle reduction for distributed requires weighted averaging pixels within a homogeneous area. The mean shift is an iterative process. The mean shift filtering is more powerful and effective to reduce the speckle noise and edges and texture preservation. Potholes in road surfaces are mostly caused by water and regular road maintenance is vital to prevent the decaying process. The pothole damage detection is derived from the assumption that any strong dark edge within the extracted road surface is estimated a pothole edge if it observes to certain size constraints. The size constraints were obtained using the selection of images withheld for parameter correction. Any shape of outline that meets these conditions is estimated a pothole by the algorithm. The proposed method for detecting a pothole starts by converting the extracted road section image to a gray scale image.
Keywords: Mean Shif Algorithm, Speckle filtering, Pothole Detection Method
________________________________________________________________________________________________________
I. INTRODUCTION
With the increase in world’s population, there has been increasing load on the groundwork. Roads have been flooded with the vehicular traffic. It has become increasingly difficult to manage this traffic. This is the prime inspiration behind making a vehicle intelligent enough to aid driver in various aspects. One of the increasing problems the roads are facing is degraded road conditions. Because of many reasons like rains, oil spills, road accidents or expected wear and tear make the road difficult to drive upon. Unexpected difficulties on road may cause more accidents. Also because of the bad Potholes on road conditions, fuel consumption of the vehicle increases causing wastage of valuable fuel. Because of these reasons it is very important to get the information of such bad Potholes on road conditions.
Speckle is granular ‘noise’ that degrades the image quality and arises because of the vast majority of surfaces like synthetic and natural are extremely rough on the scale of wavelength such as laser, satellite image, medical ultrasound suffers from a common phenomenon called speckle. The resulting fluctuations generate images with grainy appearance, which makes detection and classification tasks difficult. Speckle noise is a multiplicative noise.
The mean shift algorithm has been studied and applied successfully for speckle reduction in images. Speckle reduction techniques need to be applied before information extraction. Speckle reduction for distributed requires weighted averaging pixels within a homogeneous area. This process actually contains two main steps. The Selection of homogeneous pixels and the estimation of the estimate central pixel value and the MMSE estimator have been proved to produce an unbiased estimate and have the best overall speckle-filtering performance. The mean shift is an iterative process. The mean shift filter is often used as a reference, because it combines an efficient noise reduction, while maintaining the edges, texture and sharpness of the images. The mean shift filtering is more powerful and effective to reduce the speckle noise and edges and texture preservation [5].
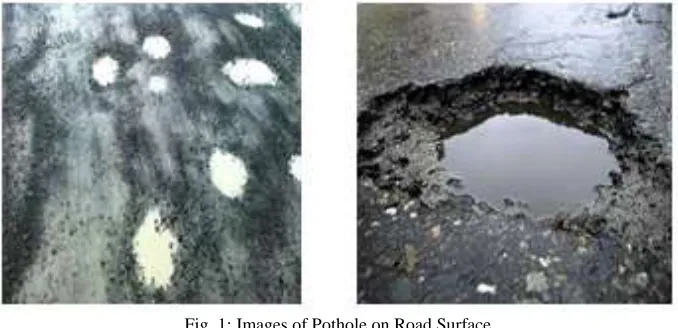
Potholes in road surfaces are mostly caused by water and regular road maintenance is vital to prevent the decaying process. An example of a road with potholes is shown in Fig.1 the way in which a pothole forms is dependent on the type of bituminous pavement surfacing. The capacity of traffic and the axle load experienced by the road are example factors that lead to fatiguing of the road surface, resulting in the formation of cracks. These cracks allow water to seep through and mix with the asphalt. When a vehicle drives over this area, this water will be expelled through the crack with some of the asphalt, and this will slowly create a hole underneath the crack. Eventually the road surfaces will failure into the hole, resulting in a visible pothole. If regular road maintenance is neglected, the above-mentioned cracks are not repaired before they cause substantial damage to the road. For road maintenance to take place, it is obvious that the entity responsible for the road in question must know where the pothole or decaying road section is located and an automated process could assist with this. Potholes are also problematic for drivers as they can cause a lot of damage to their vehicles. Currently, there is no system available to drivers that would allow them to avoid potholes. There is thus a potential market for such a solution.
would reduce the additional formation of potholes. The proposed system focuses on the pothole detection task and estimating the area on road surface [6].
Fig. 1: Images of Pothole on Road Surface
Speckle noise is present in satellite image, medical ultrasound, and laser images. This noise is due to the coherent sum of many elementary scatters in each resolution cell and gives a grainy appearance to images that make detection and classification tasks more complex. Speckle noise in satellite images has a great impact on terrain classification and scene interpretation. Speckle reduction techniques need to be applied before information extraction. Detection of pothole for estimating area of damaged road in city, determining the preliminary maintenance for a road management system and in taking immediate action for their repair and maintenance.
II. LITERATURE SURVEY
TITLE METHOD ADVANTAGES DISADVANTAGES
“A Review Of Speckle Filtering In The Context
Of Estimation Theory”, Ridha Touzi, IEEE Transactions On Geoscience And
Remote Sensing Vol.40, No.11, Nov 2002.[1]
The Multiplicative And The Product Speckle Models,
It Depends Strongly On The Speckle And Scene Models Used As The Basis For Filter
Development.
No, Whole Analysis Of The Various Speckle-Scene
Models Has Been Published.
“Spatial Range Mean Shift Filter And Segmentation
Applied To SAR Image” P. Jarabo- Amores. Rosa-
Zurera, D. De Lamata-Moya, R. Vicen-Bueno And S. Maldonado- Bascom, IEEE Trans. In Strum. Meas., Vol. 60 No.
2, Pp. 584–597, Feb. 2011.[2]
Segmentation Method
In The Direction Of The Texture Information And Edges The Segmentation Method Is Not Formed On Correct Result.
“Tsunami Damage Investigation of Built-Up Areas Using Multitemporal
Space Borne
Full Polarimetric SAR Images”, Si-Wei-Chen, Motoyuki Sato, IEEE Transactions On Geoscience And
Remote Sensing, Vol. 51, No. 4, April 2013.[3]
The Polarimetric Scattering Mechanism Changes Were Quantitate-Vely Examined
with Model-Based Decomposition.
The Use of Full Polarimetric Synthetic Aperture Radar Images for Tsunami Damage
Investigation from The Polarimetric Data.
SAR Images Are Mainly Use, When Weather Conditions
Are Not Appropriate for Optical Sensing.
“Mean Shift Based Speckle Filtering
Of Polarimetric SAR Data”,Fengkai Lang,Jie Yang,Deren Li, Lei Shi,Julie
Wei,IEEE Transactions On Geoscience And
In Case Speckle Reduction Methods Need to Be Applied
Before Data Removal.
It Concludes A Good Balance Between The Speckle Filtering
It Has Been Not Showed to Produce An Unbiased
Remote Sensing, Vol.52, No.7, July 2014, Pp: 4440-4454.[5]
And Preservation. The
Time Is Concentrate-Ed Because
There Is No Any Other Preprocess-Ing Steps.
“Automatic Detection And Notification Of Potholes And Humps On Roads To
Aid Drivers”, Rajeshwari Madli, Santosh Hebbar, Praveenraj Pattar,
G.V.Prasad, IEEE Sensors Journal 2015 [6].
In Case Pothole Detection Method Is Used. And GSM
SIM900, GPS, PIC16F877A, Ultrasonic Sensors. Android Application, Need
For These Implementing Instruments Of Proposed
System.
The
Proposed Approach Is an Economic Solution For
Detection Of Dreadful Potholes And Uneven Humps, As It Uses
Low Cost Ultrasonic Sensors. The Mobile Application Used In
This System Is An Additional Advantage.
It Does Not Consider The Fact That Potholes Or Humps Get Repaired By
Concerned Authorities Periodically.
III. MEAN SHIFT PROCEDURE
The mean shift algorithm uses moving, not fixed, windows to select the homogeneous pixels and considers both spatial and spectral information in the two main filtering steps. In the second step, the mean shift adopts the weighted averaging method to estimate the value of the central pixel, which is very similar to the MMSE estimator. The smaller the distance between the central pixel and its neighbor, the larger the weight. The larger the distance, the smaller the weight; when the distance is larger than the bandwidth, the weight is zero. In this way, the mean shift filter can achieve a good balance between speckle filtering and detail preservation. The mean shift is a simple non parametric technique for both kernel density estimation and gradient density estimation. It was proposed by Fukunaga and Hostetler in 1975. The mean shift filter can be used for edge-preserved smoothing or for segmentation. Edges and sharp details of an image will have estimated along with gradient densities and this will be used as a reference for mean shift filtering. For each pixel of an image, the set of neighboring pixels is determined. Mean shifting will be carried out iteratively based on estimated values and nonlinear operation will be carried out accordingly [5].
Kernel Density Estimation
Thus, the calculated mean values will assist as the new center for the next repetition.
Where the function k(x) is the kernel profile and c makes the integral of K(x) equal to one. To reduce the complexity of the estimation, the bandwidth matrix H is chosen proportional to the identity matrix H = I. Therefore, the PDF estimator can be written as
The first step in a process of feature extraction with the Underlying density f(x) consists of finding the modes of this density. The modes of a continuous pdf are the values at which it attains the relative maximum values; therefore, ∇f(x) = 0. The mean shift method allows finding these modes without estimating the pdf. The mean shift vector is calculated as follows.
The mean shift vector is calculated as
Where g(x) = - (x), and G(x) = g ( K(x) is the shadow kernel of G(x). At each point, the mean shift vector always points toward the direction of maximum increase of f(x) so it can define a path leading to a stationary point of f(x), such as the mode. The mean shift method is defined as an iterative process in which in each step, (4) is calculated and added to the center of the window (kernel) to obtain the new center. This process converges to a point near the point where the pdf estimator gradient is zero [5]. We would like to introduce often used Gaussian kernels, which will also be employed in our experiments.
increasing the sigma of the kernel reduces the amplitude substantially. The Gaussian kernel was the most flexible, because its truncation and shape parameters are independent. The Gaussian kernel is more competitive because of its independent truncation and shape parameters. Therefore, the Gaussian kernel can nearly always give good results by using different combinations of truncation and shape parameters we shall always use the Gaussian kernel in the mean shift filter [5].
Application to Image Processing
Image filtering is a process by which they can enhance, modify or mutilate images. Filtering reduces the influence from noise to mode detection. Mean shift filtering can work with binary, gray scale, RGB and arbitrary multichannel images. Filtering is the first step of mean shift segmentation process. A second step is the clustering of filtered data point.
Let , i = 1. . . n, be the sequence of the d-dimensional independent and identically distributed, random variable and , j = 1, 2. To which the successive locations of mean shift vectors point. Given a point x, assign = x. From (14), can be calculated by
Moreover, from (4) and (5), the jth mean shift vector can be written as
(6) Begin
1) Assign an initial point x, initialize j = 1, and = x.
2) Compute and according to (5) and (6).
3) If and is the mode point; else,
4) Assign = , and j = j + 1, go to step 2.
End
The mean shift can be used as a nonlinear edge-preserving filter. If the differences among pixel intensities are small enough to be in the range bandwidth, then the mean shift algorithm acts as a low pass filter in the spatial region defined by the spatial bandwidth. Near edges, the intensity differences are higher, and if they are big enough to fall out of the range bandwidth, then the range part of the kernel will be close to zero and no filtering will be applied. Bilateral filters have also been proposed for smoothing images while preserving edges.
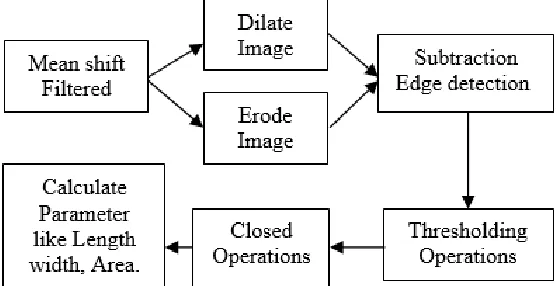
Block Diagram for Mean Shift Algorithm
Fig. 2: Block diagram for Mean Shift Algorithm
Fig. 4: Mean shift filter output
IV. SYSTEM MODELLING
The proposed system offers a cost effective solution for detecting potholes on roads and estimating their dimensions in terms of length, width, area. Firstly, introduce the mean shift procedure and filter used in image processing. Then the briefly review the pothole image data and analyze the speckle-filtering problem. Selection of parameters in the proposed method and their effects on the filtered results are analyzed in detail. Finally, the results on simulated and actual pothole images and gives some evaluations of the proposed approach.
Fig. 3: Block Diagram of proposed system
The Pothole Detection System
The pothole damage detection is derived from the assumption that any strong dark edge within the extracted road surface is estimated a pothole edge if it observes to certain size constraints. Any shape of outline that meets these conditions is estimated a pothole by the algorithm. The proposed method for detecting a pothole starts by converting the extracted road section image to a gray scale image. To clear up this image and remove noise, the edge detector produces a black-and-white image. Unwanted edges, especially around the outer boundaries of the road, are created by shadows of branches and leaves in trees and are more often degraded by sections of light magnificent through. Additionally, other vehicles on the road also create unwanted edges.
The dark regions found within a pothole are usually small in the edge, and often a single pothole will not produce a single edge, but many small edges that are not connected together. Another problem encountered is that the extracted road surface sometimes has sharp and unwanted unconnected edges on its outer boundaries To solve this problem, it was determined that the unwanted edges close to the outer boundaries can be removed by dilating the edge output image several times. Performing dilation on an image increases the area of the lighter pixels. As a result, when dilation is performed, the unwanted edges close to the outer boundaries become absorbed into the outer boundary leaving only the boundary outline visible. The last outline detection is then applied to the dilated image to find the potholes within the road section. The outlines are filtered and those that do not meet the size constraints of the pothole detection are rejected. This last step filters out any small defects in the road that are not classified as potholes as well as the larger outlines found on the outer boundary of the extracted road [2].
Edge Detection
typically organized into a set of curved line segments termed edges. The same problem of finding discontinuities in one dimensional signal is known as step detection and the problem of finding signal discontinuities over time is known as change detection. The mathematical problem of deriving an optimal smoothing filter given the criteria of detection, localization and minimizing multiple responses to a single edge.
Dilation Operation
Dilation is one of the basic operations in mathematical morphology. Originally developed for binary images, it has been expanded first to gray scale images, and then to complete lattices. The dilation operation usually uses a structuring element for probing and expanding the shapes contained in the input image.
With A and B as set in the dilation of A by b denote A B is defined.
A B =
The equation is based of reflecting B about its origin and shifting this reflection by Z. The dilation of A by B then is the set of all
displacement Z, such that and an overlap by at least one element. Keep in mind however that dilation is based on set operation
and therefore is a non-linear operation whereas convolution is a linear operation, dilation grows or thickens object in binary image. Erosion Operation
Erosion is one of two fundamental operations (the other being dilation) in morphological image processing from which all other morphological operations are based. It was originally defined for binary image later being extended to gray scale images, and subsequently to complete lattices.
With A and B as set in the Erosion of A by b denote A B is defined.
A B =
In words, this equation indicates that the erosion of A by B is the set of all point Z such that B translated by Z is contained in A. The erosion shrinks or thins objects in a binary image. In fact, we can view erosion as a morphological filtering operation in which image details smaller than the structuring element are filtered from the image Erosion performed the functions of a line filter.
Thresholding
Thresholding is simplest method of image segmentation from gray scale image thresholding can be used to create binary image. Once we computed a measure of edge strength typically gradient magnitude. The next stage is to apply a threshold to decide whether edge are present or not at an image point. The lower the threshold, the more edges will be detected. Color images can also be threshold. One approach is to designate a separate threshold for each of the RGB components of the image and then combine them with an AND operation.
Closing Operation
In mathematical morphology, the closing of a set binary image, A by a structuring element B is the erosion of the dilation of that set, In image processing, closing is, together with opening, the basic workhorse of morphological noise removal. Opening removes small objects, while closing removes small holes.
The closing of set A by S E B denotes A B is defined,
A B = (A B) B
This says that the closing of A by B is simply the dilation of A by B followed by the erosion of the result by B.
(g)
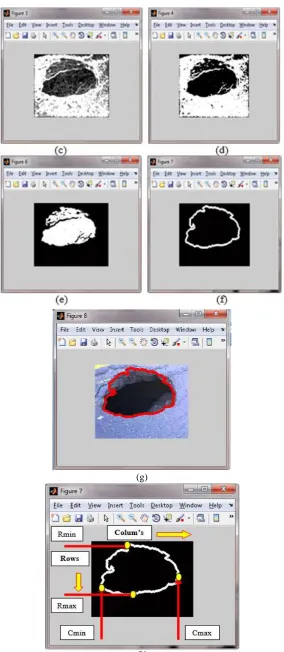
Fig. 5: Shows Step of Detection of Pothole (a)Select input image (b) Dilate original image and then subtract it from original input image. (c) Convolve it with a mask (d)Apply Thresholding. (e)Then invert the image (f)Identify the closed area. (g) After masking this edge detected
V. PERFORMANCE EVOLUTION
The potholes detection system using two dimensional Pothole images that had been collected by a survey of Aurangabad and Akola city were used. Two-dimensional images with a pothole image extracted from the collected pothole database were used to compare the performance of the proposed method with that of the existing method by several conditions such as road conditions. System on which pothole detection system is developed has configuration as follows.
Processor: i5 processor, 64 bit
RAM: 4 GB
Windows 7 operating system
Using software, MATLAB version R2013a. having image processing toolbox and user friendly Graphical user interface can have made with the help of Matlab. The Matlab provides graphical interface such as push button, edit text, menu type, list box, toggle button etc. and to collect image data of potholes from digital camera.
To collect image data of potholes, the camera resolution is 680 × 420. A total of 30 images taken from for tests. For 15 images taken from 70 cm height and other 15 images for taken from are 110 cm height. Tests by Potholes images, images were selected randomly, the examples and results of the selected images for testing by road condition. It is shown that the proposed method accurately detects the potholes in images. For tests by record condition, and Figure shows the examples and results of the selected images for experiment by record condition. In Figure, it is shown that the proposed method accurately detects most of the potholes in images.
Performance of System
Performance of pothole detection system is evaluated using dimensions’ measurement like length, width, and area. In both case real measurement and proposed system measurement of pothole detection.
Dimensions Calculation
For dimension calculation we have used image. Using [r, c] =find (img==1); function; get the row’s and column’s. This will give us the rows and column location of every white pixel (Wp).
Now find Maximum Rows (MAR) and Minimum Rows (MIR), also Maximum Coolum’s (MAC) and Minimum Colum’s (MIC). Hence, Length = MAR-MIR.
Width = MAC-MIC
After using imfill function count the number of white pixels and this will give us the area. Area = Wp (number of white pixels).
This is done by using [r, c] = find (img==1); And then number of rows by using length(r) Therefore, Area= length(r).
Since, length counts the number of rows, which will be equal to number of white pixel as each pixel has its own row and column property. And those will be detected by find command. Finally, find out how many pixels is equal to how many meters and divide all the calculated dimensions with this value to obtain the approximate dimensions in meters.
Error Calculation
The error is calculated by taking difference between Actual pothole area and pothole area calculated by system. The error arises because while taking image of database the causing factors can be shadow on road, positioning of camera, moment of camera. The error calculated by using following formula.
Error =
% Error = 100.
Table - 1
Evolution of Actual Potholes Calculated Area and Pothole Area Calculated by System.
Image Taken Height from 70 cm, No. of Pixels = 2 Are Equal to = 1 cm
Image Actual Pothole Calculate Area ( ) Pothole Area Calculate by System ( ) % Error
Img.1 3284 3273.0 0.33
Img.2 3708 3693.0 0.40
Img.3 2134 2119.5 0.67
Img.4 6772 6765.5 0.09
Img.5 6424 6413.0 0.17
Table – 2
Evolution of Potholes Area Calculated by System.
Image Pothole Area Calculate by System ( )
Img.1 2396.0
Img.2 3163.0
Img.3 1864.0
Img.4 5534.5
Img.5 5666.0
VI. CONCLUSIONS
In this paper, Pothole damage detection system is developed. Mean shift filtering techniques are used for remove speckle noise and achieve for good filtering result. The mean shift algorithm has been applied for speckle filtering and segmentation of pothole images acquired form camera. Gaussian kernels have been used in mean shift filter. The edges and sharp details of an image will have estimated along with gradient densities and this will be used for mean shift filtering.
A set of bandwidth parameters is proposed, that improves the mean shift filter performance in speckle noise reduction and edges preservation. The difference between actual calculated area and system calculated area of pothole is approximately same. The comparison of filtered image on detected potholes. The pothole detection (edge) obtained using the three methods are different. Those results prove the efficiency of mean shift filtering stage.
REFERENCES
[1] Ridha Touzi “A Review of Speckle Filtering in the Context of Estimation Theory”, IEEE Transactions on Geoscience and Remote Sensing, Vol.40, No.11, November 2002.
[2] Pilar Jarabo-Amores, Manuel Rosa-Zurera, David de la Mata-Moya, Raúl Vicen-Bueno, and Saturnino Maldonado-Bascón, “Spatial-Range Mean-Shift Filtering and Segmentation Applied to SAR Images”, IEEE Transactions on Instrumentation and Measurement, vol. 60, no. 2, February 2011.
[3] J Senthilnath, H Vikram Shenoy, Ritwik Rajendra, S N Omkar, V Mani and P G Diwakar, “Integration of speckle de-noising and image segmentation using Synthetic Aperture Radar image for flood extent extraction”, J. Earth Syst. Indian Academy of Sciences, Sci. 122, No. 3, pp. 559–572 June 2013. [4] Si-Wei Chen, and Motoyuki Sato, “Tsunami Damage Investigation of Built-Up Areas Using Multitemporal Spaceborne Full Polarimetric SAR Images”, IEEE
Transactions on Geoscience and Remote Sensing, Vol.51, No.4, April 2013.
[5] Fengkai Lang, Jie Yang, Deren Li, Lei Shi, and Jujie Wei, “Mean-Shift-Based Speckle Filtering of Polarimetric SAR Data”, IEEE Transactions on Geoscience and Remote Sensing Vol. 52, No. 7, July 2014.
[6] Seung-Ki Ryu, Taehyeong Kim, and Young-Ro Kim, “Image-Based Pothole Detection System for ITS Service and Road Management System”. Hindawi Publishing Corporation Mathematical Problems in Engineering Volume 2015.
[7] Rajeshwari Madli, Santosh Hebbar, Praveenraj Pattar, G.V.Prasad, “Automatic Detection and Notification of Potholes and Humps on Roads to Aid Drivers”, IEEE Sensors Journal 2015.