R E S E A R C H
Open Access
Three-dimensional mapping of cortical
bone thickness in subjects with different
vertical facial dimensions
Mais Medhat Sadek
*, Noha Ezat Sabet and Islam Tarek Hassan
Abstract
Background:The purpose of this study was to determine differences in cortical bone thickness among subjects with different vertical facial dimensions using cone beam computed tomography (CBCT).
Methods:From 114 pre-treatment CBCT scans, 48 scans were selected to be included in the study.
CBCT-synthesized lateral cephalograms were used to categorize subjects into three groups based on their vertical skeletal pattern. Cortical bone thickness (CBT) at two vertical levels (4 and 7 mm) from the alveolar crest were measured in the entire tooth-bearing region in the maxilla and mandible.
Results:Significant group differences were detected with high-angle subjects having significantly narrower inter-radicular CBT at some sites as compared to average- and low-angle subjects.
Conclusions: Inter-radicular cortical bone is thinner in high-angle than in average- or low-angle subjects in few selected sites at the vertical height in which mini-implants are commonly inserted for orthodontic anchorage.
Keywords: CBCT, Mini-implants, Cortical thickness, Facial type
Background
The morphology of the craniofacial region is dominantly controlled by genetic factors. However, functional de-mands can have a significant effect on craniofacial growth and development [1]. Facial divergence has been related to the masticatory muscles, and the association between the hyperdivergent growth pattern and muscu-lar hypofunction has previously been reported [2]. Changes in loading exerted by the muscles during func-tion alter cortical bone thickness, not only at the site of muscle insertion but also in the alveolar bone of the tooth-bearing region of the jaws [3]. Accordingly, thick-ness of the cortical bone can provide an insight to the forces it experiences and is expected to vary in subjects with different vertical facial dimensions [4]. This was reported previously in which a significant, but complex relationship was found between cortical bone thickness and the facial type [5].
Recently, mini-implants have been extensively used as a reliable source of anchorage in orthodontics. Their small size, which allowed placement in inter-radicular areas; easy placement and removal; excellent anchorage; and low cost are main advantages [6]. Firm osseous sup-port is the single most imsup-portant factor for the success of an orthodontic mini-implant [7]. Cortical bone thick-ness (CBT) strongly affects biomechanical parameters of mini-implant bone interactions such as insertion torque and stress distribution [8, 9]. Recent studies were con-ducted to determine the optimal site for mini-implant placement inter-dentally based on measurements of cortical bone thickness using three-dimensional imaging [10–12] and skulls [13].
Furthermore, almost all studies that investigated the effects of CBT on the clinical success of mini-implants agreed that thin cortical bone is a real risk factor [9, 14, 15]. Motoyoshi et al. reported that CBT 1 mm or less is a risk factor for mini-implant failure [9]. Alrbata et al. found that the appropriate range of CBT for * Correspondence:[email protected]
Department of Orthodontics, Ain Shams University, Cairo, Egypt
supporting an orthodontic mini-implant was from 1 to 2 mm [7].
Only two studies reported the relationship between facial divergence and cortical bone thickness measured inter-dentally at the vertical height in which mini-implants are commonly inserted for skeletal anchorage [16, 17]. Cortical bone was significantly thinner in high-angle patients when compared with low-high-angle patients, thereby posing increased risk of mini-implant failure in this group of patients. However, these two studies only studied the posterior region of the jaws despite the fact that mini-implants can be placed anteriorly for overbite correction as well as for space closure.
The purpose of this study was to investigate whether there are statistically significant differences in cortical bone thickness in the tooth-bearing region of the jaws, in the anterior as well as the posterior region, among subjects with different vertical facial dimensions, using cone beam computed tomography. This would provide reference data for clinicians placing mini-implants in subjects with different facial types.
Methods
Cone beam computed tomography scans of 114 subjects, aged between 18 and 35 years old, were analyzed. Those scans were collected from the Department of Oral and Maxillofacial surgery and were taken for selected cases as a part of pre-extraction assessment of impacted man-dibular third molars. For some of these cases, a large field of view was taken where imaging for the upper third molars was also needed, and these were the scans included in the study. These tomographs were obtained by iCAT cone beam computed tomography (CBCT) scanner (Model 17/19 series; Imaging Sciences Inter-national, Hatfield, Pennsylvania, USA) at the following settings: 120 kVp at 5 mA for a total scan time of 7 s, with a voxel size 0.3 mm.
Subjects receiving previous or current orthodontic treatment, obvious periodontal disease (determined from radiographic signs of bone loss), missing permanent teeth (excluding third molars), severely ectopic teeth (such as buccally erupting canines), and evidence of pre-vious trauma were excluded. The remaining 48 scans
were then included in the study. Subjects’ rights were
protected, and approval was obtained from the univer-sity research ethics committee.
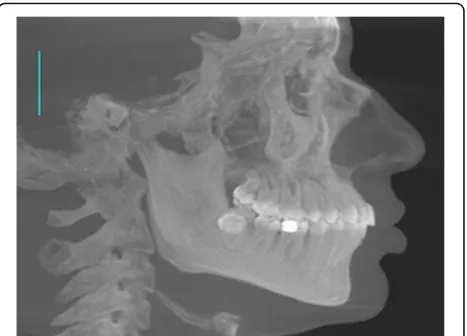
The three-dimensional image was reconstructed by iCATVision™software (version 1.7.0.7, Imaging Sciences International) and saved in digital imaging and commu-nications in medicine (DICOM) format. Subjects were classified into three groups based on their facial type as determined from lateral cephalograms synthesized from the CBCT scans using the maximum intensity projection technique (Fig. 1). The CBCT-synthesized
lateral cephalogram was then saved as JPEG image and imported into Onyx ceph™software (version 2.6.52, Image Instruments, Chemnitz, Germany).
Facial type categories were determined using the fol-lowing cephalometric measurements: (1) facial height index (the ratio of posterior facial height to anterior fa-cial height): it is equal to 66.2 ± 3.3 % in patients with an average growth pattern [18] and (2) mandibular plane angle (the angle between the anterior cranial base (sella to nasion, SN) and the mandibular plane (formed from menton to gonion, Me-Go): it is equal to 32.5° ± 3.4° in patients with an average growth pattern [18]). Patients had to fit into a single category for both measurements to be included in the study. Three subjects who fell into mixed categories on a single cephalogram were excluded from the groups. Subjects were divided according to facial type: 17 with an average vertical facial
dimen-sion—normal-angle group (10 women, 7 men), 13 with a
high vertical facial dimension—high angle group (7
women, 6 men), and 15 with a low vertical facial
dimen-sion—low angle group (8 women, 7 men).
Using iCATVision™ software, two-dimensional slices,
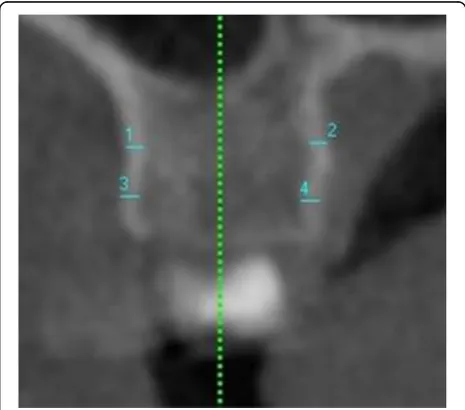
0.3-mm thick, through each contact area were cre-ated. Orientation of each site in all three planes of space was carried out before measurement. The inter-radicular area of interest was located on the sagittal slice (Fig. 2a). The slice was then oriented so that the inter-radicular space was bisected by the vertical ref-erence line and was parallel to the long axes of the roots. Orientation of the axial slice was then used to ensure that the horizontal reference line bisected the inter-radicular area and traversed the thinnest area of cortical bone (Fig. 2b). The horizontal reference line was moved to establish the measurement level in relation to the alveolar crest as seen on the coronal slice (Fig. 2c) [10].
For each inter-radicular space in the maxilla and man-dible, from the second molar on one side to the second molar on the opposite side, the following measurements were done:
Labial/buccal CBT at 4 and 7 mm apical to the crest of the alveolar bone. It was defined as the thickness of the labial/buccal cortical plate measured
perpendicular to the bone surface (Fig.3).
On the palatal side of the maxillary teeth, palatal cortical bone thickness was measured at 4 and 7 mm apical to the crest of the alveolar bone. The lingual cortical plate in the mandible was not measured because of its limited use for mini-implant placement [13].
To reduce fluctuations in measurement accuracy in this study, one trained orthodontist made all measure-ments. The intra-operator error was obtained by repeat-ing measurements by the same observer, 2 weeks apart, on ten randomly selected subjects. Inter-operator error measurements were evaluated by having other trained orthodontic operator take measurements on the same subjects. The intra-operator and inter-operator error was assessed using the intra-class correlation coefficient. High correlation was found for both intra-operator (r= 0.998) and inter-operator (r= 0.997) error.
Numerical data were explored for normality by check-ing the data distribution, calculatcheck-ing the mean and me-dian values, evaluating histograms and normality curves,
and using Kolmogorov–Smirnov and Shapiro–Wilk
tests. Data were presented by mean and standard devi-ation. Kruskal–Wallis test with statistical significance con-sidered at a P level lower than 0.05. When significantly different, further pair-wise comparisons were done with
Fig. 2Orientation of views for the inter-radicular measurements. aOrientation of sagittal slice.bOrientation of axial slice.cOrientation of coronal slice
the Mann–Whitney U tests with the Bonferroni adjust-ment. Statistical analysis was performed with IBM SPSS Statistics Version 20 for Windows (IBM Corporation, NY, USA. SPSS, Inc., an IBM Company).
Results
In the upper arch, on the buccal side, comparison of inter-radicular CBT measurements among the three groups revealed statistically significant differences at few selected sites primarily located mesial and distal to the first molar at the 4-mm level (Table 1) and mesial to the first molar at the 7-mm level (Table 2). Palatally, no sta-tistically significant differences were found at any site at the 4-mm level between the three groups (Table 3), while statistically significant differences were found me-sial and distal to the lateral incisor at the 7-mm level (Table 4). The low-angle group showed the thickest cor-tical plate while the high-angle group showed the thinnest.
On the other hand, in the lower arch, statistically significant differences were found in the mandibular posterior region, mesial and distal to the first molar at
the 4-mm level (Table 5) and at the region between first and second premolars, as well as mesial and distal to the first molar at the 7-mm level (Table 6). Similar to the upper arch, the low-angle group showed the thickest cortical plate while the high-angle group showed the thinnest.
Discussion
This study compared cortical bone thickness among subjects with different vertical facial dimensions in the entire tooth-bearing region of both jaws, using CBCT. This aimed to provide reference data for clinicians that will aid in mini-implant placement in subjects with vary-ing facial types.
Cortical bone thickness is the key determinant of ini-tial stability of mini-implants, and thin cortical bone was reported to increase the risk of mini-implants failure [19]. On the other hand, areas with thick cortical bone can increase the risk of mini-implant breakage and bone micro-fractures. This can pose two important questions: Do subjects with different vertical facial dimensions have different cortical bone thickness? And if yes, what are Table 1Measurements of buccal inter-radicular cortical bone
thickness at 4 mm from the alveolar crest in the upper arch
Mean Std. deviation Pvalue
CBT at midline High angle .8333 .17386 0.874
Normal .8450 .10464
Low angle .8786 .05669
CBT at 1/2 High angle .8750 .02739 0.685
Normal .9017 .19156
Low angle .8814 .41894
CBT at 2/3 High angle .9333 .13292 0.545
Normal .9400 .15556
Low angle .9886 .20772
CBT at 3/4 High angle .8950 .17479 0.253
Normal .9867 .15358
Low angle .9886 .13108
CBT at 4/5 High angle .9383 .07223 0.888
Normal .9717 .14077
Low angle .9757 .12232
CBT at 5/6 High angle .9000 a .03162 0.003*
Normal .9357 ab .12952
Low angle 1.0883 b .02440
CBT at 6/7 High angle .9167 a .02582 0.035*
Normal .9633 ab .06055
Low angle 1.1457 b .21953
Descriptive statistics, overall significance by Kruskal–Wallis test, and the results of pair-wise comparisons with the Mann–WhitneyUtest with the Bonferroni adjustment
*Significant atP≤0.05. Different letters are statistically significantly different
Table 2Measurements of buccal inter-radicular cortical bone thickness at 7 mm from the alveolar crest in the upper arch
Mean Std. deviation Pvalue
CBT at midline High angle .9033 .17049 0.862
Normal .9000 .06325
Low angle .9200 .14877
CBT at 1/2 High angle .9083 .03764 0.306
Normal .9600 .10789
Low angle .9257 .43428
CBT at 2/3 High angle .9883 .12497 0.298
Normal 1.0083 .20024
Low angle 1.1286 .16046
CBT at 3/4 High angle .9250 .02739 0.114
Normal 1.1000 .24916
Low angle 1.1057 .14421
CBT at 4/5 High angle .9667 .11690 0.66
Normal 1.0583 .15651
Low angle 1.0614 .22638
CBT at 5/6 High angle .9000 a .03162 0.046*
Normal .9383 ab .15092
Low angle 1.0614 b .15614
CBT at 6/7 High angle 1.0517 .16005 0.613
Normal 1.0833 .12144
Low angle 1.1471 .20862
Descriptive statistics, overall significance by Kruskal–Wallis test, and the results of pair-wise comparisons with the Mann–WhitneyUtest with the Bonferroni adjustment
the clinical implications of such differences on mini-implant stability?
Masumoto et al. through measurements of cortical bone thickness on 31 dry skulls of modern Japanese males found that cortical bone thickness of the man-dibular first and second molar sections was thicker in short-faced subjects than in average- and long-faced subjects [5]. Swasty et al. investigated differences in CBT in patients with different vertical facial dimensions using CBCT [20]. It was reported that the long-faced group had thinner cortical bone in almost all sites. Unfortu-nately, this study measured CBT at one third and two thirds the distance from the base of the mandible to the alveolar crest, rather than using a standard site for the measurements.
Similar to our study, Ozdemir et al. measured CBT at 4 mm from the alveolar crest, which appears to corres-pond to the attached gingiva [17]. This was reported to be a favorable area for mini-implant placement, consid-ering the lower probability of inflammation. They found a close relation between facial type and cortical bone thickness, at the inter-dental sites from the distal aspect of the canine to the mesial aspect of the second molar. Cortical bone thickness in the low-angle group was sig-nificantly higher than in the high-angle group in all four measured sites.
In our study, significant group differences were de-tected with high-angle subjects having significantly nar-rower inter-radicular CBT at some sites as compared to average- and low-angle subjects. These were in the pos-terior region of the maxilla and mandible on the buccal side and palatally in the maxilla mesial and distal to the lateral incisor, at the vertical height in which
mini-implants are commonly inserted for orthodontic
anchorage.
Horner et al. reported that the cortical bone was 0.08 to 0.64 mm thicker in the hypodivergent than in the hyperdivergent subjects [16]. This is similar to the find-ings of our study in which the cortical bone was 0.16 to 0.62 mm thicker in the hypodivergent than in the hyper-divergent subjects.
Furthermore, the results of this study may be corre-lated with the findings of previous studies [20, 21], in which a significant relationship was found between facial type and alveolar thickness. High-angle subjects were found to have thinner alveolus at almost all sites in the mandible. This could be associated with the finding that these are the same subjects that showed a thinner cor-tical plate in the posterior region of the mandible when compared to normal- or low-angle cases.
Such differences in CBT among subjects with different vertical facial dimensions can have significant clinical Table 3Measurements of palatal inter-radicular cortical bone
thickness at 4 mm from the alveolar crest in the upper arch
Mean Std. deviation Pvalue
CBT at 1/2 High angle .8833 .04082 0.092
Normal 1.0800 .14241
Low angle .9271 .55087
CBT at 2/3 High angle .6083 .47267 0.084
Normal 1.0417 .17058
Low angle 1.0771 .62152
CBT at 3/4 High angle .99 .257 0.114
Normal 1.25 .095
Low angle 1.21 .298
CBT at 4/5 High angle .8083 .41282 0.432
Normal 1.0650 .31002
Low angle 1.0171 .15185
CBT at 5/6 High angle .9683 .21470 0.624
Normal 1.0050 .11292
Low angle .9800 .07071
CBT at 6/7 High angle 1.10 .180 0.557
Normal .93 .026
Low angle 1.01 .144
Descriptive statistics, overall significance by Kruskal–Wallis test, and the results of pair-wise comparisons with the Mann–WhitneyUtest with the Bonferroni adjustment
*Significant atP≤0.05
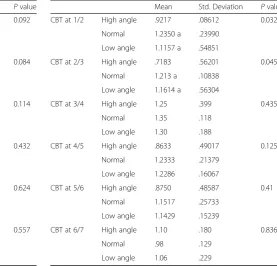
Table 4Measurements of palatal inter-radicular cortical bone thickness at 7 mm from the alveolar crest in the upper arch
Mean Std. Deviation Pvalue
CBT at 1/2 High angle .9217 .08612 0.032*
Normal 1.2350 a .23990
Low angle 1.1157 a .54851
CBT at 2/3 High angle .7183 .56201 0.045*
Normal 1.213 a .10838
Low angle 1.1614 a .56304
CBT at 3/4 High angle 1.25 .399 0.435
Normal 1.35 .118
Low angle 1.30 .188
CBT at 4/5 High angle .8633 .49017 0.125
Normal 1.2333 .21379
Low angle 1.2286 .16067
CBT at 5/6 High angle .8750 .48587 0.41
Normal 1.1517 .25733
Low angle 1.1429 .15239
CBT at 6/7 High angle 1.10 .180 0.836
Normal .98 .129
Low angle 1.06 .229
Descriptive statistics, overall significance by Kruskal–Wallis test, and the results of pair-wise comparisons with the Mann–WhitneyUtest with the Bonferroni adjustment
implications. An association between higher risk of fail-ure of mini-implants and subjects with high mandibular plane angle has been previously reported [15]. On the other hand, Kuroda et al. insisted that there was no cor-relation between the success rate of mini-implants and the mandibular plane angle [22]. From the results of our study, it appears that although there is a correlation be-tween the vertical facial dimensions and inter-radicular cortical bone thickness at the vertical height in which mini-implants are commonly inserted, this is evident in only few sites: primarily located in the posterior region of the maxilla and mandible on the buccal side and pal-atally in the anterior region of the maxilla. More studies are thus needed to determine the exact relationship be-tween the vertical skeletal pattern and the success rate of mini-implants.
Another clinically related important fact is that high-angle subjects when compared to the other two groups tended to have more sites with cortical bone thickness less than 1 mm, which according to Motoyoshi et al. can increase the risk of failure of mini-implants placed at these sites [9].
This should merit our attention to take precautions to increase the success rate of mini-implants placed in high-angle patients, especially if they are an important part of our treatment plan. This can include to monitor and emphasize oral hygiene more strictly or to use par-tially osseointegrated mini-implants that may offer higher stability. Another option would be to use mini-plates which were reported to be associated with a lower failure rate than mini-implants [23]. Furthermore, exten-sive research is needed exploring different ways to pro-mote mini-implant stability as they are being used more and more in our practice.
Perhaps most importantly, the results give clinicians reference data for measurements of cortical bone thick-ness for subjects with different vertical skeletal patterns. However, several factors must be taken into consider-ation when evaluating the results. First, this study did not investigate the difference between male and female subjects. However, in a recent study by Farnsworth et al., no sex differences in cortical thickness in either the maxilla or the mandible were found between males and females [10]. Since maximum bite force is not a regular Table 6Measurements of buccal inter-radicular cortical bone thickness at 7 mm from the alveolar crest in the lower arch
Mean Std. deviation Pvalue
CBT at midline High angle 0.91 0.08 0.428
Normal 1.01 0.08
Low angle 0.92 0.11
CBT at 1/2 High angle 1.00 0.10 0.905
Normal 1.01 0.10
Low angle 1.02 0.07
CBT at 2/3 High angle 0.95 0.09 0.055
Normal 1.24 0.07
Low angle 1.11 0.10
CBT at 3/4 High angle 1.04 0.10 0.061
Normal 1.19 0.11
Low angle 1.26 0.07
CBT at 4/5 High angle 1.16 0.12 0.007*
Normal 1.33 0.21
Low angle 1.56 0.18
CBT at 5/6 High angle 1.31 c 0.08 <0.001*
Normal 1.65 b 0.18
Low angle 1.85 a 0.20
CBT at 6/7 High angle 1.96 b 0.21 <0.001*
Normal 2.05 b 0.17
Low angle 2.33 a 0.09
Descriptive statistics, overall significance by Kruskal–Wallis test, and the results of pair-wise comparisons with the Mann–WhitneyUtest with the Bonferroni adjustment
*Significant atP≤0.05. Different letters are statistically significantly different Table 5Measurements of buccal inter-radicular cortical bone
thickness at 4 mm from the alveolar crest in the lower arch
Mean Std. deviation Pvalue
CBT at midline High angle 0.91 0.18 0.726
Normal 0.83 0.11
Low angle 0.91 0.14
CBT at 1/2 High angle 0.95 0.11 0.800
Normal 0.87 0.20
Low angle 0.92 0.11
CBT at 2/3 High angle 0.90 0.14 0.572
Normal 1.01 0.14
Low angle 1.02 0.15
CBT at 3/4 High angle 0.96 0.16 0.461
Normal 1.01 0.16
Low angle 1.02 0.09
CBT at 4/5 High angle 1.01 0.22 0.082
Normal 1.27 0.20
Low angle 1.37 0.14
CBT at 5/6 High angle 1.09 c 0.19 0.005*
Normal 1.48 b 0.14
Low angle 1.71 a 0.11
CBT at 6/7 High angle 1.51 b 0.14 0.029*
Normal 1.75 a 0.13
Low angle 1.85 a 0.20
Descriptive statistics, overall significance by Kruskal–Wallis test, and the results of pair-wise comparisons with the Mann–WhitneyUtest with the Bonferroni adjustment
or habitual function, like mastication, for example, it might not be expected to produce sex differences in cortical thickness.Second, inherent limitations of CBCT imaging should also be considered [24]. Partial volume averaging can influence the spatial resolution. Thin bone is especially susceptible to partial volume averaging. Third, the differences in the density of cortical bone were not evaluated in this study. In future research, we should also evaluate bone mineral density of cortical bone. As well as bone quantity (bone thickness), bone quality (mineralization) can affect initial stability values for orthodontic mini-implants [6].
Conclusions
Inter-radicular cortical bone was thinner in high-angle subjects, compared to the low- and normal-angle groups, in the posterior region of the maxilla and man-dible on the buccal side as well as palatally in the maxilla mesial and distal to the lateral incisor, at the vertical height in which mini-implants are commonly inserted for skeletal anchorage. High-angle subjects tended to have more sites with cortical bone thickness less than 1 mm.
Abbreviations
CBCT:Cone beam computed tomography; CBT: Cortical bone thickness
Funding
This study was not funded by any organization. It was funded by the authors.
Authors’contributions
MMS assisted in the collection of CBCT scans, performed the measurements, and wrote the article. NES revised the article and performed the statistics. ITH assisted in the collection of CBCT scans, assisted in performing the measurements (inter-operator error measurements), and assisted in writing the article. All authors read and approved the final manuscript.
Competing interests
The authors declare that they have no competing interests.
Consent for publication Not applicable.
Ethics approval and consent to participate
This study was approved by the ethics committee, Faculty of Dentistry, Ain Shams University.
Received: 2 March 2016 Accepted: 14 September 2016
References
1. Sommerfeldt DW, Rubin CT. Biology of bone and how it orchestrates the form and function of the skeleton. Eur Spine J. 2001;10 Suppl 2:S86–95. 2. Buschang P, Throckmorton G. Influence of jaw muscle strength on
malocclusion. In: Sachdeva RCL, editor. Orthodontics for the next millennium. Glendora, Calif: Ormco; 1997.
3. Sato H, Kawamura A, Yamaguchi M, Kasai K. Relationship between masticatory function and internal structure of the mandible based on computed tomography findings. Am J Orthod Dentofacial Orthop. 2005;128:766–73.
4. Bresin A. Effects of masticatory muscle function and bite-raising on mandibular morphology in the growing rat. Swed Dent J Suppl. 2001;150: 1–49.
5. Masumoto T, Hayashi I, Kawamura A, Tanaka A, Kasai K. Relationships among facial type, buccolingual molar inclination, and cortical bone thickness of the mandible. Eur J Orthod. 2001;23:15–23.
6. Park J, Cho HJ. Three-dimensional evaluation of interradicular spaces and cortical bone thickness for the placement and initial stability of microimplants in adults. Am J Orthod Dentofacial Orthop. 2009;136:314. e1-314.e12. 7. Alrbata RH, Yu W, Kyung HM. Biomechanical effectiveness of cortical bone
thickness on orthodontic microimplant stability: an evaluation based on the load share between cortical and cancellous bone. Am J Orthod Dentofacial Orthop. 2014;146:175–82.
8. Motoyoshi M, Hirabayashi M, Uemura M, Shimizu N. Recommended placement torque when tightening an orthodontic miniimplant. Clin Oral Implants Res. 2006;17:109–14.
9. Motoyoshi M, Yoshida T, Ono A, Shimizu N. Effect of cortical bone thickness and implant placement torque on stability of orthodontic mini-implant. Int J Oral Maxillofac Implants. 2007;22:779–84.
10. Farnsworth D, Rossouw PE, Ceen RF, Buschang PH. Cortical bone thickness at common miniscrew implant placement sites. Am J Orthod Dentofacial Orthop. 2011;139:495–503.
11. Fayed MMS, Pazera P, Katsaros C. Optimal sites for orthodontic mini-implant placement assessed by cone beam computed tomography. Angle Orthod. 2010;80:939–51.
12. Martinelli FL, Luiz RR, Faria M, Nojima LI. Anatomic variability in alveolar sites for skeletal anchorage. Am J Orthod Dentofacial Orthop. 2010;138:252. e1-252.e9. 13 Baumgaertel S, Hans MG. Buccal cortical bone thickness for mini-implant
placement. Am J Orthod Dentofacial Orthop. 2009;136:230–5. 14 Wei X, Zhao L, Xu Z, Tang T, Zhao Z. Effects of cortical bone thickness at
different healing times on microscrew stability. Angle Orthod. 2011;81:760–6. 15 Miyawaki S, Koyama I, Inoue M, Mishima K, Sugahara T, Takano-Yamamoto
T. Factors associated with the stability of titanium screws placed in the posterior region for orthodontic anchorage. Am J Orthod Dentofacial Orthop. 2003;124:373–8.
16 Horner KA, Behrents R, Kim KB, Buschangd PH. Cortical bone and ridge thickness of hyperdivergent and hypodivergent adults. Am J Orthod Dentofacial Orthop. 2012;142:170–8.
17 Ozdemir F, Tozlu M, Germec-Cakan D. Cortical bone thickness of the alveolar process measured with cone-beam computed tomography in patients with different facial types. Am J Orthod Dentofacial Orthop. 2013;143:190–6. 18 Shafey AR. Lateral and frontal cephalometric templates and norms for
Egyptian adults: reconstructed cone beam views. Master thesis. Cairo: Cairo University; 2011.
19 Motoyoshi M, Matsuoka M, Shimizu N. Application of orthodontic mini-implants in adolescents. Int J Oral Maxillofac Surg. 2007;36:695–9. 20 Swasty D, Lee J, Huang JC, Maki K, Gansky SA, Hatcher D, Miller AJ.
Cross-sectional human mandibular morphology as assessed in vivo by cone-beam computed tomography in patients with different vertical facial dimensions. Am J Orthod Dentofacial Orthop. 2011;139:e377–89.
21 Sadek MM, Sabet NE, Hassan IT. Alveolar bone mapping in subjects with different vertical facial dimensions. Eur J Orthod. 2015;37(2):194–201. 22 Kuroda S, Sugawara Y, Deguchi T, Kyung HM, Takano-Yamamoto T. Clinical
use of miniscrew implants as orthodontic anchorage: success rates and postoperative discomfort. Am J Orthod Dentofacial Orthop. 2007;131:9–15. 23 Schätzle M, Männchen R, Zwahlen M, Lang NP. Survival and failure rates of orthodontic temporary anchorage devices: a systematic review. Clin Oral Implants Res. 2009;20:1351–9.