Published online March 10, 2013 (http://www.sciencepublishinggroup.com/j/ijmsa) doi: 10.11648/j.am.20130202.13
A GTEM chamber design with frequency flexibility using
metamaterial concepts on the septum
Humberto X. Araujo
1,2,*, Luiz Carlos Kretly
21Dept.of Telecommunications and Mechatronics, Federal University of Sao Joao Del Rei, UFSJ, Ouro Branco, Brazil 2Dept. of Mircrowave and Optics, University of Campinas, UNICAMP, Campinas, Brazil
Email address:
[email protected] (H. X. Araujo), [email protected] (L. C. Kretly)
To cite this article:
Humberto X. Araujo, Luiz Carlos Kretly. A GTEM Chamber Design with Frequency Flexibility Using Metamaterial Concepts on the Septum, International Journal of Materials Science and Application. Vol. 2, No. 2, 2013, pp. 47-55. doi: 10.11648/j.ijmsa.20130202.13
Abstract:
In this work it is shown the strategy of use metamaterial technology to improve the GTEM chamber performance. The analysis and characterization of different types of metamaterial patterns, such as fractal cells, Jerusalem-Cross-Pair, SRR – Split Ring Resonator and CSRR – Complementary Split Ring Resonator printed on the septum of a GTEM chamber was done. The main goal is to give a flexibility frequency range for electromagnetic compatibility analysis of integrated circuits and electronic boards. Experimental results are compared to simulated ones showing the advantages of the tuned characte-ristic of the patterned septum in comparison to the conventional type. This technique appears as an option for the performance optimizations of compact GTEM chambers.Keywords:
APEX, Electromagnetic Compatibility (EMC), Gigahertz Transverse Electromagnetic (GTEM), Metamaterial1. Introduction
Electrical and electronic devices are constantly present in human lives, as providing communication, entertainment or transportation. In many cases, integrated circuit is the main cause of interference in electronic equipments [1, 2]. The Electromagnetic Compatibility (EMC) of an electrical de-vice is its capability to operate safely in an electromagnetic environment without interfering [3, 4]. In this context, the control of EMC becomes a very critical issue.
EMC test setups at electronic system levels are defined in standards such as CIPR 25 (CIPR, 2002) for parasitic emis-sions and ISO-11452 for susceptibility to electromagnetic interference. The international electro-technical commission (IEC) by its group leader in measurement researches in integrated circuit has defined two basic standards: radio frequency radiated (TEM/GTEM, Magnetic Loop, Magnetic probe) and conducted emissions (1Ω/150Ω, Workbench Faraday Cage - WBFC); and RF immunity. Open Area Test Site (OATS) is another useful kind of test setup, which is characterized by a large metallic panel covered by RF and microwave absorbers. In this setup antennas are used to generate and/or to measure the fields. However, just with the cells TEM/ GTEM and the WBFC setup are possible to perform both immunity and radiated tests.
Due to the good performance of the GTEM chamber
concerning the other methods, mainly in economic terms and frequency range, in this work is shown the design of a Gigahertz Transverse Electromagnetic Chamber (GTEM) projected to operate from 500 MHz to 18GHz, modified by the use of metamaterials on the center conductor, to give more flexibility in terms of frequency range.
2. GTEM Design and Construction
2.1. Design Guidelines
The origin of the Gigahertz Transverse Electromagnetic chamber (GTEM) was based on the transverse electromag-netic chamber (TEM) which is basically a planar expanded transmission line operating in the TEM mode to simulate a free space planar wave [4]. This expanded waveguide with a flat and wide center conductor and coated by electromag-netic waves absorbers, is commonly used in analyses of products that are physically small and compacts, especially electronic components.
At low frequencies only the TEM mode propagates on the chamber. However, with the increase of the operational frequency, the TE and TM modes can be excited inside the chamber. The maximum frequency is calculated from the first lower resonant of the higher modes, which depends on the size and shape of the chamber.
chamber. However, with the increase of the operational frequency, the TE and TM modes can be excited inside the chamber. The maximum frequency is calculated from the first lower resonant of the higher modes, which depends on the size and shape of the chamber.
The need for EMC measurements on upper frequencies, Hansen et al. [5] proposed a new concept of TEM cells. The idea behind the new chamber was in avoiding the tapered corners which are the main reason for the TEM cell fre-quency limitations. So, it becomes a new chamber called GTEM (Gigahertz Transverse Electromagnetic) in which is possible to do measurements from some hertz through 18 GHz. The restriction on upper frequency limit is eliminated by tapering the transmission line continuously outward from the feed point to a termination system. The tapered point and the absorbers at the end of the chamber are what allow this chamber to operate in high frequency.
As the chamber is assumed to work only with small de-vices, a testing volume of 10 cm x 10 cm x 10 cm is defined. Therefore, an electrical field intensity of 10 V/m in the vo-lume testing is required. Using 0.3 W as input power and based on Fig. 3, the distance between the bottom of the cell and the septum is around 40 cm. This value is essential to define the exact position of the testing volume. Other boundary condition is the height of the absorbers, herein is 30 cm. To avoid reflections on the body of the chamber, a safety region around 35 cm between the absorbers and the EUT should be considered [6]. As a rule of thumb, the first approximation to the length of the chamber is obtained as:
3( V TA A)
L= T +D +L (1)
Where TV is the testing volume, DTA the safety distance
between the testing volume and the absorbers, and LA is the
length of the absorbers.
Fig. 3. GTEM chamber – Construction strategy.
A crucial challenge on the design of the GTEM chamber is to establish the correct size of the Apex, which works in the transition from the 50 Ω coaxial cable (input power) to the body of the chamber, and has a length around 10 % of the total length of the GTEM chamber.
The cell starts with an angle of 20º on vertical plane and 30º from horizontal orientation, while the center conductor opens with 19.5º [7]. Hence, the cross section dimensions of the rectangular waveguide are a height to width ratio of 2 to
3.
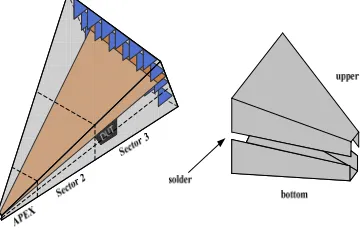
To avoid reflections due the abrupt change in diameter at the center pin of the N connector to the center conductor, the transition must be done very smoothly. Finally, the front panel of the apex should be as small as possible, but large enough to mount on a N connector. The following figure shows the designed APEX, and Fig. 2 shows the proposed GTEM. 7 .8 c m 1 .3 c m septum 5 .9 c m (a) 7 .1 c m 1 .9 5 c m septum 1 2 c m (b)
Figure 1. APEX details – (a) Side view; (b) Top view.
B A C D E F G H I J K
Fig. 2. GTEM dimensions: where K + J + I = 2.10 m, A = 1.1 m, E = 0.79 m, H and D according to the calculated dimensions of the APEX.
There are some known methods to build the GTEM, such as metal casting or through the welding of two or more folded metallic sheet. Here, the adopted strategy was to split the GTEM in two equal parts, and then weld them together.
To facilitate the chamber construction and assembly, the total length was split in three parts: APEX, Sector 2 and Sector 3, as shown in Fig. 3. Each of the three parts was split again due the physical limitations of the brass sheet (0.6 m x 1.2 m), and then joined by welding.
thickness was imposed. This physical limitation causes a small divergence between the simulated and experimental results, especially at higher frequencies. As the fabricated GTEM was made from mm range thickness brass sheet, the radius of curvature is also on this range.
2.2. GTEM Simulations
In this section some useful guidelines are described for GTEM simulation process. Although the simulation proce-dures are beyond the scope of this work, the reader must be aware of the complexity task involving the assembling of the different sectors of the chamber, materials attribute and its connections.
The simulations were done using two commercials soft-ware: CST which is based on FIT – Finite Integration Technique and HFSS based on FEM – Finite Elements.
The main step to begin the simulation process on EM software, based on FEM, is meshing the structure as usual. To assure an adequate electromagnetic field distribution, the analysis environment should extend at least λ/4 away from all radiating surfaces. Another crucial point is the boundary conditions, ensuring that the mesh is generated with suffi-cient accuracy on the outer boundary of the domain. The mesh length must be constrained to be no greater than λ/6 on the boundary [8]. Figure 4 shows the meshed structure. Due the chamber dimensions a high number of meshes were attributed to the structure, which imposes a high computa-tional memory and a time consumption task.
Fig. 4. GTEM meshed using HFSS software.
For a RF signal incident on one port, some fraction of the signal bounces back out of that port, some of it scatters and exits other ports (and it is perhaps even amplified), and some of it disappears as heat or even electromagnetic radiation [9]. As mentioned before, to avoid reflections between the connector and the center conductor, the match should be carefully designed. In Fig. 5 it is shown the APEX structure, built on an electromagnetic simulator CST, with the pro-posed matching strategy between the N connector and the septum.
Fig. 5. Rounded transition between the N connector and the septum.
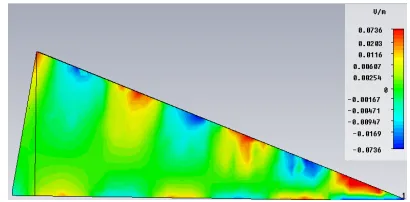
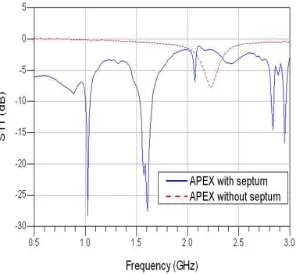
As the chamber was designed to operate from 500 MHz to 18 GHz, the return loss for this range was done, as can be seen in Fig. 6. Comparing the simulated results for the APEX with and without septum, it can be observed the clear importance of the septum. Without septum (dash line) the return loss is almost zero along all the frequency range. The Figs. 7 and 8 show the normalized electric field distribution on the body the GTEM with and without the septum.
Figure 6. S11 parameter: Comparison between Apex with and without septum – Simulated Results.
Figure 7. Normalized electric field distribution - GTEM cell with septum.
Figure 8. Normalized electric field distribution - GTEM cell without sep-tum.
tolerance, as can be seen in Fig. 9. The built APEX is shown in Fig. 10.
Figure 9. Mini septum – RF current termination with SMA resistors.
Figure 10. The built APEX.
The measurements were done through the HP 8714ET RF Network Analyzer. Due to frequency range limitation, the return loss calculation was done from 0.5 GHz – 3 GHz.
Figure 11. S11 parameter: Comparison between Apex with and without septum – Experimental results.
Comparing the obtained results for the APEX with and without septum, it can be observed the clear importance of the septum. Without septum (dot line) the return loss is almost zero along all the frequency range, which impairs the performance of the chamber.
To improve the performance of the septum and at the same time assure a high efficiency of the GTEM chamber, giving flexibility at a certain frequency, the metamaterial
technology was employed to build artificial magnetic and electric conductors. In view the complexity of implement the metamaterial along the full chamber, the main analysis is carried out on the APEX. Next section presents the basic concepts of metamaterial.
3. Metamaterial Technology
The concept of artificial material, which defines the me-tamaterial technology, was synthesized by Rodger M. Walser, in 1999 on his work about macroscopic composites with synthetic and periodic cellular architecture. However, the first attempt to explore the concept of “artificial” mate-rials was in 1898 with Jagadis Chunder Bose by his expe-riment about twisted structures [10]. Later, in 1914, the work about artificial chiral media was done by [11]. After these, in the past 20 years, the interest on metamaterial technology had strong increased, with researches on superlens and tel-ecommunication environment, including transmission line and antenna applications [12, 13].
Actually, metamaterial is a macroscopic composite of periodic or non-periodic structure, whose function is due to both the cellular architecture and the chemical composition [14]. Therefore, the behavior of a material, in the presence of an electric field, is determined by the macroscopic parame-ters, permittivity ε and permeability µ.
In this context, to improve the GTEM performance in terms of resonance frequency, metamaterial patterns were applied on the septum. The basic cells consist of a ring re-sonator – RR (Ring Rere-sonator) or CLL (Capacitively Loaded Loop) in SRR (Split Ring resonator) or CSRR (Complementary Split Ring Resonator), fractal cells and Jerusalem-Cross-Pair topologies. Furthermore, periodic structures such as Ring Slot Resonators can be considered as reconfigurable antennas when properly loaded [15].
Note that, when the cell pattern is applied to metal or metallic surfaces, the cells are not additives as they are on dielectric materials, they are, on the contrary, punched and became hollow structures. Therefore, the behavior of a ma-terial, in the presence of an electric field, is determined by the macroscopic parameters, permittivity ε and permeability µ. In Fig. 12 is shown the material classification based on its constitutive parameters.
3.1. Fractal Cells
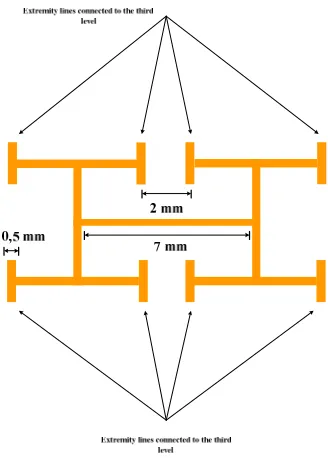
The construction of photonic metamaterial patterns [14] to incorporate on the GTEM septum was done through 4-level H-fractal structures, which are sometimes called a space-filling curve. The (k+1)th level structure contains 2k lines, with midpoint of each perpendicularly connected to the ends of the kth level lines. The fractal pattern is generated by a master line, or the first level of the structure. The mul-tiband functionality and subwavelength effect are the two most important features of this H-shaped fractal. The sub-wavelength property allows the total size of the system to be much smaller than the wavelength along all directions at resonance, which indicates that the structures can act as a very compact reflector.
This metamaterial with H-shaped cell resembles the FSS – Frequency Selective Surfaces structures. However its calculation is most straightforward. In Fig. 10 is shown the fractal structures introduced on the septum in order to create a best resonance in 10 GHz. In general, the initial cell di-mensions are not easily obtained from complex analytical works such as contained in [15].
In Fig. 12 is shown the return loss analysis of the septum with fractal cells printed on. Although some resonance peaks appears kind of attenuated, it can be easily observed the presence of a resonance peaks around 10 GHz, satisfying the target of this study.
3.2. JCP Structure
In order to obtain additional information about the septum behavior in the presence of another known structure in the literature, the Jerusalem-Cross-Pair (JCP) cell was applied. Basically, this structure is composed of a double periodical arrangement of pairs of face coupled Jerusalem crosses [17]. Owing to its unit cell symmetry, this cell provides an iso-tropic response to any linearly polarized incident wave. In Fig. 13 is shown the Jerusalem-Cross-Pair structures printed on the septum. The cells dimensions adopted here are based on the consideration and assumptions treated in [18].
Figure 13. 4th level H-Fractal shaped.
The behavior of the Jerusalem-Cross-Pair structures printed on the septum were analyzed. However, from the obtained results showed in Fig. 14, the presence of the JCP causes minor influence on the device behavior in terms of the resonance frequency. Nevertheless, this topology should not be discarded, so that different arrangements and com-binations with others metamaterial structures could provide satisfactory responses. Moreover, Jerusalem Cross-pair cell when applied to other microwave devices, such as planar antennas, presented sensible shifts on the resonant frequency and bandwidth.
Fig. 14. S11-parameter comparison between septum with and without fractal structures.
3.3. CLL Structure
wave direction, improving the electric and the magnetic field.
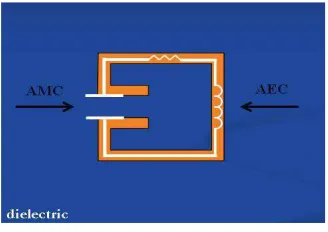
The artificial magnetic conductor is obtained when the plane wave is incident upon the capacitive gaps, and act as an artificial electric conductor when the plane wave is in-cident from the opposite direction. This behavior can be seen in Fig. 1 (a).
Basically, the metamaterial CLL patterning was printed on the septum in order to act as artificial magnetic conductor. The designed structure is shown in Fig. 15.
Fig. 15. Jerusalem-Cross-Pair cells printed on the septum.
As the model applied on the septum was adapted from the Fig. 15, where metallic cells are deposited on a dielectric substrate, the AMC position was choose. So, instead of metallic cells, the septum is filled with hollow CLL struc-tures. The relationship between the arrays of capacitors is shown in Fig. 16.
Fig. 16. S11-parameter comparison between septum with and without Jerusalem-Cross-Pair structures, without significant changes.
The behavior of the CLL structures printed on the septum has been investigated. From the dimensions of the meta-material cells (3 mm x 3 mm), it was expected a shift on frequency near to 10 GHz. Due to losses on the implemented connector, and the lack of a current termination, the reson-ance frequency is around 11 GHz, as can be seen in Fig. 17. As a rule of thumb, the cells are arranged in such way that the period (distance between cells) can be set as two or three cells dimensions. In this paper, two cells distance were set. The dimensions of the metamaterial cells are given by [20] where the length L of the cell is tenth of the wavelength.
Fig. 17. CLL metamaterial structure.
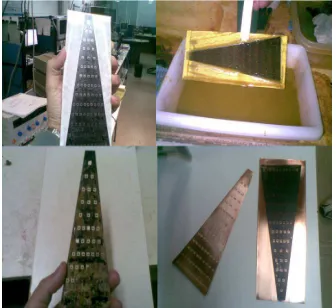
The experimental analysis of return loss was done through the HP 8714ET RF Network Analyzer. To print the CLL cells on the cooper foil the etching process was used. In Fig.18 is shown the fabricated structure.
Fig. 18. Capacitors array arranged by CLL metamaterial structures.
In Fig. 19 is shown a preliminary experimental result which compares the septum with and without the CLL structures. In this first analysis, the measurement was done without an appropriate current termination. With this con-sideration, the influence of the CLL structures becomes clearer.
Fig. 20. Septum fabrication on a cooper foil under etching and finished.
Fig. 21. S11-parameter measurement: comparison between septum with and without CLL structures.
4. EMC Test
The use of GTEM cells for emission test consists in the evaluation of the power magnitude that propagates on the TEM mode from the DUT, although the correct position of this power is unknown. Because it is a qualitative analysis, the study is done from the signal level along the frequency range. In this analysis, a spectrum analyzer is connected to the APEX of the chamber, so all the radiated signal emitted from the DUT can be monitored, Fig. 22. The device under test can be wireless or not, so that the power supply and control cables are connected to the DUT through a special shielded via with high frequency filters. As the GTEM works as a transmitter and a sensor, the use of antennas is not needed to measure the field strength from the DUT, which are captured by the septum. Therefore, the good accuracy is guarantee when the physical dimensions of the DUT are in accordance with the dimensions of the GTEM’s test area.
The results of EMI obtained from the GTEM chamber can be easily correlated to the others pre-compliance setup tests. The correlation with a TEM cell, with the same test area, can be done trough the following expression:
, 2 1
,1 2
( ) ( ) o u t
o u t
V f h
V f h
δ = = (2)
Where Vout,1( f ) is the voltage spectrum measured at the
GTEM cell, with height h1 from the bottom to the septum,
and Vout,2( f ) the voltage spectrum measured at the TEM cell,
with height h2 from the bottom to the septum. The emission level shift between these two setups is given by:
1
,2 ,1
2
( ) | ( ) | 20 log
out dB V out dB V
h
V f V f
h
µ µ
= +
(3)
The correlation with the other setups like OATS – Open Area Test Site, Stirring Chamber e Anechoic is not straightforward, which demands the use of specific software.
Figure 22. Setup configuration with GTEM chamber for EMI compliance test.
The susceptibility tests are basically measurements that identify the DUT propensity to be interfered by radiation from other devices at the same environment, thus verifying the immunity of the device under test.
By definition, immunity is a relative measurement of a device capability to operate in the presence of interfering electromagnetic fields [6].
The EMS test is accomplished with a pulse generator coupled to the APEX of the GTEM, and the DUT allocated at the test area, where it will be exposed to a spherical elec-tromagnetic field. Therefore, the performance of the DUT is monitored in function of the input power.
Due the aperture angle around 20º, the incident waves are slightly spherical, exposing the DUT to an almost planar wave. Thus, the comparison between the results for EMS tests obtained by the GTEM chamber with other compliance setups can be feasibly.
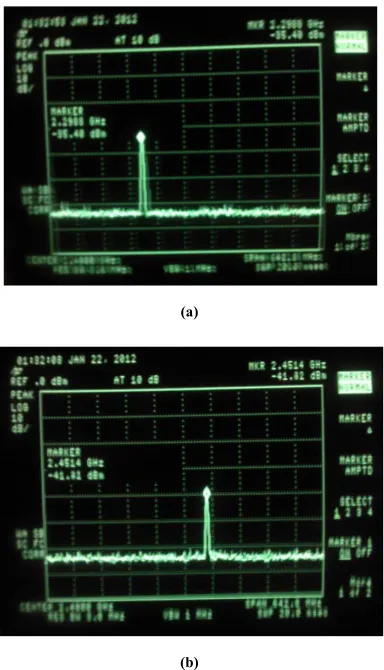
The EMI and EMS test were done with a HP 8714ET Network Analyzer. For the interference test, a quasi-yagi antenna was connected to the NA and then allocated inside the test area. The signal was monitored by a HP 8593E Spectrum Analyzer, connected to the APEX, and the tests were performed at the frequencies 0.5 GHz to 3 GHz. In Fig.23 is shown the pulse identification at the frequencies 2.29 GHz and 2.45 GHz. On the other hand, for the EMS test the NA was connected to the APEX and an electric probe was placed at the test area. The pulses were also generated from 0.5 GHz to 3 GHz. In Fig. 24 is shown the pulse iden-tification at the frequencies 1 GHz and 2 GHz. The EMI/EMS measurements are synthesized by Fig. 25.
0
.7 0.9 1.1 1.3 1.5 1.7 1.9 2.1 2.3 2.5 2.7 2.9
0
.5 3.0
-25 -20 -15 -10 -5 -30 0 Frequency (GHz) S 1 1 ( d B ) Septum
(a)
(b)
Figure 23. (a) EMI test – Pulse identification at 2.29 GHz ; (b) EMI test – Pulse identification at 2.45 GHz.
(a)
(b)
Figure 24. (a) EMS test – Pulse identification at 1 GHz; (b) EMS test – Pulse identification at 2 GHz.
Figure 25. EMI/EMS tests with the laboratory grade GTEM chamber.
5. Conclusions
Simple design guidelines for GTEM chamber were pre-sented. The metamaterial concepts applied to the septum add flexibility for the designer to tune the chamber in a specific and pre-calculated frequency range. With this goal, it is possible circumvent problems related to the limited size of the chamber.
Based on the obtained results, the CLL pattern besides the fractal one, appear as a feasible possibility, considering that all cells were designed to give a better response in 10 GHz. However, although the Jerusalem-Cross-Pair structures did not show relevant results for this special application, the combination of this structure with another one, could pro-vide satisfactory responses.
References
[1] Electromagnetic Compatibility (EMC) – Part 4: Testing and Measurement Techniques – Section 3: Radiated, Ra-dio-Frequency, Electromagnetic Field Immunity Test, Inter-national Standard CEI/IEC 1000-4-3, Geneva, Feb. 1995.
[2] M. I. Montrose, E. M. Nakauchi, “Testing for EMC Com-pliance,” IEEE Electromagnetic Compatibility Society, Sponsor, 2004.
[3] Dhia, S. B. M. Ramdani, E. Sicard, “Electromagnetic Com-patibility of Integrated Circuits,” Techniques for Low Emis-sion and Susceptibility, Springer, 2006.
[4] L. Carbonini, “A New Transmission Line Device With Double-Polarization Capability for use in Radiated EMC Tests,” IEEE Trans. on Electromagnetic Compatibility, vol. 43, pp. 326–339 Aug. 2001.
[5] D. Konigstein, D. Hansen, “A New Family of TEM-cells with Enlarged Bandwidth and Optimized Working Volume,” Proceedings of the 7th International Zurich Symposium on Electromagnetic Compatibility, pages 127-130, Zurich, March, 1987.
[6] H. X. Araujo, L. C. Kretly, “An EM Simulation and Design a GTEM Chamber for EMC Pre-Compliance Tests on Elec-tronic Board and ICs in 500 MHz – 18 GHz Range”, Momag 2010, Vila Velha, Brazil, August, 2010.
[7] C. Icheln, “The Construction and Application of a GTEM Cell”, Master’s Thesis, Hamburg - Germany, 1995.
[8] O. V. Mikheev, S. A. Podosenov, K. Y. Sakharov, A. A. So-kolov and V. A. Turkin “Approximate Calculation Methods for Pulse Radiation of a TEM-Horn Array,” IEEE Trans. on Electromagnetic Compatibility, vol. 43, pp. 67–74 Feb. 2001.
[9] X. T. I. Ngu, A. Nothofer, D. W. P. Thomas and C. Christo-poulos, “A Complete Model for Simulating Magnitude and Phase of Emissions from a Dut Placed Inside a GTEM Cell,” IEEE Trans. on Electromagnetic Compatibility, vol. 49, pp. 285–2930 May 2007.
[10] J. C. Bose, “On the rotation of plane of polarization of elec-tric waves by a twisted structure,” Proc. Roy. Soc., vol. 63, pp. 146-152, 1898.
[11] I. V. Lindell, A. H. Sihvola and J. Kurkijarvi, “Karl F. Lindman: The last Hertzian, and a Harbinger of electro-magnetic chirality,” IEEE Antennas Propag. Mag., vol. 34, n. 3, pp. 24-30, 1992.
[12] E. Yamashita, K. Atsuki, Strip Line with Rectangular outer conductor and three dielectric layers, IEEE Transactions on Microwave Theory and Techniques, vol.18, n.5, may 1970.
[13] D. L. Sounas, N. V Kantartziz and T. D. Tsiboukis “Focusing Efficiency Analisys and Performance Optimization of Arbi-trarily Sized DNG Metamaterial Slabs With Losses,” IEEE Trans. on Microwave Theory and Techniques, vol. 54, pp. 4111–4121 Dec. 2006.
[14] T. J. Cui, “Electromagnetic Metamaterials: Recent advances on the theory, experiments, and applications,” IEEE Anten-nas Propag. Mag., 2008.
[15] A. E. Martynyuk, J. I. M. Lopez, N. A. Martynyuk, "Spira-phase-Type Reflectarrays Based on Loaded Ring Slot Re-sonators", IEEE Transactions on Antennas and Propag., Vol. 52, pp.142-153, 2004.
[16] T. J. Cui, D. V. Smith and R. Liu, Metamaterials:Theory, Design and Applications, Springer, New York, 2010.
[17] F. Capolino, Metamaterials Handbook: Applications of Me-tamaterials, CRC Press, 2009.
[18] F. Capolino (editor), Metamaterials Handbook: Theory and Phenomena of Metamaterials, CRC Press, 2009.
[19] A. Erentok, P. Luljak and R. W. Ziolkowski (editors), “An-tenna performance near a volumetric metamaterial realiza-tion of an artificial magnetic conductor,” IEEE Trans. An-tennas Propagat., Vol. 53, 160–172,2005.