INTERNATIONAL JOURNAL OF PHARMACEUTICAL, CHEMICAL AND BIOLOGICAL SCIENCES
Available online at
www.ijpcbs.com
APPLICATION OF DOE FOR OPTIMISATION AND EVALUATION
OF IMMEDIATE RELEASE TABLET OF LIPID LOWERING AGENT
Rahul Raut
1*and Narayanaswamy VB
21Department of Pharmaceutical sciences, JJT University, Jhunijunu, Rajasthan, India. 2Department of Pharmacognosy, Karavali College of Pharmacy,
Mangalore-575028, Karnataka, India.
INTRODUCTION
Design of experiments (DOE) may be a structured and arranged technique to work out the relationship among factors that influence outputs of a method. once DOE is applied to pharmaceutical method, factors square measure the material attributes (e.g., particle size) and method parameters (e.g., speed and time), whereas outputs square measure the vital quality attributes like mix uniformity, pill hardness, thickness, and breakableness. As every unit operation has several input and output variables also as method parameters, it's not possible to through an experiment investigate all of them. Scientists got to use previous data and risk management to spot key input and output variables and method parameters to be investigated by DOE. DOE results will facilitate determine optimum conditions, the vital factors that almost all influence CQAs and people that don't, also as details like such as On the appropriate vary of CQAs, the planning area of CPPs is determined. When considering scale-up, however, further experimental work is also needed to verify that the model generated at the little scale is prophetical at the massive scale. This can be as a result of some important method parameters ar scale dependent whereas others don't. The operational vary of scale dependent important method parameters can got to modification attributable to scale-up. Previous
Research Article
ABSTRACT
Aim of the study is to stabilize oral formulation of Atorvastatin calcium tablet. amorphous form of atorvastatin calcium is used for this study because crystalline form is used by innovator which is patent protected upto year 2017. Stabilization is required because Atorvastatin calcium is susceptible to degradation in presence of acidic environment, moisture, heat and light and to evaluate different process parameters. As it has long half life (14 hours), it is not suitable candidate for controlled release formulation. Tablet dosage form is preferable because other than tablet dosage form not having good shelf life in case of Atorvastatin due to its degradation, which imparts the impurity in formulation. Preformulation study and drug excipient compatibility study was done initially and the results obtained directed the way to method of formulation. Atorvastatin calcium (Amorphous) is highly susceptible to heat and it has very poor flow property so dry granulation and direct compression method was avoided. Factorial design was used for the understanding of possible interaction amongst the excipients as sodium carbonate, polysorbate 80 and croscarmellose sodium. Results shown that there is no significant interaction between these factors. In vitro dissolutions were performed and F1 and F2 values were calculated. Dissolution profile of final trial batch was matched perfectly with innovator and F2 value was found to be excellent. Also the impurity profile and stability result of final trial batch was found to be excellent.
technologies and excipients on an everyday basis. Pharmaceutical scientists will usually make the most of past expertise to outline important material properties, process parameters and their operational ranges 1-4.
The best new therapeutic entity in the world is of little value without an appropriate delivery system. Tableted drug delivery systems can range from relatively simple immediate-release formulations to complex extended or modified-release dosage forms. The most important role of a drug delivery system is to get the drug "delivered" to the site of action in sufficient amount and at the appropriate rate; however, it must also meet a number of other essential criteria. These include physical and chemical stability, ability to be economically mass produced in a manner that assures the proper amount of drug in each and every dosage unit and in each batch produced, and, as far as possible, patient acceptability (for example, reasonable size and shape, taste, color, etc., to encourage patients to take the drug and thus comply with the prescribed dosing regimen).5
MATERIALS AND METHODS6-10
MATERIALS
Atorvastain Calcium were obtained from Alkem Research centre, India as gift samples. All the other excipients, solvents, reagents and chemicals used were of either Pharamcopoeial or analytical grade.
Preformulation testing is the first step in the development of dosage forms of a drug substance. It can be defined as an investigation of physical and chemical properties of a drug substance alone and when combined with excipients.
The overall objective of Preformulation studies is to generate information useful to the formulator in developing stable and bioavailable dosage forms, which can be mass-produce.
Preformulation study can divided into two sub-class.
Compatibility study
The compatibility of drug and formulation components is important prerequisite before formulation. It is therefore necessary to confirm that the drug does not react with the polymers and excipients under experimental conditions and affect the shelf life of product or any other unwanted effects on the formulation.
Active pharmaceutical ingredient (API) characterization Organoleptic evaluation
These are preliminary characteristics of any substance, which is useful in identification of specific material. Physical properties of API like Color, Taste, odour.
Loss on drying
0.5g of sample of Atorvastatin calcium was accurately weighed and the powder was kept in a Mettler Toledo apparatus for 5 min. at 105ºC and the moisture content was calculated.
Solubility Analysis
Table 1: Formula of Atorvastatin calcium Tablets of trials 1 to 5
Table 2: Formula of Atorvastatin calcium Tablets of trials 5 to 10
Optimization using 23 factorial design
Sr. No. Ingredients Trial No.
1 2 3 4 5
Intragranular
1 Atorvastatin Calcium 80 80 80 80 80
2 Sodium hydroxide 6 -- -- -- --
3 Magnesium hydroxide -- 25 -- -- --
4 Calcium hydroxide -- -- 35 -- --
5 Sodium carbonate -- -- -- 30 30
6 Microcrystalline Cellulose 250 250 250 250 250
7 Lactose 309 300 285 290 290
8 Croscarmellose sodium 50 50 50 50 --
9 Sodium starch glycolate -- -- -- -- 50
10 Crospovidone XL-10 -- -- -- -- --
11 Hydroxypropyl Cellulose 40 30 30 30 30
12 Polysorbate 80 -- -- 5 5 5
13 SLS -- 5 -- -- --
14 Purified Water q.s. q.s. q.s. q.s. q.s.
Extragranular
15 MCC 250 250 250 250 250
17 Aerosil 5 5 5 5 5
18 Magnesium Stearate -- 5 10 10 10
19 Sodium stearyl fumarate 5 -- -- -- --
Tablet Weight (mg) 1000 1000 1000 1000 1000
20 Opadry YS-1-7040 30 30 30 30 30
21 Purified water q.s. q.s. q.s. q.s. q.s.
Tablet Weight (mg) 1030 1030 1030 1030 1030
Sr. No. Ingredients Trial No.
6 7 8 9 10
Intragranular
1 Atorvastatin Calcium 80 80 80 80 80
2 Sodium hydroxide -- -- -- -- --
3 Magnesium hydroxide -- -- -- -- --
4 Calcium hydroxide -- -- -- -- --
5 Sodium carbonate 30 30 20 30 30
6 Microcrystalline Cellulose 250 250 250 250 250
7 Lactose 290 285 290 280 320
8 Croscarmellose sodium -- 50 50 50 20
9 Sodium starch glycolate -- -- -- -- --
10 Crospovidone XL-10 50 -- -- -- --
11 Hydroxypropyl Cellulose 30 30 30 40 30
12 Polysorbate 80 5 10 5 5 5
13 SLS -- -- -- -- --
14 Purified Water q.s. q.s. q.s. q.s. q.s.
Extragranular
15 MCC 250 250 250 250 250
16 Aerosil 5 5 5 5 5
17 Magnesium Stearate 10 10 10 10 10
18 Sodium stearyl fumarate -- -- -- -- --
Tablet Weight (mg) 1000 1000 1000 1000 1000
20 Opadry YS-1-7040 30 30 30 30 30
21 Purified water q.s. q.s. q.s. q.s. q.s.
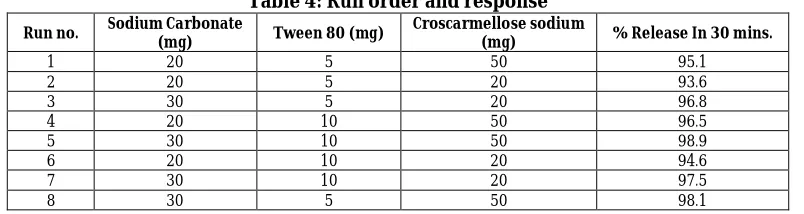
Table 4: Run order and response
Run no. Sodium Carbonate
(mg) Tween 80 (mg)
Croscarmellose sodium
(mg) % Release In 30 mins.
1 20 5 50 95.1
2 20 5 20 93.6
3 30 5 20 96.8
4 20 10 50 96.5
5 30 10 50 98.9
6 20 10 20 94.6
7 30 10 20 97.5
8 30 5 50 98.1
Table 5: Composition of Factorial batches F1 to F 10
Sr. no. Ingredients F1 F2 F3 F4 F5 F6 F7 F8 Intragranular
1 Atorvastatin calcium 80 80 80 80 80 80 80 80
2 Sodium carbonate 20 20 30 20 30 20 30 30
3 Polysorbate 80 5 5 5 10 10 10 10 5
4 Croscarmellose sodium 50 20 20 50 50 20 20 50
5 Microcrystalline cellulose 250 250 250 250 250 250 250 250
6 Lactose Monohydrate 300 330 320 295 285 325 315 290
7 Hydroxy propyl cellulose 30 30 30 30 30 30 30 30
8 Water q.s. q.s. q.s. q.s. q.s. q.s. q.s. q.s.
Extragranular
9 Microcrystalline cellulose 250 250 250 250 250 250 250 250
10 Colloidal silicon dioxide 5 5 5 5 5 5 5 5
11 Magnesium stearate 10 10 10 10 10 10 10 10
Total 1000 1000 1000 1000 1000 1000 1000 1000
Coating
12 Opadry YS-1-7040 30 30 30 30 30 30 30 30
13 Purified water q.s. q.s. q.s. q.s. q.s. q.s. q.s. q.s.
Total 1030 1030 1030 1030 1030 1030 1030 1030
In-vitro dissolution test
Dissolution study of tablet performed in USP II (paddle) dissolution test apparatus (Electrolab TDT O8L) using 900ml of water as a dissolution media. The tablet was loaded into an each basket of dissolution apparatus; the temperature of dissolution media was maintained at 37±0.5C with stirring speed of 75 rpm through out the study. Aliquots of dissolution media containing 5 ml of samples were withdrawn at time interval of 5, 10, 15, 30 minutes.
Exposure Study
Exposure study was done for finding the degradation pathways of drug formulation by exposing formulation to stress conditions like 80°C temperature for 2 days & in Autoclave for 15 min. at 121°C after these tests formulation was compared with Innovator formulation which was also kept in same conditions. If any measurable difference seen then that formulation was rejected otherwise selected.
Stability Study
Stability study was done by exposing the formulation to different conditions including stress conditions of temperature & pressure. Generally stability study was done at 40°C/75%RH (for 15 days, 1, 2 and 3 months), After that study was over formulation was checked for its physical & chemical parameters, if all parameters were present within the specification limit then that formulation was selected.
EXPERIMENTAL OBSERVATIONS
Table 6: pH Dependant Solubility Study of API (Atorvastatin Calcium)
Table 7: Sieve Analysis of API (Atorvastatin Calcium)
Sieve No. Used Pore Size in µm % Retained Cumulative % Retained
20 850 1 1
30 600 4.94 5.94
60 250 29 34.94
80 180 36.56 71.5
100 150 0.5 72
BASE NA 28 100
Table 8: Powder Flow Characterization of API (Atorvastatin Calcium)
Parameters Observations
Angle of Repose 46.960°
Bulk Density 0.279 gm/ml
Tapped Density 0.383 gm/ml
Hauser’s ratio 1.37
Compressibility Index 27.15%
LOD -4.258%
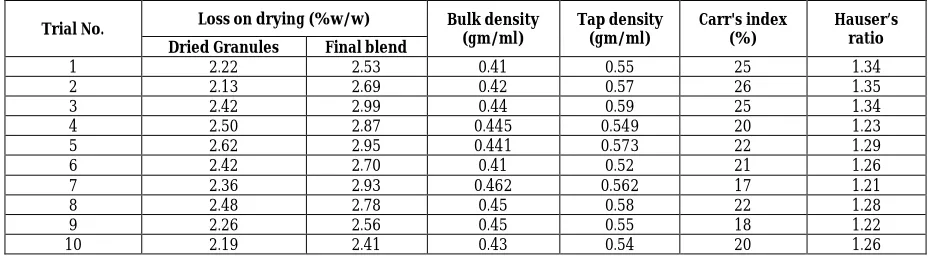
Table 9: Pre Compression Parameters of preliminary Trials 1 to 10
Medium Solubility (mg/ml) Solubility (mg/ 250 ml)
pH 1.2 Buffer 0.016 4
pH 2.1 Buffer 1.05 262.5
pH 4.5 Buffer 0.048 12
pH 5.5 Buffer 0.367 91.75
pH 6.8 Buffer 1.245 311.25
pH 7.5 Buffer 0.996 249
0.1 N HCl 0.004 1
Water 0.368 92
Trial No. Loss on drying (%w/w) Bulk density (gm/ml)
Tap density (gm/ml)
Carr's index (%)
Hauser’s ratio Dried Granules Final blend
1 2.22 2.53 0.41 0.55 25 1.34
2 2.13 2.69 0.42 0.57 26 1.35
3 2.42 2.99 0.44 0.59 25 1.34
4 2.50 2.87 0.445 0.549 20 1.23
5 2.62 2.95 0.441 0.573 22 1.29
6 2.42 2.70 0.41 0.52 21 1.26
7 2.36 2.93 0.462 0.562 17 1.21
8 2.48 2.78 0.45 0.58 22 1.28
9 2.26 2.56 0.45 0.55 18 1.22
Table 10: Post Compression Parameters of Trials 1 to 10 (Core Tablets)
Table 11: Post Compression Parameters of Trials 1 to 10 (Coated Tablets )
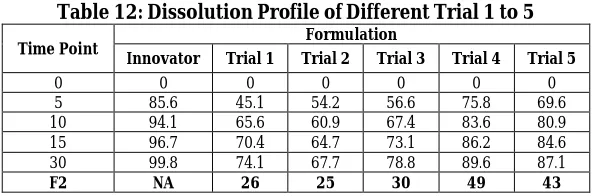
Table 12: Dissolution Profile of Different Trial 1 to 5
Time Point Formulation
Innovator Trial 1 Trial 2 Trial 3 Trial 4 Trial 5
0 0 0 0 0 0 0
5 85.6 45.1 54.2 56.6 75.8 69.6
10 94.1 65.6 60.9 67.4 83.6 80.9
15 96.7 70.4 64.7 73.1 86.2 84.6
30 99.8 74.1 67.7 78.8 89.6 87.1
F2 NA 26 25 30 49 43
Trial No. Average wt.(mg) Thickness (mm) Hardness (N) Disintegration time(min.) Friability (% w/w)
1 990- 1010 6.10- 6.20 210-220 3-4 0.12
2 990- 1010 6.10- 6.20 212-225 2-3 0.134
3 990- 1010 6.10- 6.20 213-227 2-3 0.149
4 990- 1010 6.10- 6.20 200-219 2-3 0.138
5 990- 1010 6.10- 6.20 205-220 3-4 0.09
6 990- 1010 6.10- 6.20 202-224 3-4 0.18
7 990- 1010 6.10- 6.20 202-226 2-3 0.11
8 990- 1010 6.10- 6.20 206-227 3-4 0.15
9 990- 1010 6.10- 6.20 205-229 4-5 0.12
10 990- 1010 6.10- 6.20 200-225 9-10 0.19
Trial No. Average wt.(mg) Thickness (mm) Hardness (N) Disintegration time(min.)
1 1028-1036 6.30- 6.50 230-245 4-5
2 1029-1035 6.29- 6.47 225-236 3-4
3 1029-1034 6.26- 6.45 241-250 3-4
4 1026-1033 6.30- 6.49 241-254 3-4
5 1028-1035 6.29- 6.48 235-245 4-5
6 1028-1036 6.28- 6.46 231-239 4-5
7 1030-1035 6.33- 6.47 240-254 2-3
8 1027-1033 6.36- 6.45 241-256 5-6
9 1026-1035 6.25- 6.42 240-246 6-7
Fig. 1: Dissolution Profile of Different Trial 1 to 5 with innovator
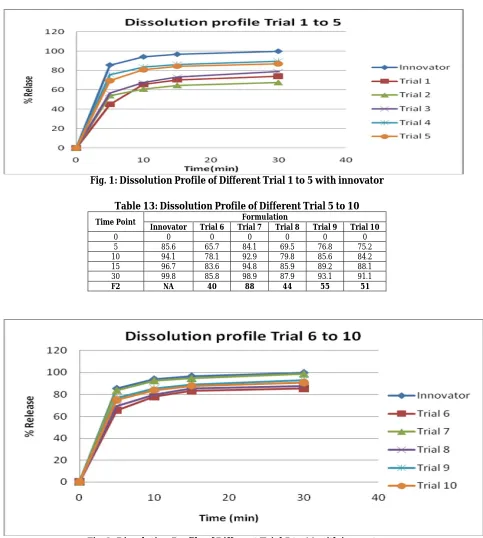
Table 13: Dissolution Profile of Different Trial 5 to 10
Time Point Formulation
Innovator Trial 6 Trial 7 Trial 8 Trial 9 Trial 10
0 0 0 0 0 0 0
5 85.6 65.7 84.1 69.5 76.8 75.2
10 94.1 78.1 92.9 79.8 85.6 84.2
15 96.7 83.6 94.8 85.9 89.2 88.1
30 99.8 85.8 98.9 87.9 93.1 91.1
F2 NA 40 88 44 55 51
Table 14: Pre Compression Parameters of Factorial Trials F1 to F8
Table 15: Post Compression Parameters of Factorial Trials F1 to F8 of Core Tablets
Table 16: Post Compression Parameters of Factorial Trials F1 to F8 of Coated Tablets
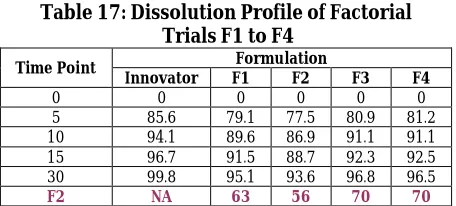
Table 17: Dissolution Profile of Factorial Trials F1 to F4
Time Point Formulation
Innovator F1 F2 F3 F4
0 0 0 0 0 0
5 85.6 79.1 77.5 80.9 81.2
10 94.1 89.6 86.9 91.1 91.1
15 96.7 91.5 88.7 92.3 92.5
30 99.8 95.1 93.6 96.8 96.5
F2 NA 63 56 70 70
Trial No. Loss on drying (%w/w) Bulk density (gm/ml)
Tap density
(gm/ml) Carr's index (%) Hausner’s ratio Dried Granules Final blend
F1 2.29 2.45 0.45 0.575 23 1.28
F2 2.33 2.50 0.44 0.55 20 1.25
F3 2.45 2.65 0.45 0.58 22 1.29
F4 2.41 2.68 0.435 0.541 20 1.24
F5 2.52 2.59 0.465 0.564 18 1.21
F6 2.26 2.39 0.44 0.57 23 1.30
F7 2.42 2.59 0.46 0.567 21 1.23
F8 2.63 2.78 0.45 0.57 21 1.27
Trial No. Average wt.(mg) Thickness (mm) Hardness (N) Disintegration time(min.)
Friability (% w/w)
F2 990- 1010 6.10- 6.20 210-224 5-6 0.104
F3 990- 1010 6.10- 6.20 210-230 5-6 0.159
F4 990- 1010 6.10- 6.20 205-215 2-3 0.168
F5 990- 1010 6.10- 6.20 215-230 2-3 0.08
F6 990- 1010 6.10- 6.20 212-229 2-3 0.154
F7 990- 1010 6.10- 6.20 210-225 2-3 0.103
F8 990- 1010 6.10- 6.20 205-225 5-6 0.128
Trial No. Average wt.(mg) Thickness (mm) Hardness (N) Disintegration time(min.)
F2 1030-1034 6.30- 6.44 223-239 6-7
F3 1028-1033 6.30- 650 235-254 6-7
F4 1027-1031 6.25- 6.47 241-254 3-4
F5 1027-1032 6.30- 6.49 230-246 3-4
F6 1027-1034 6.30- 6.45 232-248 3-4
F7 1029-1034 6.33- 6.47 240-254 3-4
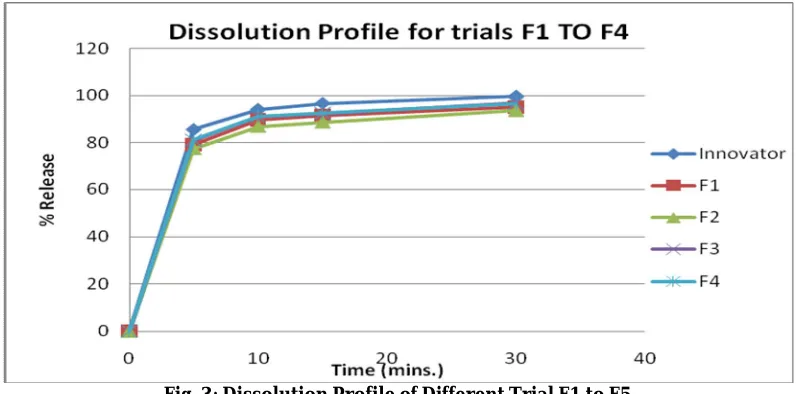
Fig. 3: Dissolution Profile of Different Trial F1 to F5
Table 18: Dissolution Profile of Factorial Trials F5 to F8
Time Point Formulation
Innovator F5 F6 F7 F8
0 0 0 0 0 0
5 85.6 84.6 78.5 82.1 84.6
10 94.1 94.5 89.5 92.4 91.5
15 96.7 96.5 89.9 95.5 95.8
30 99.8 98.9 94.6 97.5 98.1
F2 NA 96 61 80 85
Fig. 5: Comparative dissolution Profile of Innovator and Trial F5 to F8
Statistical Analysis
Analysis of data by design expert software
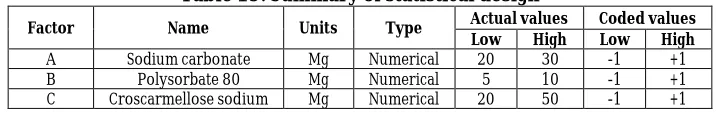
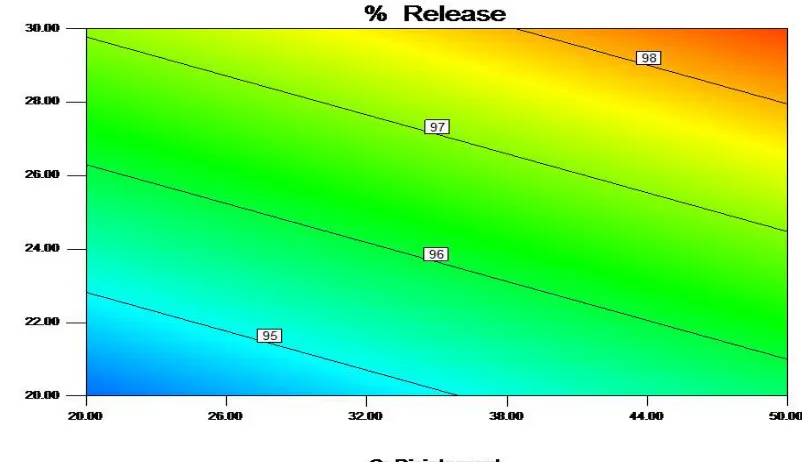
The 23 Fatorial design was applied to study the effects of formulation variables such as amount of sodium
carbonate, polysorbate 80 and croscarmellose sodium on the response factor as % Release in 30 mins.
Table 19: Summary of statistical design
Factor Name Units Type Actual values Coded values Low High Low High
A Sodium carbonate Mg Numerical 20 30 -1 +1
B Polysorbate 80 Mg Numerical 5 10 -1 +1
C Croscarmellose sodium Mg Numerical 20 50 -1 +1
Table 20: Summary for response
Response description observations Min Max Mean
Y1 % Release 8 93.6 98.9 96.39
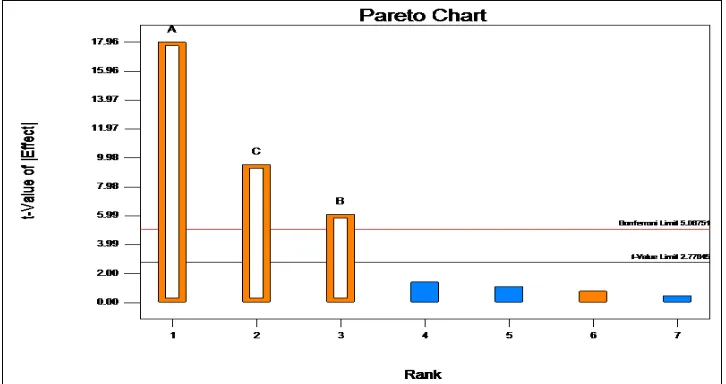
Fig. 6: Pareto chart showing factors significantly affecting the response
Fig. 8: 3D Graph showing the effect of formulation variables on % Release
Fig. 10: Cube data showing actual response of particular factorial trial
Table 21: Statistical analysis of % Release
Source Sum of Squares
Degrees of
Freedom Mean Square F Value P Value Significance
Model 23.08375 3 7.694583333 150.1382114 0.0001 Significant
A-Sodium carbonate 16.53125 1 16.53125 322.5609756 < 0.0001 Significant
B-Polysorbate 80 1.90125 1 1.90125 37.09756098 0.0037 Significant
C- Croscarmellose sodium 4.65125 1 4.65125 90.75609756 0.0007 Significant
Significant Residual 0.205 4 0.05125 150.1382114
C or Total 23.28875 7 322.5609756
The Model value of 150.14 implies the model is significant. There is only a 0.01% chance that a "Model F-Value" this large could occur due to noise.
Values of "Prob > F" less than 0.0500 indicate model terms are significant. In this case A, B, C are significant model terms.
Final equation in terms of coded factors % Release = 96.39+ 1.44A + 0.49B + 0.76C
Final equation in terms of actual factors % Release =
85.958 + 0.2875(Sodium carbonate) + 0.195(Polysorbate 80) + 0.0508(Croscarmellose sodium)
Storage condition Room Temperature 80ºC Autoclave Period Initial 2 Days (open) At 121ºC for 15 min Formulations Innovator Trial F5 Innovator Trial F5 Innovator Trial F5
Parameters Observations
Physical Appearance White White White White White White
Hardness (N) 264 N 242 290 258 Not Applicable
LOD (%) 7.48 7.54 6.10 6.22 12.27 12.97
D.T. (min.) 2-3 2-3 5-6 6-7 Not Applicable
Assay (%) 99.24 99.56 94.25 93.72 95.85 94.99
Dissolution (at 30 min.) 99.6 98.9 97 96 Not Applicable
Table 23: Stability Observations of Trials
Table 24: Worst Case Study of Final Formulation
Storage condition Room
Temperature 40ºC/75%RH
Specifications Period Initial 1 Month 2 Months 3 Months
Formulations Innov
ator Trial F5
Innov
ator Trial F5
Innov
ator Trial F5
Innov
ator Trial F5
Parameters Observations
Physical Appearance White White White White White White White White No change should
observed
Hardness (N) 264 242 268 244 269 246 269 255 NLT 240N
LOD (%) 7.48 7.54 7.52 7.57 7.43 7.57 7.52 7.36 NMT 8.0%
D.T. (min.) 2-3 2-3 2-3 2-3 2-3 2-3 2-3 2-3 NMT 15 min.
Impurities
Highest unknown Impurity (%)
0.03 0.12 0.038 0.13 0.04 0.13 0.04 0.14 NMT 0.2%
Total Impurity 0.93 1.63 0.94 1.65 1.02 1.70 1.09 1.70 NMT 3%
Assay (%) 99.24 100.7 101.8 100.72 100.12 101.36 99.25 101.32 95-105%
Dissolution
(at 30 min) 99.6 98.9 98.9 97.7 98.6 97.25 98.1 96.9
Table 25: Dry Mixing Challenge
Stage Parameter High Optimum Low Dry Mixing
Trial no. A B C
Batch Size (Tablets) 5000 5000 5000
RMG (capacity) 25.0 L 25.0 L 25.0 L
Mixing in RMG
Impeller Time 15 min 10 min 5 min
Impeller Speed 150rpm 150rpm 150rpm
Chopper Time NA NA NA
Environmental Conditions 25ºC/55%RH 25ºC/55%RH 25ºC/55%RH
Content Uniformity at Different Location (%)
Upper Left 97.5 98.2 90.4
Upper Right 100.6 99.3 92.8
Upper Middle 99.6 101.3 95.6
Middle Left 98.6 98.7 104.6
Middle Right 93.5 97.9 108.8
Middle 103.8 99.9 99.9
Lower Left 100.2 100.1 95.7
Lower Right 96.8 101.5 91.7
Lower Middle 99.9 98.2 104.1
Composite Sample 99.8 100.3 102.4
Table 26: Granulation Challenge
Parameters Parameter High Optimum Low Granulation
Trial no. A B C
Batch Size (tabs) 5000 5000 5000
RMG (capacity) 25.0 L 25.0 L 25.0 L
Granulation In RMG
Impeller Time 12 min 7min 3 min
Impeller Speed 150rpm 150rpm 150rpm
Chopper Time 10 min 5 min 3 min
Chopper Speed 2500rpm 2500rpm 2500rpm
Environmental Conditions 25ºC/55%RH 25ºC/55%RH 25ºC/55%RH
Micrometrics of lubricated granule
TD gm/ml 0.769 0.6 0.8
BD gm/ml 0.625 0.483 0.615
CI 18.73% 19.50% 23.13%
HR 1.23 1.24 1.3
LOD 3.24% 2.86% 2.99%
Sieve Analysis% Retained
20# 1.2 1.1 0.8
30# 1.1 8.5 6.21
40 # 19.25 3.5 7.5
60 # 30.3 12 8.5
80 # 6 3.5 13.06
100 # 6.75 26 3.37
BASE 34.7 45 60.56
Compression Parameters
Weight Variation -0.60% 3.70% 0.90%
Thickness 6.30-6.50mm 6.30-6.50mm 6.30-6.50mm
Hardness (N) 240-260N 240-255N 220-240N
Friability (100rtn’s) 0.14% 0.16% 0.10%
D.T (min.) 3-4min 2-3min 2-3min
DR Profile Innovator Vs Trial
F5(pH 6.8 phosphate buffer)
Minutes Innovator
5 85.6 72.9 83 95.9
10 94.1 80.01 91 97.01
15 96.7 87.25 95 98.8
30 99.8 94.3 98 99
Effect of Extent of Granulation on Drug Release 0 20 40 60 80 100 120
0 10 20 30 40
Tim e (m in)
D ru g R e le a s e (% ) Innovator High Optimum Low
Fig. 11: Effect or Extent Granulation on Drug Release.
Table 27: Compression Challenge
Parameter High Optimum Low
Trial no. A B C
Machine Speed 18 rpm 18 rpm 18 rpm
Environmental Conditions 25ºC/55%RH 25ºC/55%RH 25ºC/55%RH
Hardness (N) 300-350N 250-300N 200-300N
Appearance OK OK OK
Weight Variation -1.125% to +4.5% -1.625% to +4.0% -1.89 to +1.50%
Thickness (mm) 6.30-6.41mm 6.40-6.54mm 6.55-6.70mm
Friability (100rtn’s) 0.12% 0.10% 1.52%
DT (min) 5-6min 2-3min 1-2min
Dissolution Profile of All 3 Conditions
Time Point (Min)
Cumulative % Drug Release
Innovator High Optimum Low
5 85.6 60 83 85
10 94.1 74 88 92
15 96.7 87 94 98
30 99.8 95 99 100
F2 Value 38.25 81.02 89.52
Effe ct of Exte nt of Com pr e s s ion Challe nge on Dis s olution
0 20 40 60 80 100 120
0 10 20 30 40
Tim e (m in)
D ru g R e le a s e (% ) Innovator High Optimum Low
RESULT AND DISCUSSION Preformulation Study
The present investigation was carried out to develop and formulate stable oral solid dosage form of class II drug Atorvastatin Calcium. The dosage form was developed as tablet and the tablets were prepared by using different excipients along with stabilizer.
Compatibility Study
From the results obtained for Drug-excipients compatibility study, it was found that the Candidate Drug is compatible with the respective excipients under evaluation based on physical observation. So chosen excipients can be used in the formulation trials.
API Characterization Study pH Dependent Solubility Study
pH of Atorvastatin Calcium in 10% solution (water) found to slightly basic. The pH dependent solubility study carried out by wing of different pH buffer solutions ranging pH 1.2 (0.1 N HCl), pH 2.1 acid buffer, pH 4.5 acetate buffer, pH 5.5 acetate buffer and pH 6.8 phosphate buffer. Study shows solubility of Atorvastatin Calcium was more in pH 6.8 phosphate buffer i.e. 1.245 mg/ml. Therefore, pH 6.8 phosphate buffer was used as dissolution medium (It is also official in OGD).
Powder Flow Properties
The flow properties of pure drug were carried out and the results indicate that drug shows poor flow. So, it was decided to overcome this problem by converting them to granules which was done by wet granulation technique using appropriate binder to import good flow as well as compressibility.
Evaluation of Formulation Parameters Evaluation was divided in mainly
- Pre compression Parameters and - Post compression Parameters.
Pre Compression Parameters Loss on Drying (LOD)
LOD of dried granules maintained in the level by drying at 105°C and optimize drying time for achieve LOD in particular limit.
Powder Flow Characteristics
The decision of choosing wet granulation method for granulation and choosing optimum amount of lubricant has eliminated the flow problem of powder blend and the flow properties of the blend were found to be satisfactory. The respective values of
Bulk density in the range 0.41 – 0.467 gm/ml
Tapped density in the range 0.52-0.59 gm/ml,
Carr’s Index ranging 18-26 and
Hauser’s ratio in the range 1.21-1.35 show the good flow characteristics.
Sieve Analysis
Sieve Analysis by Mechanical shaker shows there was good blend of fines and granules which result in good flow and reduces weight variation problems.
Post Compression Parameters
Weight Variation
Thickness of tablets was observed by Vernier Caliper. The results obtained did not show any measurable deviation thickness of tablet.
Hardness Test
Hardness of the tablet was measured in ‘Newton’ unit in digital hardness tester. The hardness of tablets was found to be uniform within range 230-250 N for final trail.
Disintegration Test
Disintegration test was carried out in Electro lab (ED-2AL). Disintegration time for 6 tablets was found to be 2–3 min indicating that disintegration time within the specification limit.
Friability Test
The friability was carried out by using Roche Friabilator. The percentage friability of tablet was ranging 0.09% - 0.19% which was less than the standard limit of 1% indicates that the prepared tablets are mechanically stable.
Drug Content Uniformity
In each trials drug content was found to be ranging from 95% - 101.2% which is within the range of 93 – 105% for Atorvastatin. It indicates uniform distribution of drug in the tablets of each formulation.
In-Vitro Drug Release Studies
Atorvastatin Calcium tablets were subjected to in vitro drug release studies pH 6.8 Phosphate Buffer for 30min. The drug release studies carried out in USP Dissolution Test Apparatus II (Paddle) using 900 ml of dissolution medium, maintained at 37°C ± 0.5°C.
DISCUSSION
Above results showed that Bulk density of API is very less therefore, to improve the flow of granules wet granulation technique was tried in Trial1. Use of sodium hydroxide was done as alkalizer. This trial was carried out to check the feasibility.
Dissolution report of Trial 1 shows that, overall drug release is so much less. It was also found that, the disintegration time is more though it is within limit. It took time to disintegrate the tablet into granules and therefore to release drug.
The Trial 2 was taken by using the Magnesium hydroxide. The result shows that there is decrease in the drug release. But there is improvement in reduction of D.T.
In Trial 3, the use of calcium hydroxide to improve the drug release. The result shows that the drug release was slightly increased and not 100% at 30 min which may be due excess concentration of binder which was retarding the drug release.
Trial 4 was taken by adding Sodium carbonate. Drug release was increased upto an acceptable level. But still not 100 %.
Trial 5 was taken by using different disintegrant sodium starch glycolate. There was slight decrease in the drug release, and also DT was increase.
Trial 6 was taken by using crospovidone XL-10 as disintegrant and it was found that there is decrease in the DT but there was slight decrease in the drug release.
In Trial 7, Increase in the solubilizer concentration was done for the purpose of increasing drug release. The results shown the increase in drug release, decrease in DT, and also the blend properties were good.
Trial 8 was taken by decreasing the concentration of alkalizer but there was decrease in the drug release, flow properties were also slightly decreased.
Trial 9 was taken by increasing the concentration of binder it has shown the increase in DT slightly. And slight decrease in the drug release.
Trial 10 decrease in the disintegrant concentrantion caused the decreased in DT and drug release.
Factorial batches
All the factorial trials shown the good drug release but trial F5 was Found to be the best one because drug release was upto acceptable level,
sodium carbonate, polysorbate 80 and croscarmellose sodium which can affect the response factor. Also it was found that all three factors were showing the positive effect over the % drug release.
F2 Value
Similarity factor (F2) was calculated between innovator formulation and in-house formulation. Similarity factor value in the range of 50-100 indicates that there is Similarity in the release profile of the formulations. Among all Trials, Trial 7 shows highest F2 value 88 in pH 6.8 phosphate buffer, and Trial 9 and Trial 10 shown the F2 value as 55 and 51 resply
All the factorial trials were shown F2 Values within 50 to 100 which is good, but from that Trial F5 was showing the F2 value 96 which is very close to innovator.
Test for Related Substances
Test for related substances (degradation product and process related impurities) was carried out by HPLC method.
Individual impurity profile for trial F5 was established for initial and after 80°C for 2 days.
Exposure Study
Exposure studies were carried out of selected trial. In exposure study, in house formulation and innovator formulation was subjected to different environmental stress conditions like 80° for 2 days and in autoclave at 121°C for 15 min. The result shows similar behavior between our trial and innovator in different conditions.
Stability Study
The stability studies of final trial F5 was done for 3 months by packing in HDPE container in humidity chamber (40°C/75% RM)
The result given in table for 1 month, 2 months and 3 months shows that all parameters of formulation including physical parameters, impurity profile, content uniformity or dissolution profile were within specification limit. So it indicates optimized formulation is stable.
Worst Case Study
Worst case study for final formulation was performed to optimize the critical stages during the formulation process. In this case dry mixing, granulation and compression force were considered as critical stages which may cause problem if the set parameters vary.
Granulation Challenge
High granulation time shows slow initial release and is not satisfactory up to limit. Low granulation show some what faster release initially but matches with innovator drug release. So, high or low granulation may causes problem in formulation for our trial.
The optimized granulation time is said to be 7 min.
Compression Force Challenge
Compression force challenge study was carried out at three different compression forces. Their higher and lower extreme level was selected by considering good physical appearance at constant machine speed 18 rpm.
The dissolution profiles for optimum and low compression force were found to be satisfactory. But the higher compression force has retarded the initial drug release. Hence the calculated F2 value was less. Also the low compression force tablets were susceptible to friability. So, compression force does have effect on dissolution and strength of tablets. The optimized compression is said to be within the range of 250-300N.
In these different steps of formulation and development study of Atorvastatin tablet which were successfully accomplished and results were found satisfactory and Comparable with innovators formulation.
CONCLUSION
study, prototype formulation trials were started for the highest dose of Atorvastatin calcium (80 mg) and optimized to get the final formula. Atorvastatin calcium (Amorphous) is highly susceptible to heat and it has very poor flow property so dry granulation and direct compression method was avoided. Granules were evaluated for tests such as LOD, Bulk density, Tapped density, Compressibility index and Hausner ratio and sieve analysis before compression. tablets were tested for weight variation, thickness, hardness, friability, and dissolution. In vitro dissolutions were performed and F1 and F2 values were calculated. Dissolution profile of final trial batch was matched perfectly with innovator and F2 value was found to be excellent. Also stability result of final trial batch was found to be excellent. Factorial design was used for the understanding of possible interaction amongst the excipients as sodium carbonate, polysorbate 80 and croscarmellose sodium. Results shown that there is no significant interaction between these factors.
REFERENCES
1. Ganzer W. Current thoughts on critical process parameters (CPP’s) and API Syntheses. Pharm Tech. 2005.
2. Menard F. Quality by design in generic drug development. Presentation to FDA Office of Generic Drugs; 2006.
3. Glodek M et al. Process robustness—A PQRI white paper. Pharm Eng. 2006;26:1–11.
4. Rath. Design for six-sigma pocket guide. Rath and Strong Management Consutants/AON Management Consulting, Lexington; 2002.
5. Lachman, Lieberman and Kanig. The theory and Practice of Industrial Pharmacy, Third Edition, Varghese Publishing house, Bombay,1990;293-308
6. Crindle MC. Efficacy and safety of atorvastatin in children and adolescents with familial hypercholesterolemia or severehyperlipidemia: amulticentre , randomized, placebo controlled tria. 2003;405-416.
7. Nissen S. Effect of very high intensity statin therapy on regression of coronary artherosclerosis, Journal of Atherosclerosis and thrombosis. 2006;99-115.
8. Nawrock J. Reduction of LDL-C by 25%-60% in patients with primary hypercholesterolemia by atorvastatin calcium. Journal of Atherosclerosis and thrombosis. 2004;110-120.
9. Marais. Atorvastatin: An effective lipid modifying agent in familial Hypercholesterolenia, Arteriosclerosis, thrombosis and vascular biology. 17(8):547-555.