The Effects of Collimation
on Image Formation in
Anger Gamma Cameras
Nia Eleri Harrison
Thesis for the degree of Doctor of Philosophy
University College London
University of London
August 1993
ProQuest Number: 10046189
All rights reserved
INFORMATION TO ALL USERS
The quality of this reproduction is dependent upon the quality of the copy submitted. In the unlikely event that the author did not send a complete manuscript and there are missing pages, these will be noted. Also, if material had to be removed,
a note will indicate the deletion.
uest.
ProQuest 10046189
Published by ProQuest LLC(2016). Copyright of the Dissertation is held by the Author. All rights reserved.
This work is protected against unauthorized copying under Title 17, United States Code. Microform Edition © ProQuest LLC.
ProQuest LLC
789 East Eisenhower Parkway P.O. Box 1346
Abstract
This thesis investigates the effects that collimators have on gamma camera images in nuclear medicine studies using technetium-99m. A M onte Carlo simulation of photon transport through a multihole collimator was written to determine the average point source response function of collimators. The code is flexible, thus enabling the m odelling of different dim ensions, hole misalignments and alternative structures. Separate computer programs were w ritten to produce images of source distributions using various collim ator response functions. The effects on the response functions and im ages of photons which have passed through collimator walls are determined.
Colhmator hole angulations of up to 1° are simulated and images produced using collimator simulations with random angulations over the collimator. The effects of angulation on the spatial resolution and linearity are investigated.
Laminated collimator structures are proposed as a means of producing more robust, lighter weight collimators. Response functions are obtained for several different layer thicknesses and are com pared w ith those o f a conventional lead collimator. It is shown that computer images obtained from a laminated collimator compare favourably with those from a conventional lead collimator.
Contents
Abstract 2
Contents page 3
List of figures 8
List of tables 11
CHAPTER 1 THE GAMMA CAMERA AND THE DESCRIPTION OF IMAGES 14
1.1 The Gamma Camera 14
1.1.1 Historical Introduction 14
1.1.2 The modem gamma camera 16
1.1.2.1 Basic Constmction 16
1.2 Factors to be considered in the design of camera components 17
1.2.1 The crystal 18
1.2.2 The photomultiplier tubes 19
1.2.3 Signal processor 19
1.2.3.1 The Anger logic circuit 20
1.2.3.2 Pulse height analysis 20
1.2.4 The collimator 20
1.2.4.1 Choice of collimator material 21
1.2.4.2 Collimator types 26
1.3 Gamma camera imaging 27
1.3.1 Tomography and the gamma camera 28
1.3.2 Typical clinical applications of the gamma camera 28 1.3.3 Image production in terms of camera components 29
1.3.3.1 The uncollimated camera 29
1.3.3.2 The collimator 29
1.3.3.3 Gamma camera components: conclusions 33
1.3.4 Previous collimator studies and what has been achieved 34 1.3.5 Description of images in terms of response functions 36 1.3.6 The advantages of working in response functions compared
with complete Monte Carlo 37
1.3.7 The collimator function 37
1.4 The aim of the current work 38
1.4.1 Consideration of collimator defects 38
1.4.2 Layout of thesis 40
Ch a p t e r 2 Sy s t e m Re s p o n s e Fu n c t io n s - m e a s u r e m e n t An d Mo d e l l in g 42
2.2 System description using response functions 43
2.2.1 Methods for image formation 44
2.2.2 Components in the system and resolution degradation 45
2.2.2.1 The source distribution 45
2 2 .2 2 The collimator response 46
2.2.2.S The intrinsic response 46
2.3 Numerical modelling and experimental measurement of response functions 47
2.3.1 The collimator response 47
2.3.1.1 Requirements of the collimator model 48
2.3.1.2 Description of collimator 49
2.3.1.3 Conventional parallel hole collimator model 49
2.3.1.4 Output from simulation 54
2.3.1.5 Modification to colhmator code for simulation of hole
angulation 54
2.3.1.6 Modification to colhmator code for simulation of layered
structures 56
2.3.1.7 Modification to colhmator code for simulation of alternative
materials 57
2.3.1.8 Experimental vahdation of the colhmator code 57 2.3.1.9 Theoretical vahdation of cohimator code 63
2.3.2 The source distribution 65
2.3.2.1 Requirements of a source distribution model 66
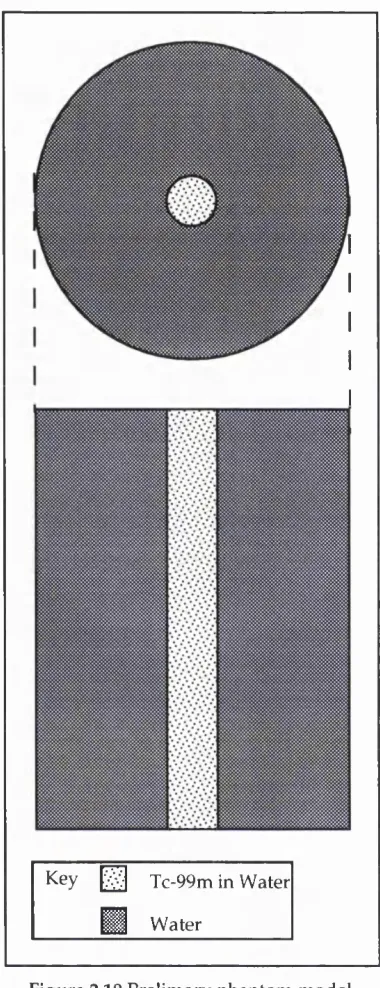
2.3.2.2 Description of a preliminary model 66
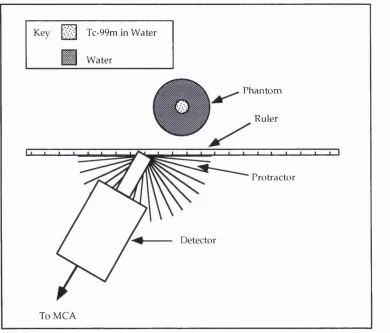
2.3.2.3 Experimental vahdation of preliminary source distribution
model 68
2.3.2.4 Line source phantom Monte Carlo simulation 71 2.3.3 Experimental measurement of the response of the uncolhmated
camera 72
2.3.4 Image production using response functions 72
2.3.5 Analysis of images 75
2.4 Application of these techniques 76
Ch a p t e r 3 Co l l im a t o r Re s p o n s e Fu n c t io n s 77
3.1 Use of response functions for colhmator assessment 77
3.2 Collimator parameters 77
3.3 Response functions of collimators 80
3.3.1 Conventional lead collimator response functions 80
3.3.1.1 Geometric resolution 80
3.3.1.2 Geometric and penetrated resolution 81
3.3.2 Angulated lead collimator response functions 84
3.3.2.1 Geometric resolution 85
3.3.2.2 Geometric and penetrated resolution 86
3.3.2.3 Geometric, penetrated and scattered resolution 87
3.3.3 Laminated collimator response functions 88
3.3.3.1 Geometric resolution 88
3.3.3.2 Geometric and penetrated resolution 89
3.3.3.3 Geometric, penetrated and scattered resolution 89 3.3.3.4 Assessment of laminated structure response functions 90
3.3.4 Sandwich collimator response functions 90
3.3.4.1 Geometric resolution 90
3.3.4.2 Geometric and penetrated resolution 90
3.3.4.3 Geometric, penetrated and scattered resolution 91 3.3.4.4 Assessment of sandwich structure response functions 91 3.3.5 Alternative material collimator response functions 91
3.3.5.1 Geometric resolution 91
3.3.5.2 Geometric and penetrated resolution 92
3.3.5.3 Geometric, penetrated and scattered resolution 92 3.3.5.4 Assessment of alternative material collimators of conventional
dimensions 92
3.3.6 Response functions of uranium collimators of various septal
thicknesses 93
3.3.6.1 Geometric resolution 93
3.3.6.2 Geometric and penetrated photons 94
3.3.6.3 Geometric, penetrated and scattered photons 94 3.3.6.4 Assessment of narrow septa uranium collimator response
functions 94
3.4 Conclusions on collimator response functions 94
Ch a p t e r 4 Ne w Co l l im a t o r s 96
4.1 M ethod of analysis of images 96
4.2 Images obtained from a conventional lead collimator 97 4.2.1 Comparison of the image obtained from geometric photons with the
original source distribution 97
4.2.2 Effect of collimator penetration on images 98
4.2.3 Effect of collimator scatter on the image 100
4.2.4 Effect of object scatter on the image 101
4.2.5 Discussion on image formation using a conventional collimator 106 4.3 Images obtained from collimators with random hole angulations 106
4.3.2 System images from angulated collimators 110 4.3.3 Discussion on image defects from angulated collimators 113
4.4 Images from laminated collimators 113
4.4.1 Image from geometric photons not scattered in the object 113 4.4.2 Image from penetrated photons not scattered in either the collimator
or the object 114
4.4.3 Image from photons not scattered in the object but scattered in the
collimator 117
4.4.4 Image containing all photons (not convolved with intrinsic resolution) 121
4.4.5 System image from laminated collimator 122
4.4.6 Discussion on the use of a laminated collimator structure for gamma
camera imaging 126
4.5 Images from a uranium colhmator of conventional dimensions 126 4.5.1 Image from geometric photons not scattered in the object 126 4.5.2 Image from penetrated photons not scattered in either the collimator
or the object 127
4.5.3 Image from photons not scattered in the object but scattered in the
colhmator 130
4.5.4 Discussion on the use of uranium in collimators of conventional
dimensions 130
4.6 Images from a uranium colhmator with narrow septa 130 4.6.1 Image from geometric photons not scattered in the object 131 4.6.2 Image from penetrated photons not scattered in either the collimator
or the object 132
4.6.3 Image containing photons not scattered in the object but scattered in
the colhmator 133
4.6.4 Image containing all photons (not convolved with intrinsic resolution) 135 4.6.5 System image from narrow septa uranium collimator 135 4.6.6 Discussion on the use of narrower septa uranium collimators 136
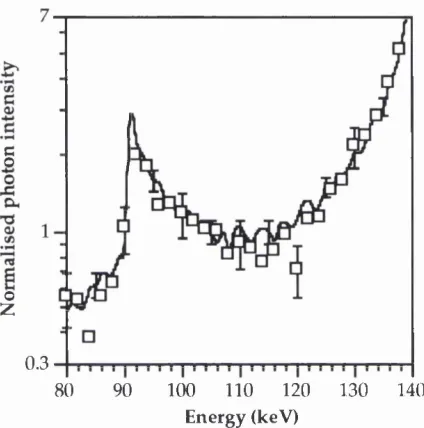
4.6 Depleted uranium energy spectrum 137
4.7 Conclusions on alternative collimators 137
Ch a p t e r s im a g e Co n t r a s t 139
5.1 Computer model for contrast 139
5.1.1 Object distribution 139
5.1.2 Cold spot phantom results 140
5.1.3 Hot spot phantom results 141
Ch a p t e r 6 Co n c l u s io n s An d Fu t u r e Wo r k 143
6.1 Future work 145
Ap p e n d ic e s 147
Appendix 1 — The photomultiplier tube 147
Appendix 2 — Linear systems theory 149
Appendix 3 — The interaction of gamma rays with matter 152
3.1A Gamma ray interactions 152
3.1.1A Photoelectric absorption 152
3.1.2A Compton scattering 153
3.1.3A Coherent scattering 153
Appendix 4 — Monte Carlo Techniques 155
4.1 A Principles of Monte Carlo 155
4 .1 .lA Sampling methods 155
4.2A Applications of Monte Carlo Techniques 156
4.2.1A Monte Carlo Sampling of Compton Scattered Photons 156 4.2.2A Monte Carlo Sampling of Coherent Scattered Photons 158
List o f figures
1.1 The gamma camera introduced by Anger (1958). 15
1.2 The m odem gamma camera. 16
1.3 The possible paths of photons through an ideal collimator. 21 1.4 Actual photon paths through a gamma camera collimator: 22 1.5 Variation in photoelectric and Compton cross-section with atomic
number for a photon energy of 140 keV. 23
1.6 Variation in linear attenuation coefficient (for E = 140 keV) and density
with atomic number for elements of Z = 70 to 92. 23
1.7 Various types of mechanical collimator. 26
1.8 Measurement of PSF in Anger’s equations (1964). 30
1.9 Method of calculating effective hole size. 31
1.10 The separation of images due to the angulation of septa. 32
2.1 Shift-variance of a parallel hole collimator. 44
2.2 The unit cell. 49
2.3 Flow chart of collimator simulation. 50
2.4 Directions in which photons are traced through the collimator are chosen such that if no scatter occurs then the photons will intersect the crystal
plane at equal incremental distances d. 51
2.5 Description of a line in the x-y plane. 52
2.6 Description of two perpendicular lines in a plane. 53 2.7 Description of a plane using three perpendicular lines and a point. 53
2.8 Slant hole collimator. 55
2.9 Model for computer simulation of cast collimator defects. 56
2.10 The resolved unit cell. 57
2.11 Flow chart of changed code for layered collimator simulation. . 58
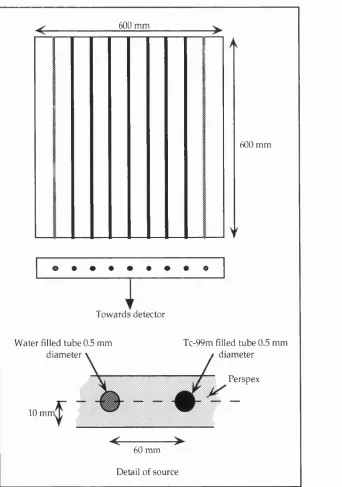
2.12 Experimental test apparatus. 59
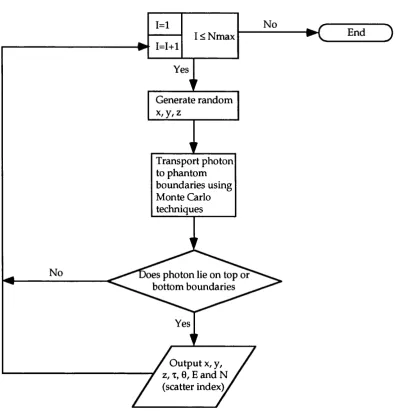
2.13 Flowchart of Monte Carlo code for comparison with experimental
measurement. 61
2.14 Experimental and simulated photon intensities as a function of source
position for a technetium source at a 10 cm height. 62 2.15 Experimental and simulated photon intensities as a function of source
position for an americium source at a height of 0.4 cm. 62
2.16 Variation in FWHM with source height. 63
2.17 Variation in FWHM with hole size. 64
2.18 Variation in FWHM with hole length. 65
2.19 Prelimary phantom model. 67
2.20 Experimental validation of source distribution at collimator plane. 68
2.22 Energy spectrum at incident angle of 5°. 69 2.23 Phantom simulated for system resolution and distortion measurements. 70 2.24 Monte Carlo simulation of photon transport in line source phantom. 71 2.25 Phantom for measurement of intrinsic resolution. 73
2.27 The generation of image in the crystal. 74
3.1 Shape of geometric component of response function. 81 3.2 Typical shape of penetration component of response function. 81 3.3 Penetration component variation with septal thickness. 82
3.4 Effect of septal thickness on penetration. 83
3.5 Total response function variation with septal thickness. 84 3.6 Effect of hole angulation on thickness of lead traversed. 87
3.7 Penetration components of laminated collimators. 88
3.8 Diagram to indicate the increased probability of a photon passing
through a septum in aluminium as the layer thickness is increased. 89 3.9 Response functions from alternative material collimators. 92 3.10 Response functions of uranium collimators of various septal thicknesses. 93 4.1 Geometric image from (a) hypothetical situation where no spread
occurs and (b) conventional lead collimator. 98
4.2 Effect of penetration in a conventional lead collimator on the image. 99 4.3 Effect of scatter in a conventional lead colhmator on images. 100 4.4 Effect of object scatter on the image using a conventional lead colhmator. 102 4.5 Image of photons which have been scattered in the object but pass
geometrically through the holes of a conventional lead collimator for
various energy ranges. 103
4.6 Image of photons which have been scattered in the object and penetrate conventional lead colhmator septa without scattering for various energy
ranges. 104
4.7 Image of photons which have been scattered in the object and scatter in
conventional lead colhmator septa for various energy ranges. 105 4.8 Gaussian distributions used for sampling of hole angulations. 107 4.9 PSPs averaged over angular distribution for angulated collimators. 108
4.10 Geometric images using angulated colhmators. 109
4.11 System images using angulated colhmators. I l l
4.12 System images using angulated colhmators using alternative colour scale
to accentuate differences. 112
4.13 Geometric photon images using conventional and laminated colhmators. 114 4.14 Effects of penetrated photons on images using conventional and laminated
collimators. 117
4.15 Effect of scatter in the colhmator on images of conventional and laminated
4.16 The contribution of photon scatter in the object to the final image for
various energy ranges using conventional and laminated collimators, 119 4.17 The overall effect of photon scatter in the object to the final image using
conventional and laminated collimators. 120
4.18 Line segments from total images of conventional and laminated collimators. 122 4.19 System images for conventional and laminated collimators. 123 4.20 Zoomed image of the region between two of the lines for conventional and
laminated collimators. 123
4.21 Profiles of system images for conventional and laminated collimators. 124 4.22 System images of conventional and laminated collimators when a count
threshold has been set. 125
4.23 Geometric image using lead and uranium collimators of conventional
dimensions. 127
4.24 Effect of penetration on images using lead and uranium collimators of
conventional dimensions. 128
4.25 Effects o f collimator scatter on images using lead and uranium collimators
of conventional dimensions. 129
4.26 Geometric images using conventional lead and narrow septa uranium
collimators. 131
4.27 Effect of penetration on images using conventional lead and narrow septa
uranium collimators. 132
4.28 Image of geometric and penetrated photons using conventional lead and
narrow septa uranium collimators. 133
4.29 Contribution of collimator scatter to images using conventional lead and
narrow septa uranium colhmators. 134
4.30 Images of geometric, penetrated and scattered photons using conventional
lead and narrow septa uranium collimators. 134
4.31 Images of all photons using conventional lead and narrow septa uranium
collimators. 135
4.32 System images using conventional lead and narrow septa uranium
collimators. 136
5.1 Contrast phantom. 140
L IA A typical photomultiplier tube. 147
List o f tables
1.1 Materials with suitable absorption properties for use as collimator materials. 24
3.1(a) Parameters of conventional collimators. 78
3.1(b) Parameters of slanted collimators. 78
3.1(c) Parameters of laminated collimators. 79
3.1(d) Parameters of sandwich collimators. 79
3.1(e) Parameters of alternative material collimators. 79
3.2 Resolutions of conventional lead collimators. 80
3.3 Efficiencies of conventional lead collimators. 83
3.4 Resolutions of angulated lead collimators. 85
3.5 Displacement of peak position with collimator angulation. 86
3.6 Resolutions of laminated collimators. 88
3.7 Resolutions of sandwich collimators. 90
3.8 Resolutions of uranium, tungsten and lead collimators of conventional
dimensions. 91
3.9 Resolutions of uranium collimators of various septal thicknesses. 93 4.1 Geometric resolutions for an ideal collimation system and a conventional
lead collimator. 98
4.2 Effect of penetrated photons on resolution of conventional lead collimator
images. 99
4.3 Effect of penetrated and scattered photons on resolution of a conventional
lead collimator. 101
4.4 Effect of object scatter on image resolution. 106
4.5 Angulated collimators. 107
4.6 Percentage of holes within angular ranges for angulated collimators. 108 4.7 Resolution of angulated collimator from line source measurements. 110 4.8 Deviation of centroids in angulated collimators. 110 4.9 Measured resolutions of collimators using system images. 110 4.10 Geometric resolutions of conventional and laminated structure. 113 4.11 Mean resolutions of conventional and laminated collimators using
only geometric and penetrated photons. 117
4.12 Resolutions of unconvolved total image for conventional and laminated
collimators. 121
4.13 Resolutions of system image of conventional and laminated collimators. 125 4.14 Fitted values for geometric resolutions of conventional and uranium
collimators. 126
4.15 Geometric resolutions for both conventional lead and narrow septa
uranium collimators. 131
conventional lead and narrow septa uranium collimators. 132 4.17 Resolution values for system images of conventional lead and narrow
septa uranium collimators. 135
Errata
C h a p te r 1p. 31 Equation 1.4
C h a p te r 2 p. 42 Line 22 p. 42 Line 27 p. 43 Line 25 p. 57 Line 17 p. 60 Equation 2,15 p. 60 Equation 2.16 p. 76 Paragraph 2
Denominator Result » 0 .804D F
Delete second occurrence of ‘of photon transport’. Insert ‘(Horrocks 1988)’ after ‘UCL’.
Insert ‘(Rodriguez-Villafiierte 1991)’ after ‘results’. Replace ‘0.1% ’ with ‘0.4% ’.
The variable ‘d t’ should be inserted after each integral. The variable ‘d t’ should be inserted after the integral.
Insert at end of paragraph ‘The fitting routine is based on the Singular Value Decomposition least squares fitting routine of Press e ta l (1988).’.
C h a p te r 3 p. 77 Line 23
p. 80 Line 8
p. 80 p. 84 p. 88 p. 89
Table 3.2 Line 16 Figure 3.7 Line 9
Before the final sentence the following should be inserted: ‘The widths were measured from the response curves by determining the intersection points of the curve w ith the lines y = 0.5, y = 0.1 and y = 0.01.’
Insert ‘(i.e. a source placed at the face of the collim ator)’ after ‘0 cm ’.
Replace ‘±0.001 cm ’ with ‘±0.01 cm ’.
Insert ‘, a septal thickness of 0.24 m m ’ after ‘hole size’. Replace ‘L ’ with ‘M ’ in figure key.
Replace ‘table 3.5’ with ‘table 3.6’.
C h a p te r 4 p. 96 Line 19 p. 107 Line 1
p. 113 Line 13
Replace ‘will the subdivide’ with ‘will then subdivide’. Insert ‘The angulations were random only in magnitude and not in orientation.’ after ‘in figure 4.8.’
Insert ‘Collim ator MO 100 was used for all im ages of laminated structures.’ after ‘a conventional collimator.’.
C h a p te r 5
-
1
-The gamma camera and the description of images
The gamm a cam era is a well established instrument in radioisotope imaging. A vital component of the gamma camera is the colhmator. This thesis considers the various effects of coUimators on gamma camera images by using Monte Carlo techniques to model photon transport. Various defects in collimators are considered and the results of such defects on images are presented. Colhmators constructed from different materials and using different designs are also simulated. This chapter introduces the gamma camera, discussing the various components of the camera, concentrating in particular on the colhm ator and its design.
1.1 The Gamma Camera
This section briefly discusses the development of the gamma cam era from its introduction to the modem camera. The basic principles of the camera are presented.
1.1.1 Historical Introduction
The first attempts at radionuclide imaging were made in the late 1940s. Moores (1948) reported on the diagnosis and localisation of brain tumours using and a highly shielded beta-gamma Geiger-Miiller tube mounted on a portable unit. The detection unit was placed directly on the skin at several different locations on the skull and the counts recorded for each measurement site. A repeat examination of the sites of higher activity was made in order to localise more definitely the suspected lesion.
The use of phosphors for scintillation detectors was discussed by Sharpe and Taylor (1951) and the advantages of thalhum-activated sodium iodide [NaI(Tl)] for gamma ray detection were noted. The first imaging device to effectively image y-ray distributions within the body was the rectilinear scanner described by Cassen et al (1951). The scanner was an automated version of the device built by Moores (1948) and consisted of a collimated scintillation counter scanning in a raster pattern over the patient. The colhmation restricted the field of view of the counter to a small volume directly beneath it. The image of the radioactive distribution was obtained by correlating the recorded count rate with the spatial position of the detector at the time.
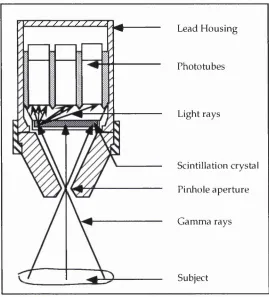
sensitive film with a thallium activated sodium iodide, Nal(Tl), intensifying screen. The method required a therapeutic dose of and an exposure time of one hour. A faint but usable image of a tumour on the elbow was achieved. Anger later reported a much improved gamma-ray camera (Anger 1958) which replaced the film-screen combination with a single large-area Nal(Tl) crystal and a packed anay of seven photomultiplier tubes (figure 1.1). A signal matrix circuit determined the position of interactions and a pulse-height analyser rejected all signals outside a predetermined energy window. The image was produced on a cathode-ray oscilloscope and photographed by a conventional camera for storage.
Z Z Z Z Z Z Z Z Z Z Z Z ^
Lead H ousing
Phototubes
Light rays
Scintillation crystal
Pinhole aperture
Gamma rays
Subject
Figure 1.1 The gamma camera introduced by Anger (1958).
Since the Anger camera was first introduced other imaging devices have been developed, but the camera has become the main instrum ent in nuclear m edicine for m easuring in-vivo distributions of activity due to its balance of image quality, detection efficiency and ease of use.
1.1.2 The modern gamma camera
M uch work has been carried out in the field o f the gamma cam era since the introduction of the pinhole camera in 1952. The replacement of the photographic plate by PM tubes and a cathode ray oscilloscope (CRO) was a significant improvement (Anger 1958). Soon to follow were new multihole collimator designs; both parallel holes (Anger 1964) and tapered holes (M uehllehner 1969), enabling the imaging of larger organs. Investigations were conducted into crystal material and thickness (Anger and Davis 1964, M allard and Myers 1963a), the type of photomultiplier tube (Mallard and Myers 1963b) and the use of digital rather than analogue circuitry for image production. The advent of emission computer tomography (Freedman 1970, M uehllehner 1971, Chang e ta l 1980, Shosa et al 1980) led to a new line of research both in camera design and reconstruction techniques.
1,1.2.1 Basic Construction
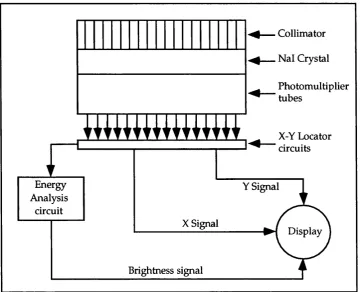
A schematic diagram of the basic components of a modem gamma camera is shown in figure 1.2.
Collimator
Nal Crystal
Photomultiplier tubes
X-Y Locator circuits
Energy Analysis circuit
Y Signal
X Signal
Display
Brightness signal
Gamma photons from a radioactive distribution interact within a large-area, thin scintillation crystal optically coupled to a closely packed array o f photomultiplier (PM) tubes. The crystal and PM tubes are hermetically sealed in a light-tight can to keep out moisture and light. This can is usually constructed from a thin aluminium sheet on the front face and sides so as not to attenuate the incoming gamma-rays, while the surface between the crystal and PM tubes is an optical window.
The photoelectric absorption of a photon within the crystal results in the emission of a scintillation pulse in the visible spectrum. The pulse is proportional in intensity to the energy of the absorbed gamma ray. The PM tubes convert the light to an electronic signal and amplify it to give a sufficiently large current to be handled by an electronic circuit. The PM tubes closest to an absorption event will receive the greatest intensity of light photons and hence signals produced by these tubes will have greater amplitudes than those further away. The signals from the PM tubes are processed to give X and Y position signals and a Z energy signal. The energy signal is produced by the summation of the outputs from all the tubes to give the total light produced by the scintillation. The summed energy signal is then passed to a pulse height analyser and if the energy is within the set range the signals are processed to give the image.
Since gamma-rays are emitted isotropically, the detector described above would not result in an image, however, as there is no inherent relationship between the location of the scintillation interaction and the point of emission of the gamma-ray from the patient. Just as in an optical camera the film alone is not sufficient to form an image of the scene, so the scintillation camera described above does not constitute a gamma-ray imaging system. The function of the detector is to record an image formed by another element. In the case of an optical camera this is the lens. However, with high-frequency radiation such as gamma-rays a much cruder device must be employed, the collimator. Several varieties of collimator exist. All are made from a high atomic number material, and all but one type have many holes. The design and quality of the collimator determines the quahty of the image produced and will be considered throughout the thesis.
1.2 Factors to be considered in the design of camera components
1.2.1 The crystal
The purpose of the scintillation crystal is to convert photons incident on it to a light pulse whose amplitude is proportional to the photon energy absorbed in the crystal. The crystal is therefore useful for energy-selective counting. The desirable properties of a scintillation crystal are the following:
(a) High photoelectric absorption efficiency;
(b) High conversion of gamma-ray energy into light; (c) Short scintillation decay time;
(d) Crystal transparent to its own scintillations;
(e) Wavelength of light should match response of PM tubes.
Inorganic alkah halide crystals are favoured for use in gamma-ray spectroscopy due to the high density and relatively high atomic number of the constituents. In inorganic crystals, the absorption of the energy of a photon elevates an electron from the valence band across the band gap to the conduction band leaving a hole in the valence band. A photon is emitted when a hole is filled by an electron returning to the valence band. In a pure crystal the energy of the photon would typically be of too high an energy to lie in the visible range. In order to enhance the probability of the production of visible photons, impurities, known as activators, are added to the lattice to modify the band structure by creating energy states within the band gap through which the electron can de-excite back to the valence band. Since this energy is lower than that of the gap, visible photons can be produced by the transition.
The most commonly used scintillation crystal in gamma cameras is thallium- activated sodium iodide (Nal(Tl)). Nal is a good absorber of photons in the range 30 keV to 700 keV due to the high atomic number of iodine (Z = 53) and its relatively high density (p = 3.67 g/cm^). It is a relatively efficient scintillator, yielding one visible light photon per 30 eV of radiation energy absorbed. The wavelength of the light photons produced is 410 nm, close to that required by the PM tubes. The duration of each scintillation is about 0.8 qs. There is little loss of scintillation hght caused by self-absorption since Nal is transparent to its own scintillation emissions. The output signal from the detector is proportional in amplitude to the amount of radiation energy absorbed in the crystal allowing the detector to be used for energy-selective counting.
scatter in the crystal (Anger and Davis 1964). Gamma camera crystals are typically 6-12 mm thick, with a diameter of up to 50 cm to provide a large field of view.
The exit window of the crystal is optically coupled to lightguides using silicone grease. The purpose of the lightguides is to optically interface the crystal to the PM tubes so that light losses are kept to a minimum. The guides are made from a transparent plastic and are carefully shaped to match the photocathode in the PM tubes. The refractive index of the plastic is matched to the refractive index of the tube. The use of a thin light guide improves the spatial resolution but tends to worsen the effects of non-linearity and non-uniformity. The lightguide is also optically coupled to the PM tubes using silicone grease. In some m odem cameras the lightguide is dispensed with in favour of correction procedures in the data processing stage.
1.2.2 The photomultiplier tubes
The purpose of the photomultiplier tubes is to convert the scintillation pulse created in the crystal to an electrical signal which is then multiplied to produce a sufficiently large current pulse to be handled by an electronic circuit. The PM tubes consist of two major elem ents — the photocathode and the dynode structure (A ppendix 1 — PM tube description and diagram). Anger’s scintillation camera (Anger 1958) had an array o f 7 photomultiplier tubes of 1.5 inch (38 mm) diameter. The tubes used in the modem gamma camera have a much smaller diameter (-25 mm) enabling a greater number of tubes to be contained in the array, typically 75 or 91. The tubes, of circular or hexagonal cross-section, are closely packed in a hexagonal array. The use of a large number of small diameter tubes improves the spatial resolution but can cause non-uniformity problems. The voltage supply to the PM tube array must be stable so that the gain remains constant.
The photocathode material is chosen such that its spectral response matches the scintillation emission wavelength from the crystal while at the same time giving a high quantum efficiency in order to minimise statistical fluctuations in the output signal. The bialkali K2CsSb, activated with oxygen and caesium, satisfies these requirements.
O f major importance in the choice of the dynode material is its stability to changes in voltage and temperature. Beryllium-copper dynodes show a reasonable stability although their gain is lower than gallium phosphide coated dynodes (Simon and Williams 1968). O f the various dynode configurations available in PM tubes, the m ost effective dynode structure for gamma cameras is the Venetian blind construction, with the first dynode modified to a ‘teacup’ shape, so that the angle of incidence of primary electrons does not lead to a non-uniform response (Short 1984).
1.2.3 Signal processor
from all PM tubes is subjected to pulse height analysis, all signals lying within a chosen energy window being used to form the image.
1 2,3 .1 The Anger logic circuit
In analogue cameras the outputs from the array of PM tubes are passed through a capacitor network or a resistive-coupled network to provide the position information necessary to form an image. The relative intensity of the signal determines the (x, y) coordinates of the scintillation event and provides four signals x+, x", y+, y" to produce an image on an oscilloscope. The total intensity z of the signal is given by the sum of the four signals
z = x"*”-I-x ~-I-y**"-f-y~ (1.1)
and the x and y positions are given by
k(x"''4-x")
x = —--- and y = —--- (1.2)
z z
where k is a scale factor adjusted for the deflection voltage requirements of the oscilloscope. In newer cameras the positional signals from the PM tubes are either converted to digital signals using an interface box before displaying the output on a computer, or the conversion to a digital signal is performed directly on each PM tube output. In the latter case, a microprocessor performs the position and energy calculations and the output is displayed by a computer.
1.2.3.2 Pulse height analysis
Energy selection in a gamma camera is achieved by passing the z signal from the PM tubes and logic circuitry through a single channel analyser and setting two discrimination levels to determine whether the signal lies within an expected energy window. Photons with energies lower than the lower-level discriminator or higher than the upper- level discriminator will be rejected. Any signals lying within the energy window are accepted and the x and y signals are passed to the display unit to produce the image.
1.2.4 The collimator
Since gamma rays are isotropically emitted, no inherent relationship exists between the position of interaction of the gamma ray with the crystal and its point of emission in the patient. The purpose of a cohimator is to limit the photons detected to those travelling in an appropriate direction in order to produce an image in the crystal. In the majority of studies a parallel hole collimator is used, but other types may be employed for specialised tasks.
z=0
Collimator
z=a
Scintillation crystal
Figure 1.3 The possible paths of photons through an ideal collimator.
At the face of the collimator (z=0) photons (a) to (d) enter the collimator through a hole. Photon (e) is incident on the septum surface and is completely absoiped. At z = a only photons (a) and (b) emerge, the remainder having entered a septum at some point in their path and undergoing complete absorption. If the hole width is infinitely nanow only those photons whose direction of travel is parallel to the hole wall will emerge and be detected. The finite hole size leads to a small angular range in the directions of detected photons.
1.2.4.1 Choice o f collimator material
z=0
Collimator
z=a
Scintillation crystal
Figure 1.4 Actual photon paths through a gam ma camera collim ator: (a) C om plete septum
penetration; (b) Partial septum penetration (edge penetration); (c) Scattering in septum; and (d)
G eom etric path.
Since the purpose of a collimator is to absorb incident photons, the collimator material must have strong photon absorption properties. The variations of the photoelectric and Compton cross sections with atomic number for a photon energy of 140 keV are seen in figure 1.5. The photoelectric cross section per atom increases while the Compton cross section per atom decreases with increase in atomic number. From this consideration, a collimator material should have a high atomic number so that it is a good absorber of photons.
Since the attenuation produced by a layer of material is dependent on the number of electrons and atoms present in that layer, the lineai* attenuation coefficient |i of a material is dependent on its density p. This can be seen in figure 1.6 where [i and p are plotted as functions of Z for elements with Z ranging from 70 to 94 at E=140 keV; the value of |i for lead is indicated by the dashed line. The attenuation coefficient can be seen to be dependent both on atomic number and density.
0.9
Photoelectric
_ 0.8
I
I
0.7^
0.6o 0.5
% 0.4
(k
S 0.3
'o,2
Compton 0.1
0 10 20 30 40 50 60 70 80 90 100 Atomic number
Figure 1.5 Variation in photoelectric and Compton cross-section with atomic number for a
photon energy of 140 keV.
6 0
5 0
4 0
3 0
-20
-70 74 78 82 86 90 94
Density (g/cc)
Total cross-section (1/cm)
Atomic number
Figure 1.6 Variation in linear attenuation coefficient (for E = 140 keV) and density with atomic
number for elements of Z = 70 to 92.
A m ajor factor in the selection of a material for gamma camera collimators is the cost. W hilst all other factors may suggest its suitability, its cost may be prohibitive. Since lead is commonly used in collimator manufacture, the cost o f any alternative material relevant to the cost of lead is of importance.
greater or equal to lead, giving an indication of their costs relative to lead and comments on those m aterials which are unsuitable for use in a collimator due to their physical and mechanical properties, etc.
z Name Melting Point °C P g/cm^ Approx. relative cost Yield strength MPa Tensile strength MPa Young’s Modulus GPa Comments
73 Tantalum 2996 16.6 21 705 760 186
74 Tungsten 3410 19.3 4 550 550 411
75 Rhenium 3180 21.0 11 315 1125 466
76 Osmium 3045 22.5 493 — — 559
77 Iridium 2410 22.4 381 — 550 528
78 Platinum 1772 21.45 423 14 125 170
79 Gold 1064.4 19.3 479 205 130 79
80 Mercury -38.87 13.6 N/A — — — Liquid
81 Thallium 303.5 11.85 41 — 9 8
82 Lead 327.5 11.35 1 5.5 12 16
90 Thorium 1750 11.5 41 298 305 78
91 Protact inium
-12 3 0 -15.3 7
N/A V. rare,
radioactive, hazardous
92 Uranium 1132.3 -11.7 250 580 176 U235
depleted
Table 1.1 Materials with suitable absorption properties for use as collimator materials.
M aterials which would meet the absorption requirements are, from figure 1.6, situated around lead in the periodic table. From table 1.1 two materials are instantly ruled out, mercury and protactinium. The cost is obviously prohibitive in the case o f osmium, iridium, platinum, and gold. Another possible material is thallium (Z = 81), however its attenuation coefficient is too similar to that o f lead to warrant its use. The remaining materials are uranium (Z = 92), which has the highest value of |i, tungsten (Z = 74) and rhenium (Z = 75), which both have similar values of |i, and thorium (Z = 90), with an attenuation coefficient slightly lower than uranium. A discussion follows on the possible use of these materials and of lead for collimators.
Uranium: Uranium has the highest atomic number of the naturally occurring elements. N aturally occurring uranium contains a mixture of IJ235 and U^ss (0.711% it is used in the nuclear industry in fuel elements for nuclear reactors. Depleted uranium, so called because it has a much lower concentration of the isotope than natural uranium, is a by-product of the nuclear industry. It contains approximately 0.3% it has a wide range o f industrial uses due to its unique combination of properties — high density, high strength and high melting point. It is a very dense metal (p « 18.7 g cm ‘3 at 18°C), its density being greater than that of lead, with a high melting point.
There are several hazards associated with uranium, most noticeably the radioactive hazard. Uranium is of low specific activity and low radiotoxicity. Alpha, beta and gamma radiations are continuously emitted, however the main radiation dose comes from beta radiation which is completely stopped by 1.5 mm of steel. The dose from the gamma radiation is less than 5% of the beta dose at the surface of uranium. Alpha radiation can be stopped by nickel plating or other surface coatings. Nickel plating is also used to prevent the oxidation of uranium which occurs in air. Other hazards of uranium include a toxicity on inhalation comparable with that of lead, and a fire hazard. Although massive uranium metal offers no real problem, in a finely divided form it is pyrophoric, and care is necessary to prevent fires. For this reason when uranium is machined a rapid flow of a coolant is required to prevent swarf from igniting. The pyrophoric nature of uranium would impose a low er lim it on the minimum septal thickness possible in a collimator, however this is thought to be less than 10 microns.
Another consideration in the use of uranium as a material for cast collimators is its high melting point (1132.3 °C). The total volume change from 25°C to melting point is 8.81%, a factor which would need to be considered when casting the collimator. One possible method o f casting would be to cast the uranium around beryllium pins, which would remain in the collimator. The melting point of beryllium is slightly higher than that of uranium (1278°C). The permanent pins would also prevent the uranium from both oxidising and igniting. Beryllium, with its low atomic number is virtually transparent to gamma photons at 140 keV.
Tungsten: Tungsten is placed 8 elements before lead in the periodic table. Its density (19.3 g cm-3 at 20°C), which is similar to uranium, is higher than lead. It is a strong, hard metal (table 4.11). It has the highest melting point of all metals (3410 °C), a possible disadvantage for cast collimators.
m inerals but usually in concentrations below 0.1 part per million. It has two naturally occurring isotopes R e-185 which is stable and R e-187 which is radioactive and the more abundant. Due to its rarity it would not be a viable material for gamma camera collimators.
Thorium: Thorium, which is thought to be approximately three times as abundant as uranium and therefore about as abundant as lead, is a fissionable metal and a source of nuclear power. The purest specimens of thorium contain thorium oxide, which has a melting point o f 3300 °C. Powdered thorium metal is often pyrophoric. Thirteen isotopes of thorium are known, all of which are radioactive. Thorium-232 occurs naturally and has a half-life of 1.41 x 10^® years. It is an a , P, and y emitter, and is sufficiently radioactive to expose a photographic film in an few hours. Thorium disintegrates with the production of thoron (radon220)^ an alpha emitter which presents a radiation hazard.
From the five materials discussed above, three materials other than lead emerge as possibilities for collimator materials. Of these uranium and thorium have similar absorption properties, while the attenuation coefficient of tungsten is slightly lower. Both uranium and thorium are naturally radioactive, however the nuclear industry have unwanted supplies of depleted uranium making it more cost effective. Uranium is also stronger and harder than thorium. Because of the strength of tungsten, and its relatively high attenuation coefficient, it is also a good choice for a collimator material. In chapter three, the perform ance of collim ators constructed from lead, tungsten and uranium will be considered from their response functions.
1.2,4.2 Collimator types
The four major types of collimator used in nuclear medicine imaging are: pinhole, parallel hole, diverging and converging (figure 1.7).
Nal Crystal
(a) Pinhole (b) Parallel hole
Nal Crystal
/ / i n w w w w
W W W W i l U /
(c) Diverging (d) Converging
Pinhole collimator: The pinhole collimator is identical to the optical pinhole except that the pinhole is made from lead and has a diameter of a few millimetres. The image formed in the crystal is inverted. Pinhole collimators provide good resolution for the imaging of small organs relatively close to the collimator face. As the aperture-source distance decreases, image size and efficiency increase and resolution improves. Increasing the pinhole size will improve efficiency but at the expense of resolution. The degree of penetration is increased with an increase in gamma ray energy effectively increasing hole size and so worsening the resolution.
Parallel-hole collimator: In the parallel-hole collimator the holes are perpendicular to the crystal face, so only gamma rays travelling in this direction will be detected; obliquely incident gamma rays being absorbed by the septa.
Converging collimator: In the converging collimator the holes converge towards the object so that gamma rays diverging from it are detected, forming an enlarged image. Converging collimators provide the capability of high resolution, high sensitivity imaging. The field of view is, however, small and some image distortion occurs.
Diverging collimator: Diverging collimators are primarily used to produce a reduced size image of a large organ. Both spatial resolution and sensitivity are reduced and distortion is caused by the change of magnitude with depth.
The first gamma-camera (Anger 1952) used a pinhole collimator to produce the image, however nowadays the parallel-hole collimator is used for the majority of studies, the other types being employed for specialised tasks. All but the pinhole collim ator are multihole collimators and provide greater efficiency in gamma ray collection. The efficiency and resolution of collimators depend on the hole size, the septal thickness (i.e. thickness of collimator walls) and the geometry of the holes. Gamma-camera collimators can be obtained as low-, medium- or high-energy collimators. Septal thickness increases from low-energy to high-energy colHmators to minimise interseptal penetration. High-energy collimators have the poorest efficiency and resolution due to the thicker septa and wider holes, respectively. If the septal thickness is too thin, gamma rays will penetrate the septal walls and reach the crystal resulting in a degradation of image contrast due to the detection o f penetrated photons and an increase in detected scattered radiation.
1.3 Gamma camera imaging
are reviewed considering effects such as penetration and scatter and different modelling techniques. Finally, the section suggests that the formation of images using numerical methods by combining the response functions of the individual camera components to a source distribution has advantages over a single photon transport model of the complete system.
1.3.1 Tomography and the gamma camera
Planar imaging portrays a three dimensional distribution of activity as a two dimensional image superimposing structures at different depths. The result is a loss of contrast in the plane of interest due to the presence of activity in structures from outside the plane of interest. The acquisition of several views (posterior, anterior, lateral and oblique) may aid interpretation of the image, but is not ideal. Emission computed tomography (ECT) is a technique whereby multi-cross sectional images of tissue function can be produced, thus removing the effect of overlying and underlying tissues. ECT can be divided into two general types: limited angle (or longitudinal) tomography and transaxial (or transverse section) tomography. In limited angle ECT, photons within a limited angular range are detected simultaneously from several sections of the body. The reconstruction gives images of planes that are parallel to the face of the detector. Transaxial ECT is performed using a gamma camera that, under computer control, rotates around the patient. A series of static images is obtained with the camera in different angular positions around the patient. Other systems use two or three gamma cameras mounted on a rotating gantry collecting several views simultaneously. A two dimensional image is obtained at each angular position around the patient. Rotation through 180° satisfies angular sampling requirements, however many gam m a cam era SPECT studies are performed with 360° rotation to minimise errors resulting from attenuation and loss of resolution with depth. Mathematical reconstruction of these images using a filtered backprojection algorithm (Budinger and Gullberg 1977) leads to a set of sections through the patient.
1.3.2 Typical clinical applications of the gamma camera
The modem gamma camera may be used for a variety o f types of studies; those possible with a modem gamma camera are described below.
Single planar study : In this type of study both the patient and the camera are stationary. The image is acquired for either a preset time or a preset count. The images are normally obtained in 128 x 128 or 256 x 256 matrix size.
Static studies : These are recorded in the same manner as the single study. Any number of statics can be acquired, each view being uniquely labelled, e.g. anterior or posterior.
time acquisition of the second image is commenced, the data being stored in another buffer, w hile the first image data is stored on disk. The process is repeated until the required number of frames has been acquired. The image matrix size used is normally 64 x 64 or
128 X 128.
D ual isotope studies : Since some isotopes are multiple-energy emitters, and some clinical investigations can utilise two different isotopes (e.g. parathyroid imaging), gamma cameras have the facility to record events from more than one energy signal. These studies can be acquired in both static or dynamic mode. By a comparison of the images at the two energies a clearer image of target-organ function is obtained.
G ated studies: Gating an image is achieved by use of a physiological trigger or signal (e.g. an electrocardiograph) derived from equipment that independently monitors a physiological or physical parameter. The technique is known as Multiple Gated Acquisition (MUGA). MUGA enables a blood pool image of the beating heart to be acquired.
1.3.3 Image production in terms of camera components
The components in a gamma camera system were described in section 1.2. In this section the way in which the image is formed by the collim ator and the cam era is considered.
13,3.1 The uncollimated camera
The camera components which form the image of photons incident on the crystal are the crystal, the PM tubes, the pulse height analyser and associated electronics. The method of image production from these components was described in section 1.2. To achieve high spatial resolution from the camera a thin crystal is required, together with a large number of closely packed PM tubes. The efficiency of the camera is also dependent on the crystal thickness, a thicker crystal being more efficient than the thinner crystal required for high resolution.
1,3.3.2 The collimator
The spatial resolution and geometric efficiency can be expressed in terms of the collimator dimensions. If A is the hole length, d the hole diameter and ZA the source-to- coUimator distance, then the collimator spatial resolution R^. is given by (Anger 1964)
( , 3 ,
Equation (1.3) predicts the resolution of a collimator with square holes in a rectangular array. The equation assumes the collimator to move sideways with respect to the source and detector during the exposure. The resolution calculated is the full width at half maximum (FWHM) of the response to a point source along a single direction, the line of measurement being perpendicular to a hole edge (figure 1.8). For a point spread function (PSF) averaged over all directions the hole ‘diameter’ would need to consider all possible paths and rotational angles of the photons.
Collimator (viewed from above)
Direction of m otion of collimator Point .
source
Line of m easurem ent of PSF
Collimator (cross-section from side) \
Direction o f m otion of collimator
Figure 1.8 Measurement of PSF in Anger's equations (1964).
A simplified analysis of the effective hole diameter for a hexagonal hole collimator, flat-to-flat distance DF, might be as follows:
^V3DF 3DF 2 'l V 2 ^ 4 V s J
V3DF
= 0.866DF (1.4)
Thus the effective diameter of the hole would be expected to be approximately V s / l of the flat-to-flat hole size.
Figure 1.9 Method of calculating effective hole size.
The geometric efficiency g of the collimator is given by (Anger 1964)
o i2 g ~ K
A(d + 1)
(1.5)
where t is the septal thickness and K is a constant dependent upon hole shape and pattern. For hexagonal holes in a closely packed array K « 0.26. The efficiency is therefore independent of the source-to-collimator distance (in air) for a point source. For high efficiency thin collimators with large holes are desirable.
parallelism of holes caused by individual channels not being aligned with respect to each other. This non-parallelism can lead to non-uniformity and non-linearity in the image.
M odern im aging applications such as single photon em ission com puted tomography (SPECT) place stringent demands on cam era system perform ance. SPECT literature emphasises the requirements of both good uniformity (Rogers et al 1982) and spatial linearity (Chang et al 1985, 1988). The intrinsic uniformity and linearity of the camera have been improved but the uniformity and linearity of the collimation needs also to be improved. The uniformity of collimation is defined as the regional variation o f the efficiency across the collimator core. Any variation in the thickness of the collimator septa or distortion or damage caused in the construction process will affect the uniformity of the collimator. The linearity of collimation is dependent on the accuracy in the alignment of each channel in the colhmator. Algorithms for the reconstruction of data in SPECT assume that the collimator holes and septa are precisely perpendicular to the axis of the camera’s rotation throughout the rotation. If this is not the case then a centre of rotation offset occurs. The holes must also lie perpendicular to the top and bottom so that the holes are aligned orthogonally with respect to the axis of rotation.
/ |
/
1°
/ I
/
'
/
/
/
/ / / / / J / à
I
Point SourceFigure 1.10 The separation of images due to the angulation of septa.
example, a 1° channel tilt can introduce a 3.5 mm error in projection and backprojection at a distance of 20 cm (Chang et al 1988).
M ethods exist to measure the linearity and uniformity of collimators. Collimator uniform ity can be measured using a specially adapted rectilinear scanner to record the regional transmission rate of a radioactive source through a piece of collimator core on a point-by-point basis as a two-dimensional image. A slightly diverging scanning beam will reduce the system ’s sensitivity to small variations in collimator channel tilt (Chang et at
1988). Regional errors in channel angulation are measured on a gam m a cam era by acquiring static images of a tray of point sources at two altitudes above the collimator. The
X , y coordinates of each point source at each height are determined from the data and the
angulation error for each point source is determ ined from the shift in coordinates (Busemann-Sokole 1987). This calculation assumes that there are no sharp changes in channel tilt. The uniformity test would be more sensitive to such changes (Chang et al
1988).
The choice of collimator is dependent upon the study to be performed, e.g. pinhole for thyroid imaging, parallel hole for liver studies, etc., but the design of each type of collim ator can affect the final image. The optimisation of the design of a gamma camera collimator is a compromise between resolution and efficiency in order to obtain the best possible image of a source distribution. Equations 1.3 and 1.5 have shown that long holes of small diameter give high resolution while short holes of large diameter produce high efficiency — hence the necessary compromise between resolution and efficiency. In practice, the spatial resolution will be worsened due to the penetration of septa by photons. To minimise this the collimator should be constructed with thick septa and long holes from a high atomic number material such as lead. The hole shape and packing is also of importance. To maximise the exposed area of the crystal face a hexagonally close packed array o f round or hexagonal holes is preferred, the latter giving more uniform septal thickness throughout.
1 3 ,3 .3 Gamma camera components: conclusions
uniformity and linearity. The geometric resolution of the collimator is limited by efficiency considerations, while, in addition to being limited by the geometric resolution, the geometric efficiency of the collimator is affected by the septal thickness required to prevent septal penetration. Traditionally collimators have been constructed from lead, or a lead alloy, how ever recently others have used tungsten or titanium or alloys of these materials to im prove absorption properties. To improve geometric efficiency, while m aintaining geometric resolution, it is desirable to use a material with a higher linear attenuation coefficient than lead and investigations into the design of collimators using such materials would be useful. Due to the malleable nature of lead it is very easily damaged, and it has been demonstrated that collimators whose surfaces have been inadvertently damaged by denting with small hard objects can cause significant ring artefacts in reconstructed SPECT images (Jarritt and Ell 1984). Design improvements either in the collimator material or in the use of a protecting layer are desirable to minimise such effects. Another area of concern in gamma camera collimators is how closely they match the design specifications. Studies have demonstrated (Chang et al 1985, 1988, Gillen et al 1988, Malmin et al 1990) that defects in collimators, such as angulation error and variations in the resolution with direction exist in commercially available collimators and have consequences in the uniformity and linearity of images, both in planar and tomographic gamma camera imaging.
The colhmator limits the performance of the gamma camera imaging system more than any other individual component (Moore et al 1992) and therefore merits considerable attention. This thesis will investigate the conventional gamma camera collimator, using photon transport models to investigate the effects of penetration and scatter in the colhmator on planar imaging. Similar models will be used to investigate the effects o f colhm ator defects on images, and to produce images from alternative collimators, using different materials and designs.
1.3.4 Previous collimator studies and what has been achieved
collimator material. The minimum path length suggested by Anger was 3/|i which allowed for 5% penetration where \i is the linear attenuation coefficient of the collimator material. Other authors suggested restricting penetration to less than 1% by the use of much thicker collimator septa with a minimum path length of 5/|i (Kibby 1969).
Gerber and M iller (1974) modified the equation given by previous authors (Anger 1964, Keller 1968, Walker 1969) for the calculation of the geometric resolution o f a parallel hole collimator. They calculated that for a collimator that moves during the exposure, the geometric resolution (FWHM of the triangular shaped intensity distribution curve) is given by
d(Ap + ZA)
(1.6)2
where Ag = A — — the effective collimator length when penetration occurs, A is the
collimator length and p,(E) the linear attenuation coefficient of the collimator material. The rem aining variables in equation (1.6) are as defined in equation (1.3). Equation (1.6) considers the collimator hole length A to be reduced by l/|i on both ends to give A^, the effective collimator length when penetration effects are taken into account.
The effects of edge penetration for both single hole collimators (Simons 1962, BeU et al 1970) and for multihole focusing collimators (Rottenberg and Johns 1965, Simons 1970) have been investigated. M yhill (1961) also included the effects o f radiation penetrating the septa between collimator holes, as well as the septa edges, in his theory of the response of multihole focusing collimators. Both experimental and computer simulation techniques have been employed to investigate penetration effects. Christie and MacIntyre (1969) made experimental measurements of the line response of existing collimators using photon sources of two different energies, attributing the difference to penetration. M uehllehner and Luig (1973) used a ray tracing technique to determine line spread functions in an investigation of septal penetration in parallel hole collimators for various hole shapes. As a result of their work an existing collimator was improved by reducing the septal thickness. Similar studies have also been performed by Rotenberg and Johns (1965) and Simons (1970). The ray tracing technique has also been applied to multihole focusing collim ator geometry (Jahns 1981) to determine the geometric edge penetration and septum penetration, and to the design and analysis of collimators for high-energy photons (Beck and Redtung 1985a, 1985b).
1985b), and simulating photon transport in gamma camera systems (Rosenthal and Henry 1990, de Vries et al 1990 and Yanch et al 1992).
De Vries et al (1990) investigated the effects of high energy contaminant photons on im age quality. Using a 20% 1-123 energy window the authors found that photons scattered at least once in a low energy general purpose collimator comprised 27% for a Cr- 51 source (320 keV) and 33% for Sr-85 (514 keV). Yanch et al (1992) simulated SPECT by locating a virtual sphere around a phantom and storing the position coordinates, direction cosines, energy and scatter order of a photon passing through the sphere. The photon was then cloned and allowed to interact with all collimator positions with which it would interact. Each view was simulated on a different processor to provide a highly efficient process. The energy of each photon interacting with the camera plane was sampled for a Gaussian function with a FWHM o f 12% via an inverse probability distribution function, the same function being used regardless of the photon energy. Convolution techniques were used to incorporate the intrinsic spatial resolution of the camera, assuming a FWHM o f 3 mm. Such methods have been described by W hite (1979), Heller and Goodwin (1987) and Todd-Pokropek (1980).
1.3.5 Description of images in terms of response functions
As was discussed in section 1.2 gamma camera images are formed by the effects of several of the system’s components. Each of the components modifies the information from the source distribution. The way in which the information is modified is known as the response of the system. If, for example, the source distribution considered was a point source then the final image would be a blurred representation of that point source. The total response of the system is actually built up from the responses of the individual camera components. If, for example, a radiograph was taken of the photon distribution after the collimator stage, the image would show a blurring of the point source due to the range of angles of the photons after traversing the collimator. Each of the other camera components further blurs the information.
Under certain conditions, which will be considered in chapter two, the relationship between the object and the final image can be described in terms of a convolution. If the object is described by the function f and the image by the function g then the relationship between the image and the object is given by
g = h * f (1.7)
1.3.6 The advantages of working in response functions compared with complete Monte Carlo
One approach to numerically modelling a gamma camera system is to model the system by tracing individual photons from their origin until they are either photoelectrically absorbed in the collimator or crystal, or they reach a boundary beyond which they cannot be detected. In a single numerical model any light photon produced by the absorption in the crystal would then need to be traced to the photocathodes of the PM tubes, after which the electrons created would need to be followed through the PM tube dynode structure. The Anger logic circuitry and PHA would then require modelling before the final image could be obtained. Such a model would obviously be very complicated and would require lengthy CPU times due to numerous inefficiencies inherent in the system, the most prominent being the collimator inefficiency. Other inefficiencies exist such as non-absorption of photons by the crystal. In addition, for each different source distribution or collimator structure, it would be necessary to simulate the complete system from photon generation to image production.
The use of individual response functions can greatly simplify this procedure, eliminating some of the inefficiencies and reducing run times considerably. It is possible to measure the intrinsic response function of the uncollimated camera experimentally. The cam era approxim ates a linear system permitting the formation of an im age by the convolution of the camera response function with the photon distribution at the crystal face. The problem then remains of determining the photon distribution at the crystal face. Chapter two will discuss the fact that a typical patient and collimator system does not exhibit the spatial-invariance required to use the convolution technique. It is still however possible to obtain the collimator response to a point source and to combine it with the distribution of photons at the collimator surface to produce the distribution in the crystal. Although this technique does require both the determination of the collimator response by numerical simulation and the photon distribution at the collimator face, it has the advantage that a study of the effects on images of different collimators can be rapidly achieved for a particular source distribution without requiring the simulation of photon transport from the source through each collimator.
1.3.7 The collimator function
The collim ator was discussed in section 1.3.3.2. Equation (1.3) indicated the dependence on the source height of the collimator resolution for an ideal collimator. From this equation it is evident that any collimator response function could only be valid for a particular source height. For a three dimensional source distribution a different collimator response function would be required for each z-plane of activity in the source distribution.