Sleep Duration and Adiposity During Adolescence
WHAT’S KNOWN ON THIS SUBJECT:Some epidemiologic evidence suggests an inverse association between sleep duration and obesity in various age groups. However, in the case of
adolescents, inconsistent results have been reported, which can be partly explained by methodologic options.
WHAT THIS STUDY ADDS: Our study supports an effect of sleep duration in adiposity during adolescence and found gender differences in this association. The results are consistent by using either the traditional longitudinal approach or cross-lagged modeling.
abstract
BACKGROUND AND OBJECTIVE: The association between sleep and obesity has been described in different age groups. However, there are not sufficient data to clarify the inconsistent results reported in adolescents. Our objective was to study the associations between sleep duration and adiposity at 13 and at 17 years of age, with both cross-sectional and longitudinal approaches.
METHODS:We evaluated, as part of an urban population-based cohort (EPITeen), 1171 adolescents at both 13 and 17 years of age. Sleep duration was estimated by self-reported bedtimes and wake-up times. Age- and gender-specific BMIz scores were calculated based on Centers for Disease Control and Prevention references. Body fat percentage (BF%) was assessed by bioelectrical impedance. Regression coefficients (b) and respective 95% confidence intervals (CIs) were used to estimate the association between sleep and BMIz
scores and BF%. Additionally, a cross-lagged analysis was performed to investigate the causal relations.
RESULTS:In the cross-sectional analysis, at 13 years, sleep duration was inversely associated with BMI z score only in boys (b = 2 0.155, 95% CI:20.267 to 20.043); at 17 years, a positive association was found among girls but was only significant for BF% (b= 0.510, 95% CI: 0.061–0.958). In the longitudinal approach, sleep duration at age 13 was inversely associated with BMIzscore (b=20.123, 95% CI: 20.233 to20.012) and BF% (b=20.731, 95% CI:21.380 to20.081) at 17 years only in boys. These significant associations disappeared after adjustment for adiposity at 13 years. These results were corroborated by those from cross-lagged analysis.
CONCLUSIONS:Our results showed an effect of sleep duration in ad-iposity at younger ages of adolescence and suggested gender differ-ences in this association.Pediatrics2012;130:e1146–e1154
AUTHORS:Joana Araújo, MPH, Milton Severo, MSC, PhD, and Elisabete Ramos, MPH, PhD
Department of Clinical Epidemiology, Predictive Medicine and Public Health, and Cardiovascular Research & Development Unity, University of Porto Medical School, Porto, Portugal; and Institute of Public Health, University of Porto, Porto, Portugal
KEY WORDS
sleep, BMI, body fat, obesity, longitudinal, adolescence
ABBREVIATIONS
BF%—body fat percentage CI—confidence interval
FFQ—food frequency questionnaire
KIDMED—Mediterranean Diet Quality Index for children and ado-lescents
Ms Araújo drafted thefirst version of the manuscript, performed statistical analyses, and contributed to the interpretation of the results; Mr Severo performed statistical analyses and contributed to the interpretation of the results; and Dr Ramos conceived and designed the study and contributed to the interpretation and discussion of the data.
www.pediatrics.org/cgi/doi/10.1542/peds.2011-1116
doi:10.1542/peds.2011-1116
Accepted for publication Jul 3, 2012
Address correspondence to Joana Araújo, MPH, Department of Clinical Epidemiology, Predictive Medicine and Public Health, University of Porto Medical School, Alameda Prof. Hernâni Monteiro 4200-319 Porto, Portugal. E-mail: [email protected]
PEDIATRICS (ISSN Numbers: Print, 0031-4005; Online, 1098-4275).
Copyright © 2012 by the American Academy of Pediatrics
FINANCIAL DISCLOSURE:The authors have indicated they have nofinancial relationships relevant to this article to disclose.
Overweight is a major public health issue with high prevalence in both adulthood and childhood1–4and
nega-tive health consequences in children and adolescents5,6and in adulthood.5,7
Apart from direct health conse-quences, overweight also has social and economic repercussions.
From the standpoint of public health, modifiable risk factors, such as envi-ronmental and behavioral factors, are those most promising in terms of pre-vention and control of the obesity epi-demic. Therefore, several studies have focused their research on the role of food intake and physical activity in overweight. However, in recent years, the role of other factors, such as sleep duration, has gained attention.8,9Sleep
deprivation could influence the energy balance and consequently weight gain through various pathways, such as in-terfering in the regulation mechanisms of leptin, ghrelin, cortisol, and glucose or promoting patterns of behavior that cause weight gain (eating behavior and physical inactivity).10
In children, a consistent association was found between short sleep dura-tion and increased risk of obesity.11,12In
adolescents, fewer studies are avail-able,13–17and their results are not as
consistent as in younger children. Al-though some of them found an inverse association,15,16,18 others, which used
nationally representative surveys, re-ported inconsistent associations.13,17,19
The reasons for these differences among studies have not been clarified, making it necessary to produce new data that help us to understand the relation between sleep duration and weight gain in adolescents.
The importance of the effect of short sleep duration on weight gain has gained attention because there is evidence that sleep duration appears to have declined in recent decades.20The analysis of 3
birth cohorts (1974, 1979, and 1986) from Switzerland showed a decreasing
trend of the mean total sleep duration across cohorts due to progressively later bedtime and unchanged wake-up time across decades.20
Adolescence is also characterized by great changes in body composition21
that may not be detectable by BMI. Thus, if we intend to understand the effect of sleep on adiposity, other parameters such as body fat need to be examined. We therefore aimed to study the associations between sleep dura-tion and adiposity (BMI and body fat) during adolescence by using both a cross-sectional and longitudinal ap-proach.
METHODS Participants
The study population consisted of urban adolescents, members of the EPITeen cohort. As previously reported,22
ado-lescents born in 1990 and enrolled at public and private schools in Porto during 2003–2004 were invited to par-ticipate. The evaluation included self-administered questionnaires and a physical examination, performed by a trained team.
The second evaluation took place in the 2007–2008 school year, and adoles-cents were evaluated by using the same procedures.
At baseline, 2160 adolescents agreed to participate (77.5% of participation rate). Among these, 1716 (79.4%) par-ticipated in the second evaluation of the cohort. Of the 1716 participants reevaluated, we excluded those par-ticipants who did not have complete information in both evaluations re-garding weight or height (n= 95), body fat percentage (BF%;n= 10), and sleep duration (n= 197). We also excluded those with missing values in potential confounders: parental education (n= 3), age at menarche (n= 9), and diet (n= 231), resulting in a final sample of 1171 participants.
We compared the 1171 participants included in this analysis with those not included (considering exclusions and losses of follow-up). Those not included tended to be more frequently from public schools (82.3% vs 71.4%, P,
.001) and had less educated parents (parental education,6 years: 37.3% vs 19.8%). No significant differences were found according to gender and BMI at baseline.
Variables
Participants were asked to report usual bedtimes and wake-up times on week-days. Sleep duration was estimated by the difference between self-reported bedtimes and wake-up times.
Parental education level was measured as the number of successfully com-pleted years of formal schooling, and a new variable was created considering the information of the parent with the higher education level. The variable was used as continuous.
The questions used to assess physical activity and inactivity were based on a questionnaire usually applied to adolescents, the Young Finns Study.23In
our study, we used the self-perception of intensity of usual leisure-time activ-ities according to 4 subjective catego-ries (mainly sitting, mainly standing, active, or very active) for the mea-surement of physical activity.
Food intake was recorded by using a food frequency questionnaire (FFQ)24,25
regarding the previous 12 months, completed by the adolescents with the help of their parents or legal guard-ians. We computed a diet quality index based on the Mediterranean Diet Quality Index for children and adoles-cents (KIDMED).26Because we did not
a higher score corresponding to a diet closer to the Mediterranean diet.
Weight and height were obtained with the subject in light indoor clothes and no shoes, by using standard proce-dures.22BMIz scores were computed
according to Centers for Disease Con-trol and Prevention growth charts.27BF
% was estimated by bioelectrical im-pedance (Tanita TBF-300, Tanita Cor-poration of America, Inc, Arlington Heights, IL), and it is presented as the percentage of total body weight. Changes in BMI and in BF% were com-puted by a subtraction between the re-spective values at 17 years minus the values at 13 years. For BMI, we used the
zscores of BMI, and for BF% we used the original variable in percentage.
Statistical Analyses
Statistical analyses were performed by using SPSS, version 17.0 (SPSS Inc, Chicago, IL).
Quantitative variables between 2 in-dependent samples were compared by using the Mann-Whitney or Kruskal-Wallis test. The x2 test was used to compare qualitative variables. Nor-mality was checked by using the Shapiro-Wilk test.
To evaluate the association between participants’characteristics and sleep duration, we used linear regression models, calculating regression
coef-ficients (b) and respective 95%
con-fidence intervals (CIs). Regression coefficients and 95% CIs were also used to estimate the association be-tween sleep duration (independent variable) and either BMIzscore or BF% at baseline, at follow-up, and their changes between the 2 time points. For the construction of final models, we included the variables that were sig-nificantly associated with the outcome in the univariate analysis. Additionally, to minimize other sources of con-founding, we also included the varia-bles KIDMED index and leisure-time
activities, which, although not signifi -cantly associated, were relevant as possible confounders. In the first model, we adjusted the estimates for parental education and KIDMED index, when the exposure was sleep at 13 years, and we adjusted for parental education, when the exposure was sleep at 17 years. In model 2, we ad-justed for the same variables in model 1 plus adiposity (BMI or BF%) at age 13.
Regarding the assumptions for re-gression analyses, we tested the ho-moscedasticity of the errors and the normality of the error distribution. Al-though in some cases, the assumptions were not completely achieved, they were considered acceptable. For in-stance, in some cases, the distribution of the errors was not normal, consid-ering the Shapiro-Wilk test, but it was considered closer to the normal dis-tribution on the basis of histogram in-terpretation and considering the central limit theorem.
Additionally, we performed a cross-lagged analysis28 examining the
tempo-ral relationship between sleep duration and BMI and also between sleep dura-tion and BF%. These analyses were performed as path analyses within a structural equation modeling frame-work by using Mplus 5. In afirst anal-ysis, sleep duration and BMI at 17 years were the dependent variables and predictors were sleep and BMI at 13 years. The model has 3 components: an analysis between sleep and BMI at each age, a longitudinal analysis of each variable across the 2 ages, and the analysis of the cross-lags (sleep at 13 years with BMI at 17 years, and vice versa). Additionally, the analyses in-cluded parental education and KIDMED index as control variables.
The cross-lagged analyses were re-peated in an identical manner but with BF% instead of BMI.
The following criteria were used to assess the modelfit: thex2statistic test
that evaluates the overall fit of the model (nonsignificant x2 values in-dicate that the modelfits the data well; however, this index is sensitive to sample size)29; the root mean square
error of approximation, which
quanti-fies the divergence between the data and a proposed model per degree of freedom (values should be #.05)30;
and the comparative fit index, which ranges between 0 and 1 and repre-sents the proportionate improvement in model fit by comparing the fitted model with an independence model (indices..90 are considered good).29
Ethical Considerations
The study was approved by the Ethics Committee of Hospital São João, and policies and procedures were de-veloped to guarantee data confi den-tiality and protection. Parents and adolescents received written and oral information explaining the purpose and the design of the study and written informed consent was obtained from both.
RESULTS
Participants’ characteristics at base-line and at follow-up are presented in Table 1.
The median (25th; 75th percentiles) sleep duration at baseline was 9.0 (range 8.5–9.5) hours, which de-creased to 8.2 (range 7.5–9.0) hours at follow-up. In general, participants who presented higher sleep duration at baseline had the higher decrease in sleep duration but remained the ones with longer sleep duration at follow-up.
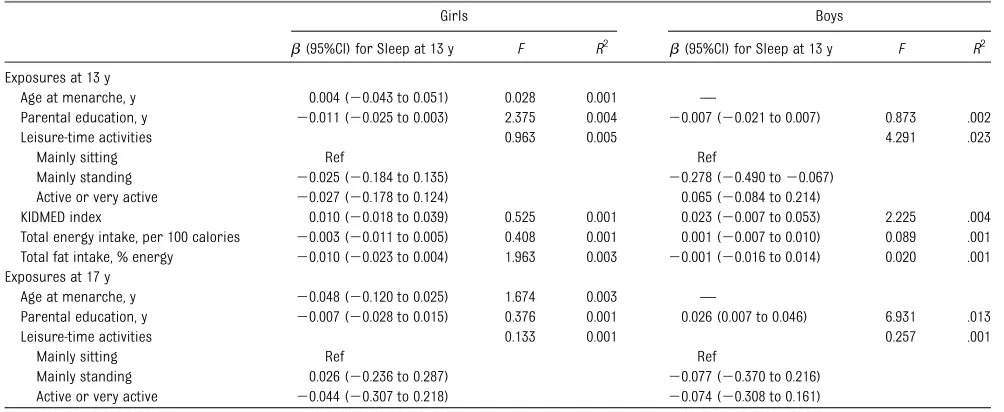
Considering the association between participants’characteristics and sleep duration (Table 2), only parental edu-cation was positively associated with sleep duration at age 17 (b = 0.026, 95% CI: 0.007–0.046) among boys.
13 years and BMI or BF%, we adjusted the model for parental education and KIDMED index. When the exposure was sleep duration at 17 years, we adjusted
the model only for parental education. We also tested the effect of leisure time activities at 13 and 17 years, when the exposure was sleep at 13 or at 17
years, respectively. Additionally, because physical activity may change from baseline to follow-up, we also tested a model including the variable mea-suring the variation in physical activity between the 2 evaluations. The results were similar, and these variables were not included in thefinal model.
In the cross-sectional analysis at age 13, after adjustment, sleep duration was inversely associated with BMIzscore only in boys (b = 20.155, 95% CI:2 0.267 to20.043; Table 3), but it was not associated with BF% in either boys or girls (Table 4). Regarding cross-sectional analysis at 17 years, a signif-icant and positive association was found only for BF% among girls (b= 0.510, 95% CI: 0.061–0.958; Table 4).
In the longitudinal approach, we ana-lyzed the effect of sleep duration by using 2 outcomes: adiposity at 17 years and the change in adiposity measured by the difference between 13 and 17 years. Regarding the difference in BMIz
score, 48% presented differences higher than20.2 SD, 33% maintained their BMI (differences in BMI between 20.2 and +0.2 SD), and 19% increased their BMI by .0.2 SD. Considering the linear regression models, sleep TABLE 1 Participants’Characteristics at 13 and at 17 Years of Age
Girls Boys P
Age at menarche, ya 12 (11–13)
Parental education, ya 11 (7–15) 12 (9–17) .004 13 y
Sleep, h/da 9.0 (8.5–9.5) 9.0 (8.5–9.5) .250 Body fat, %a 26.0 (21.1–30.6) 12.7 (9.7–18.5) ,.001
BMIa,b,c .099
,85th 491 (78.4) 399 (73.2)
$85th and,95th 82 (13.1) 93 (17.1)
$95th 53 (8.5) 53 (9.7)
Leisure–time activitiesb ,.001 Mainly sitting 190 (31.6) 139 (26.9)
Mainly standing 181 (30.1) 72 (13.9) Active or very active 230 (38.3) 306 (59.2)
Total energy intake, caloriesa 2395.2 (1907.2–2885.8) 2426.7 (1973.8–2926.0) .356 Total fat intake, %energya 31.9 (29.0–34.8) 32.0 (29.4–34.6) .918 KIDMED indexa 5.0 (4.0–7.0) 5.0 (4.0–7.0) .745 17 y
Sleep, h/da 8.2 (7.5–9.0) 8.0 (7.5–9.0) .250 Body fat, %a 24.7 (20.4–29.1) 12.2 (9.2–16.2) ,.001
BMIb,c .084
,85th 531 (84.8) 437 (80.2)
$85th and,95th 68 (10.9) 72 (13.2)
$95th 27 (4.3) 36 (6.6)
Leisure-time activitiesb ,.001 Mainly sitting 126 (21.3) 104 (19.9)
Mainly standing 236 (39.9) 97 (18.6) Active or very active 230 (38.9) 321 (61.5)
aMedians (25th–75th). bn(%).
cAccording to Centers for Disease Control and Statistics percentiles.27
TABLE 2 Association Between Participants’Characteristics and Sleep Duration at Age 13 and 17 Years
Girls Boys
b(95%CI) for Sleep at 13 y F R2 b(95%CI) for Sleep at 13 y F R2 Exposures at 13 y
Age at menarche, y 0.004 (20.043 to 0.051) 0.028 0.001 —
Parental education, y 20.011 (20.025 to 0.003) 2.375 0.004 20.007 (20.021 to 0.007) 0.873 .002
Leisure-time activities 0.963 0.005 4.291 .023
Mainly sitting Ref Ref
Mainly standing 20.025 (20.184 to 0.135) 20.278 (20.490 to20.067) Active or very active 20.027 (20.178 to 0.124) 0.065 (20.084 to 0.214)
KIDMED index 0.010 (20.018 to 0.039) 0.525 0.001 0.023 (20.007 to 0.053) 2.225 .004 Total energy intake, per 100 calories 20.003 (20.011 to 0.005) 0.408 0.001 0.001 (20.007 to 0.010) 0.089 .001 Total fat intake, % energy 20.010 (20.023 to 0.004) 1.963 0.003 20.001 (20.016 to 0.014) 0.020 .001 Exposures at 17 y
Age at menarche, y 20.048 (20.120 to 0.025) 1.674 0.003 —
Parental education, y 20.007 (20.028 to 0.015) 0.376 0.001 0.026 (0.007 to 0.046) 6.931 .013
Leisure-time activities 0.133 0.001 0.257 .001
Mainly sitting Ref Ref
Mainly standing 0.026 (20.236 to 0.287) 20.077 (20.370 to 0.216) Active or very active 20.044 (20.307 to 0.218) 20.074 (20.308 to 0.161)
duration at age 13 was inversely as-sociated with adiposity at 17 years in boys (BMIzscore:b=20.123, 95% CI: 20.233 to20.012; BF%:b = 20.731,
95% CI: 21.380 to 20.081) and posi-tively associated with the changes in BMI z score between ages 13 and 17 years in girls (b= 0.050, 95% CI: 0.002–
0.097; Tables 3 and 4). Regarding these longitudinal analyses, we created a second model, adjusting for the same variables in model 1 plus the adiposity TABLE 3 Cross-sectional and Longitudinal Associations Between Sleep Duration and BMIzScores
Crude Model 1 Model 2
b(95%CI) F R2 b(95% CI) F R2 b(95% CI) F R2 Cross-sectional
BMIzscore at 13 y Sleep at 13 y
Girls 20.052 (20.136 to 0.031) 1.507 .002 20.055 (20.139 to 0.029)a 0.744 .004 Boys -0.156 (20.268 to20.044) 7.527 .014 20.155 (20.267 to20.043)a 2.619 .014 BMIzscore at 17 y
Sleep at 17y
Girls 0.015 (20.038 to 0.067) 0.296 .001 0.014 (20.039 to–0.067)b 0.550 .002 Boys 20.058 (20.136 to 0.020) 2.136 .004 20.057 (20.135 to 0.022)b 1.139 .004
Longitudinal
BMIzscore at 13 y Sleep at 13 y
Girls 20.001 (20.082 to 0.080) 0.000 .001 20.005 (20.087 to 0.076)a 0.617 .003 0.039 (20.006 to 0.084) 357.204 0.697 Boys -0.121 (20.231 to20.011) 4.635 .008 20.123 (20.233 to20.012)a 1.678 .004 0.010 (20.044 to 0.065) 429.946 0.761 Changes in BMIzscore
(17–13 y) Sleep at 13 y
Girls 0.052 (0.004 to 0.099) 4.518 .007 0.050 (0.002 to 0.097)a 2.278 .011 0.039 (20.006 to 0.084) 22.070 0.124 Boys 0.035 (20.021 to 0.092) 1.526 .003 0.032 (20.024 to 0.089)a 0.982 .005 0.010 (20.044 to 0.065) 12.466 0.085 Model 1:
aAdjusted for parental education and KIDMED index; badjusted for parental education.
Model 2: Adjusted for variables in model 1+ BMIzscore at age 13 y.
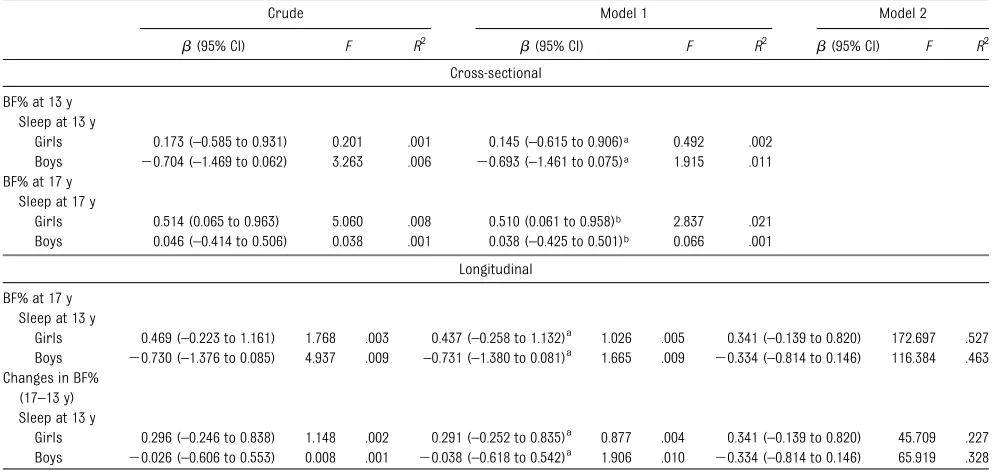
TABLE 4 Cross-sectional and Longitudinal Associations Between Sleep Duration and BF%
Crude Model 1 Model 2
b(95% CI) F R2 b(95% CI) F R2 b(95% CI) F R2 Cross-sectional
BF% at 13 y Sleep at 13 y
Girls 0.173 (–0.585 to 0.931) 0.201 .001 0.145 (–0.615 to 0.906)a 0.492 .002 Boys 20.704 (–1.469 to 0.062) 3.263 .006 20.693 (–1.461 to 0.075)a 1.915 .011 BF% at 17 y
Sleep at 17 y
Girls 0.514 (0.065 to 0.963) 5.060 .008 0.510 (0.061 to 0.958)b 2.837 .021 Boys 0.046 (–0.414 to 0.506) 0.038 .001 0.038 (–0.425 to 0.501)b 0.066 .001
Longitudinal
BF% at 17 y Sleep at 13 y
Girls 0.469 (–0.223 to 1.161) 1.768 .003 0.437 (–0.258 to 1.132)a 1.026 .005 0.341 (–0.139 to 0.820) 172.697 .527 Boys 20.730 (–1.376 to 0.085) 4.937 .009 –0.731 (–1.380 to 0.081)a 1.665 .009 20.334 (–0.814 to 0.146) 116.384 .463 Changes in BF%
(17–13 y) Sleep at 13 y
Girls 0.296 (–0.246 to 0.838) 1.148 .002 0.291 (–0.252 to 0.835)a 0.877 .004 0.341 (–0.139 to 0.820) 45.709 .227 Boys 20.026 (–0.606 to 0.553) 0.008 .001 20.038 (–0.618 to 0.542)a 1.906 .010 20.334 (–0.814 to 0.146) 65.919 .328
Model 1:
aAdjusted for parental education and KIDMED index; badjusted for parental education.
(BMI z score or BF%) at age 13. We found that after adjustment for base-line adiposity, the associations pre-viously described were no longer statistically significant (Tables 3 and 4).
Regarding cross-lagged analysis, Fig 1 presents the model examining the temporal relationship between sleep duration and BMI in girls and boys, adjusting for parental education and KIDMED score. Sleep duration at 17 was predicted by sleep duration at 13 years, and BMI at 17 was significantly pre-dicted by BMI at 13 years in both girls and boys. Regarding the cross-lagged effect from sleep at 13 years to BMI at 17 years, there was not a statistically significant association in either girls
(b= 0.041,P= .085) or boys (b= 0.013,
P = .635). The correlations between sleep duration and BMI at the same age were only significant in boys at 13 years (r=2.086,P= .016).
The cross-lagged model for BF% is presented in Fig 2. The cross-lagged effects were also not significant in both girls and boys. The association between BF% at 13 and at 17 years was statistically significant in girls (b = 0.661,P,.001) and in boys (b= 0.569,
P,.001). In addition to the significant association between sleep across the 2 ages, we also found a positive signifi -cant correlation between sleep at 17 years and BF% at 17 years in girls (r= .506,P= .018).
DISCUSSION
Among girls, we found a positive as-sociation between sleep duration and adiposity, significant for BF%. In con-trast, for boys, we found an inverse association between sleep duration and adiposity at 13 years, significant only for BMI. Also in boys, a significant inverse association was found between sleep duration at 13 years and BF% at 17 years, although the statistical signifi -cance disappeared after adjustment for BF% at age 13.
To address the problem of reverse causation and to investigate the causal relations, we also model the relation-ship between sleep and adiposity by
FIGURE 1
The temporal relationship between sleep duration and BMI: A, for girls; B, boys. Straight lines represent regression coefficients; curved lines represent correlations. Coefficients in the model are adjusted for parental education and KIDMED index, and those withP,.05 are printed in bold. CFI, comparativefit index; RMSEA, root-mean-square error of approximation.
FIGURE 2
using cross-lagged analysis. The re-sults from these models corrobo-rated those from linear regression models.
A large set of evidence supports the inverse association between sleep du-ration and BMI found in boys.14,16,31–33
Other studies, like ours, support the gender differences showing no asso-ciation in girls.13,17 One possible
ex-planation would be a different duration of sleep between girls and boys; how-ever, the median sleep duration was similar according to gender at both 13 and 17 years. These gender differences might also be due to physiologic gen-der differences during adolescence. Because girls experience greater changes in fat mass during early ado-lescence compared with boys,34 the
effect of sleep could be masked in girls and not in boys, especially at age 13 when endocrine changes are more pronounced for girls. At 17 years, when most changes have oc-curred, we were able tofind an as-sociation between sleep duration and BF% in girls. However, we were not able to find a reasonable expla-nation for the direction of this asso-ciation. A possible explanation would be a U-curve relationship between sleep duration and BMI, as described in some cross-sectional studies in adults.35,36However, our data do not
allow us to test a possible U-shaped association, because the variability of sleep duration at 13 years is low in our population and only 4.9% of adolescents sleep,8 hours per day and among these the median (25th– 75th percentiles) is 7.5 hours per day (range 7.3–7.8). Therefore, more studies are necessary to better un-derstand thisfinding.
Among boys, the association between sleep at 13 years and BMI at 17 years could reflect the cross-sectional asso-ciation found at 13 years, because when we adjusted the estimates for BMI at age
13 (model 2), the effect disappeared. In path analysis, cross-lagged effects were not significant, reinforcing the theory that in boys sleep may have a more relevant effect at early ages than in late adolescence.12,37,38
Additionally, our linear regression models presented low coefficients of determination, supporting the idea that sleep only explains a small part of the variation in adiposity. This was expec-ted, because obesity is a multifactorial disease, presenting a multiple possible and concomitant causes. It should also be recognized that 1 possible explana-tion for some of our results may be that our data do not allow the quality of sleep to be taken into account. Another possible limitation is the methodology used to estimate sleep duration. However, for weeknights, a study of high school adolescents found high correlations between actigraphy and self-reported bedtimes (r = .70) and wake-up times (r= .77).39Thus, even
with limitations on the accurate quantification of sleep time, we can accept that our measure is good enough to discriminate our partic-ipants according to their sleep dura-tion. Additionally, it is possible that a measurement error might have given rise to nondifferential mis-classification and the associations between sleep and adiposity may be underestimated.
Regarding the measurements of body composition, because BMI does not distinguish fat mass from fat-free mass,40,41we also studied the BF% as
outcome. Bioelectrical impedance of 2 components is not the reference method, but it is one of the most widely used methods because of its ease of use, and it is considered an accurate technique in the measurement of body composition.42,43 Additionally, because
the error in estimating fat mass by bioelectrical impedance is expected to be consistent across the range of body
composition,44 this error would have
a minor effect on the estimation of the association according to sleep dura-tion by gender. The analysis with BF% allowed us to detect some effects from sleep duration in girls, not identified with BMI. In contrast, the association found between sleep and BMI in boys at 13 years was not significant by us-ing BF%, although it was in the same direction. We cannot exclude the error on body fat measurement as a possi-ble explanation for this loss of power in boys because an underestimation of fat mass among boys measured by bioelectrical impedance has been reported.44These results support the
theory of gender differences in the association between sleep and adi-posity and should be better addressed and clarified.
In relation to the outcome variables, the limitations related with the use of raw differences in BMIzscores between the 2 ages must also be recognized. How-ever, we examined the distribution of the difference in BMIzscore, and this variable mainly represents those par-ticipants whose BMI decreased. Addi-tional analysis (data not shown) of sleep duration according to changes in BMIzscore showed that higher sleep duration is associated with smaller decreases in BMI. This is in accordance with the cross-sectional result in which higher sleep duration was inversely associated with BMI, and subjects with lower BMI at baseline were less likely to register a decrease in BMI between the 2 ages.
The dietary intake in our study was measured through an FFQ developed by our department, validated for an adult population and adapted to be applied in adolescents.45The FFQ is a useful
in-strument for the evaluation of diet in population-based studies, allowing for discrimination according to usual en-ergy and nutrient intakes.46Although
a previous study showed that for the same population, an FFQ developed for adults could be used in adolescents.47
However, it is possible that our results could be affected by the known differ-ential error on intake report, accord-ing to BMI. The increase in the underreporting of food intake with increasing BMI48 may explain the
weak associations found with dietary variables.
We decided to adjust the statistical models for the KIDMED index instead of total energy intake, because the mag-nitude of the crude association with sleep duration was higher for the KIDMED score, and adjusting for both variables would not be possible due to colinearity. Additionally, it is probable that KIDMED would be less affected by the information bias related with BMI, compared with the total energy intake.
We had to exclude some participants with missing information or who were lost to follow-up. Although the partic-ipants not considered in this study were not significantly different from those included in terms of gender and BMI categories at baseline, we have an un-derrepresentation of adolescents from lower socioeconomic classes.
Even though our study presents some limitations there are 2 very important strengths. Our study was conducted on a large sample of population-based adolescents, with compulsory school education and a high proportion of participation at baseline and also at follow-up, supporting the external val-idity of our results. The longitudinal approach is another of our strengths since this is one of the few studies that performed a longitudinal analysis on this topic in this age group.
CONCLUSIONS
Among girls, sleep duration was di-rectly associated with body fat in the cross-sectional analysis at 17 years. Among boys, sleep duration was in-versely associated with both adiposity measures in the cross-sectional anal-ysis at age 13. The longitudinal effect found in boys disappears after adjust-ment for adiposity measures at 13 years, reinforcing the theory that the influence of sleep duration may be more relevant at younger ages in this group.
Our data and results from other studies underline the fact that sleep duration should be assessed in clinical practice to promote longer sleep duration in short sleepers. However, caution is necessary regarding upper limits of sleep duration because a possible U-shape association has not yet been clearly established.
REFERENCES
1. Flegal KM, Carroll MD, Ogden CL, Curtin LR. Prevalence and trends in obesity among US adults, 1999-2008. JAMA. 2010;303(3):235– 241
2. Kosti RI, Panagiotakos DB. The epidemic of obesity in children and adolescents in the world.Cent Eur J Public Health. 2006;14(4): 151–159
3. Lobstein T, Millstone E; PorGrow Research Team. Context for the PorGrow study: Europe’s obesity crisis. Obes Rev. 2007;8 (suppl 2):7–16
4. Ogden CL, Carroll MD, Curtin LR, Lamb MM, Flegal KM. Prevalence of high body mass index in US children and adolescents, 2007–2008.JAMA. 2010;303(3):242–249 5. Reilly JJ, Methven E, McDowell ZC, et al.
Health consequences of obesity. Arch Dis Child. 2003;88(9):748–752
6. Daniels SR, Arnett DK, Eckel RH, et al. Overweight in children and adolescents: pathophysiology, consequences, prevention, and treatment. Circulation. 2005;111(15): 1999–2012
7. Must A, Jacques PF, Dallal GE, Bajema CJ, Dietz WH. Long-term morbidity and mor-tality of overweight adolescents. A follow-up of the Harvard Growth Study of 1922 to 1935.N Engl J Med. 1992;327(19):1350–1355
8. Bass J, Turek FW. Sleepless in America: a pathway to obesity and the metabolic syn-drome?Arch Intern Med. 2005;165(1):15–16 9. Eisenmann JC. Insight into the causes of
the recent secular trend in pediatric obe-sity: common sense does not always pre-vail for complex, multi-factorial phenotypes.
Prev Med. 2006;42(5):329–335
10. Magee CA, Huang XF, Iverson DC, Caputi P. Examining the pathways linking chronic sleep restriction to obesity [published online ahead of print February 16, 2010].
J Obes.doi:10.1155/2010/821710
11. Chen X, Beydoun MA, Wang Y. Is sleep du-ration associated with childhood obesity? A systematic review and meta-analysis. Obe-sity (Silver Spring). 2008;16(2):265–274 12. Patel SR, Hu FB. Short sleep duration and
weight gain: a systematic review.Obesity (Silver Spring). 2008;16(3):643–653 13. Knutson KL. Sex differences in the
associ-ation between sleep and body mass index in adolescents.J Pediatr. 2005;147(6):830– 834
14. Beebe DW, Lewin D, Zeller M, et al. Sleep in overweight adolescents: shorter sleep, poorer sleep quality, sleepiness, and sleep-disordered breathing. J Pediatr Psychol. 2007;32(1):69–79
15. Gupta NK, Mueller WH, Chan W, Meininger JC. Is obesity associated with poor sleep quality in adolescents? Am J Hum Biol. 2002;14(6):762–768
16. Chen MY, Wang EK, Jeng YJ. Adequate sleep among adolescents is positively associated with health status and health-related behaviors.BMC Public Health. 2006;6:59 17. Eisenmann JC, Ekkekakis P, Holmes M.
Sleep duration and overweight among Australian children and adolescents. Acta Paediatr. 2006;95(8):956–963
18. Garaulet M, Ortega FB, Ruiz JR, et al. Short sleep duration is associated with increased obesity markers in European adolescents: effect of physical activity and dietary hab-its. The HELENA study. Int J Obes (Lond). 2011;35(10):1308–1317
19. Calamaro CJ, Park S, Mason TB, et al. Shortened sleep duration does not predict obesity in adolescents.J Sleep Res. 2010;19 (4):559–566
20. Iglowstein I, Jenni OG, Molinari L, Largo RH. Sleep duration from infancy to adoles-cence: reference values and generational trends.Pediatrics. 2003;111(2):302–307 21. Loomba-Albrecht LA, Styne DM. Effect of
22. Ramos E, Barros H. Family and school determinants of overweight in 13-year-old Portuguese adolescents. Acta Paediatr. 2007;96(2):281–286
23. Raitakari OT, Taimela S, Porkka KV, et al. Associations between physical activity and risk factors for coronary heart disease: the Cardiovascular Risk in Young Finns Study.
Med Sci Sports Exerc. 1997;29(8):1055– 1061
24. Lopes C. Reproducibility and validity of semi-quantitative food frequency question-naire. In:Diet and Myocardial Infarction: A Community-Based Case-Control Study [in Portuguese]. Porto, Portugal: University of Porto; 2000
25. Lopes C, Aro A, Azevedo A, Ramos E, Barros H. Intake and adipose tissue composition of fatty acids and risk of myocardial infarction in a male Portuguese community sample.
J Am Diet Assoc. 2007;107(2):276–286 26. Serra-Majem L, Ribas L, Ngo J, et al. Food,
youth and the Mediterranean diet in Spain. Development of KIDMED, Mediterranean Diet Quality Index in children and adoles-cents.Public Health Nutr. 2004;7(7):931–935 27. Kuczmarski RJ, Ogden CL, Guo SS, et al. 2000 CDC Growth Charts for the United States: methods and development. Vital Health Stat 11. 2002;(246):1–190
28. Kline RB. Structural Equation Modeling. New York, NY: Guilford Press; 2005 29. Bentler PM. Comparative fit indexes in
structural models. Psychol Bull. 1990;107 (2):238–246
30. Steiger JH. Structural model evaluation and modification: an interval estimation approach.Multivariate Behav Res. 1990;25 (2):173–180
31. Seicean A, Redline S, Seicean S, et al. As-sociation between short sleeping hours
and overweight in adolescents: results from a US Suburban High School survey.
Sleep Breath. 2007;11(4):285–293 32. Danielsen YS, Pallesen S, Stormark KM,
Nordhus IH, Bjorvatn B. The relationship between school day sleep duration and body mass index in Norwegian children (aged 10-12).Int J Pediatr Obes. 2010;5(3): 214–220
33. Wells JC, Hallal PC, Reichert FF, Menezes AM, Araújo CL, Victora CG. Sleep patterns and television viewing in relation to obesity and blood pressure: evidence from an ad-olescent Brazilian birth cohort.Int J Obes (Lond). 2008;32(7):1042–1049
34. Veldhuis JD, Roemmich JN, Richmond EJ, et al. Endocrine control of body composi-tion in infancy, childhood, and puberty.
Endocr Rev. 2005;26(1):114–146
35. Bjorvatn B, Sagen IM, Øyane N, et al. The association between sleep duration, body mass index and metabolic measures in the Hordaland Health Study.J Sleep Res. 2007; 16(1):66–76
36. Taheri S, Lin L, Austin D, Young T, Mignot E. Short sleep duration is associated with re-duced leptin, elevated ghrelin, and increased body mass index.PLoS Med. 2004;1(3):e62 37. Bibiloni MM, Martinez E, Llull R, Juarez MD,
Pons A, Tur JA. Prevalence and risk factors for obesity in Balearic Islands adolescents.
Br J Nutr. 2010;103(1):99–106
38. Knutson KL, Lauderdale DS. Sleep dura-tion and overweight in adolescents: self-reported sleep hours versus time diaries.
Pediatrics. 2007;119(5). Available at: www. pediatrics.org/cgi/content/full/119/5/e1056 39. Wolfson AR, Carskadon MA, Acebo C, et al. Evidence for the validity of a sleep habits survey for adolescents. Sleep. 2003;26(2): 213–216
40. Lazarus R, Baur L, Webb K, Blyth F. Body mass index in screening for adiposity in children and adolescents: systematic eval-uation using receiver operating charac-teristic curves.Am J Clin Nutr. 1996;63(4): 500–506
41. Prentice AM, Jebb SA. Beyond body mass index.Obes Rev. 2001;2(3):141–147 42. Tyrrell VJ, Richards G, Hofman P, Gillies GF,
Robinson E, Cutfield WS. Foot-to-foot bio-electrical impedance analysis: a valuable tool for the measurement of body compo-sition in children.Int J Obes Relat Metab Disord. 2001;25(2):273–278
43. Paineau D, Chiheb S, Banu I, et al. Com-parison of field methods to estimate fat mass in children.Ann Hum Biol. 2008;35(2): 185–197
44. Haroun D, Taylor SJ, Viner RM, et al. Vali-dation of bioelectrical impedance analysis in adolescents across different ethnic groups.Obesity (Silver Spring). 2010;18(6): 1252–1259
45. Araújo J, Severo M, Lopes C, Ramos E. Food sources of nutrients among 13-year-old Portuguese adolescents. Public Health Nutr. 2011;14(11):1970–1978
46. Araujo MC, Yokoo EM, Pereira RA. Validation and calibration of a semiquantitative food frequency questionnaire designed for ado-lescents. J Am Diet Assoc. 2010;110(8): 1170–1177
47. Shatenstein B, Amre D, Jabbour M, Feguery H. Examining the relative validity of an adult food frequency questionnaire in children and adolescents. J Pediatr Gas-troenterol Nutr. 2010;51(5):645–652 48. Santos LC, Pascoal MN, Fisberg M, Cintra IP,
DOI: 10.1542/peds.2011-1116 originally published online October 1, 2012;
Services
Updated Information &
http://pediatrics.aappublications.org/content/130/5/e1146
including high resolution figures, can be found at:
References
http://pediatrics.aappublications.org/content/130/5/e1146#BIBL
This article cites 45 articles, 5 of which you can access for free at:
Subspecialty Collections
dicine_sub
http://www.aappublications.org/cgi/collection/adolescent_health:me Adolescent Health/Medicine
following collection(s):
This article, along with others on similar topics, appears in the
Permissions & Licensing
http://www.aappublications.org/site/misc/Permissions.xhtml
in its entirety can be found online at:
Information about reproducing this article in parts (figures, tables) or
Reprints
http://www.aappublications.org/site/misc/reprints.xhtml
DOI: 10.1542/peds.2011-1116 originally published online October 1, 2012;
2012;130;e1146
Pediatrics
Joana Araújo, Milton Severo and Elisabete Ramos
Sleep Duration and Adiposity During Adolescence
http://pediatrics.aappublications.org/content/130/5/e1146
located on the World Wide Web at:
The online version of this article, along with updated information and services, is
by the American Academy of Pediatrics. All rights reserved. Print ISSN: 1073-0397.